Abstract
In order to select key risk factors, effectively control risks, and promote the smooth development of the whole process of engineering consulting consortium, Based on WBS-RBS risk identification in the whole process of engineering consulting, this paper introduces FMEA model, applies rough set and binary semantics to evaluate risk from multiple dimensions of occurrence, severity and difficulty to detect, and uses G1-improved CRITIC to calculate the comprehensive weight of risk evaluation factors, and then severity is revised based on DEMATEL. The GRA-TOPSIS model is constructed for risk ranking. Finally, the model is applied to a road network project and the analysis shows that communication and coordination risk, termination risk and schedule risk are the key risks. The model is suitable for risk assessment in the joint body and provides a feasible method for risk control in the whole process of engineering consulting consortia.
Highlights
- Binary semantics and rough sets are used to deal with evaluation semantics, which solves the problem that evaluation granularity is inconsistent and difficult to quantify.
- The hesitancy fuzzy DEMATEL was applied to modify the risk severity, and the correlation of risk factors was considered.
- GRA-TOPSIS was used to solve the problem that TOPSIS method could not reflect the dynamic change of evaluation index sequence.
1. Introduction
At present, the engineering consulting industry is dominated by many small and medium-sized companies, and the whole process of engineering consulting business is mainly carried out in the form of a consortium. When carrying out the whole-process engineering consulting business in the form of a consortium, effective risk control is extremely critical [1]. Scientific risk assessment is the basis of risk management and control. Key risk factors are selected scientifically, and through mechanism analysis, risks can be prevented and Probability of risk occurrence can be reduced [2]. In the existing risk assessment studies, Y. R. Du [3] and Q. Zhang [4] respectively applied AHP fuzzy comprehensive evaluation method and CIM-AHP to assess the overall risk of the whole process of engineering consulting. This kind of method is simple and feasible, but the evaluation method is subjective. M. Wang calculated the weight of risk indicator based on the improved AHP-CRITIC method, and introduced MARCOS method to sort risk [5]. Y. G. He used G1-entropy weight method to calculate the weight of risk indicators and applied cloud model to evaluate the level of power security risk [6]. R. P. Chen improved TOPSIS model based on FAHP-interval number to evaluate construction safety risk [7]. Although this kind of method is objective, the risk evaluation dimension is single. L. Wei applied CSA-BP neural network algorithm to evaluate construction risk [8]. Y. T. Huang calculated index correlation weights based on ANP and used SSA-BP model to assess schedule risks [9]. This kind of evaluation method is objective, but the required data breadth is large and the evaluation system is unstable. J. X. You [10] and X. D. Shi [11] proposed to introduce FMEA model to assess risk from multiple dimensions of occurrence, severity and detection. Binary semantics and trigonometric fuzzy function quantization semantics were used respectively. Grey correlation and TOPSIS model were used to sort risks and select key risk factors. Through the analysis of the above literature, it can be seen that the current risk assessment model has some problems, such as subjective assessment process, single evaluation dimension, unstable risk assessment system and weak operability. FMEA failure mode and impact analysis is a multi-dimensional analysis model with practicability and maneuverability. By introducing FMEA model and improving it through various algorithms, an effective whole-process engineering consulting joint in vivo risk assessment model can be built.
After the comprehensive identification of risk factors, the FMEA model was introduced in this study, and the FMEA model was improved from the perspective of scientific quantitative evaluation semantics, consideration of evaluation factors and expert weights, and risk factor correlation. GRA-TOPSIS-FMEA model was adopted to evaluate the risk of the whole process of engineering consulting consortium, and the key risk factors were selected reasonably.
2. Risk identification of whole process engineering consulting consortium based on WBS-RBS
In the analysis of WBS, the whole life working cycle is divided into investment decision stage, project construction preparation stage, project construction stage, project operation and maintenance stage. In the RBS analysis, risk factors were divided from macro, microcosmic and medium-micro perspectives.
Based on the “Whole-process Engineering Consulting Contract Model Text” and “Whole-Process Engineering Consulting Standard of Construction Projects” and expert evaluation, the work flow and risk factors at each stage were analyzed, the WBS-RBS risk identification coupling matrix was constructed to identify the risks at different stages and realize the comprehensive identification of risk factors in the whole-process engineering consulting consortium.
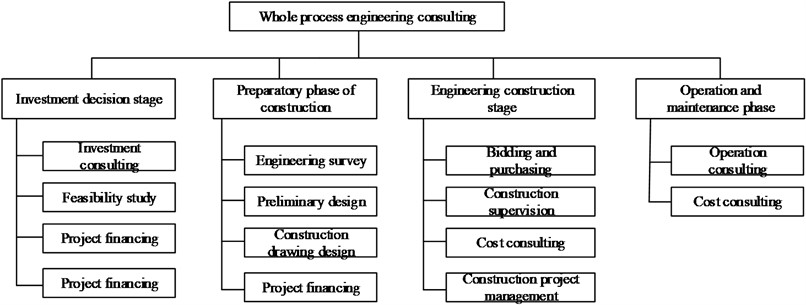
2.1. Based on WBS, the whole process of engineering consulting workflow is decomposed
Each stage of the whole process of engineering consulting is decomposed, as shown in Fig. 1.
Fig. 1Based on WBS whole-process engineering consulting work breakdown
2.2. Based on RBS, the whole process of engineering consulting consortium internal risk analysis
Risk factors in the whole process of engineering consulting association were divided from macro, microcosmic and medium-micro perspectives, as shown in Fig. 2.
2.3. The WBS-RBS coupling matrix was constructed to identify the risk factors
Industry experts were invited to construct the WBS-RBS coupling matrix, and the list of risk factors in the whole process of engineering consulting association was determined, as shown in Table 1.
Fig. 2Combined internal risk analysis based on RBS whole process engineering consulting
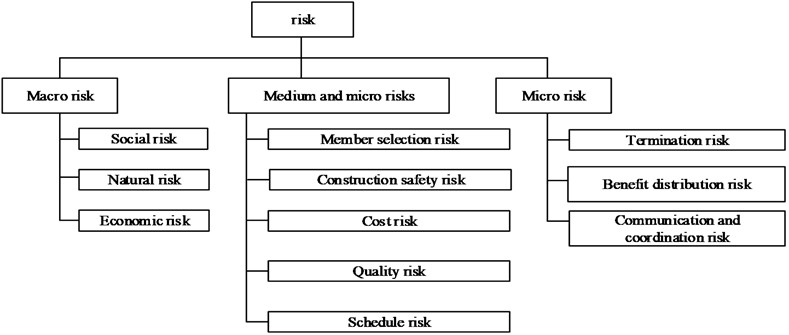
Table 1WBS-RBS coupling matrix
WBS | RBS | |||
… | ||||
… | ||||
… | ||||
… | … | … | … | … |
… | ||||
3. Risk assessment model based on GRA-TOPSIS-FMEA
FMEA (failure mode and consequence analysis) model was introduced to evaluate the risk occurrence probability (occurrence degree O), the damage degree of risk to the project (severity S), and the difficulty degree of risk detection (difficulty degree D).
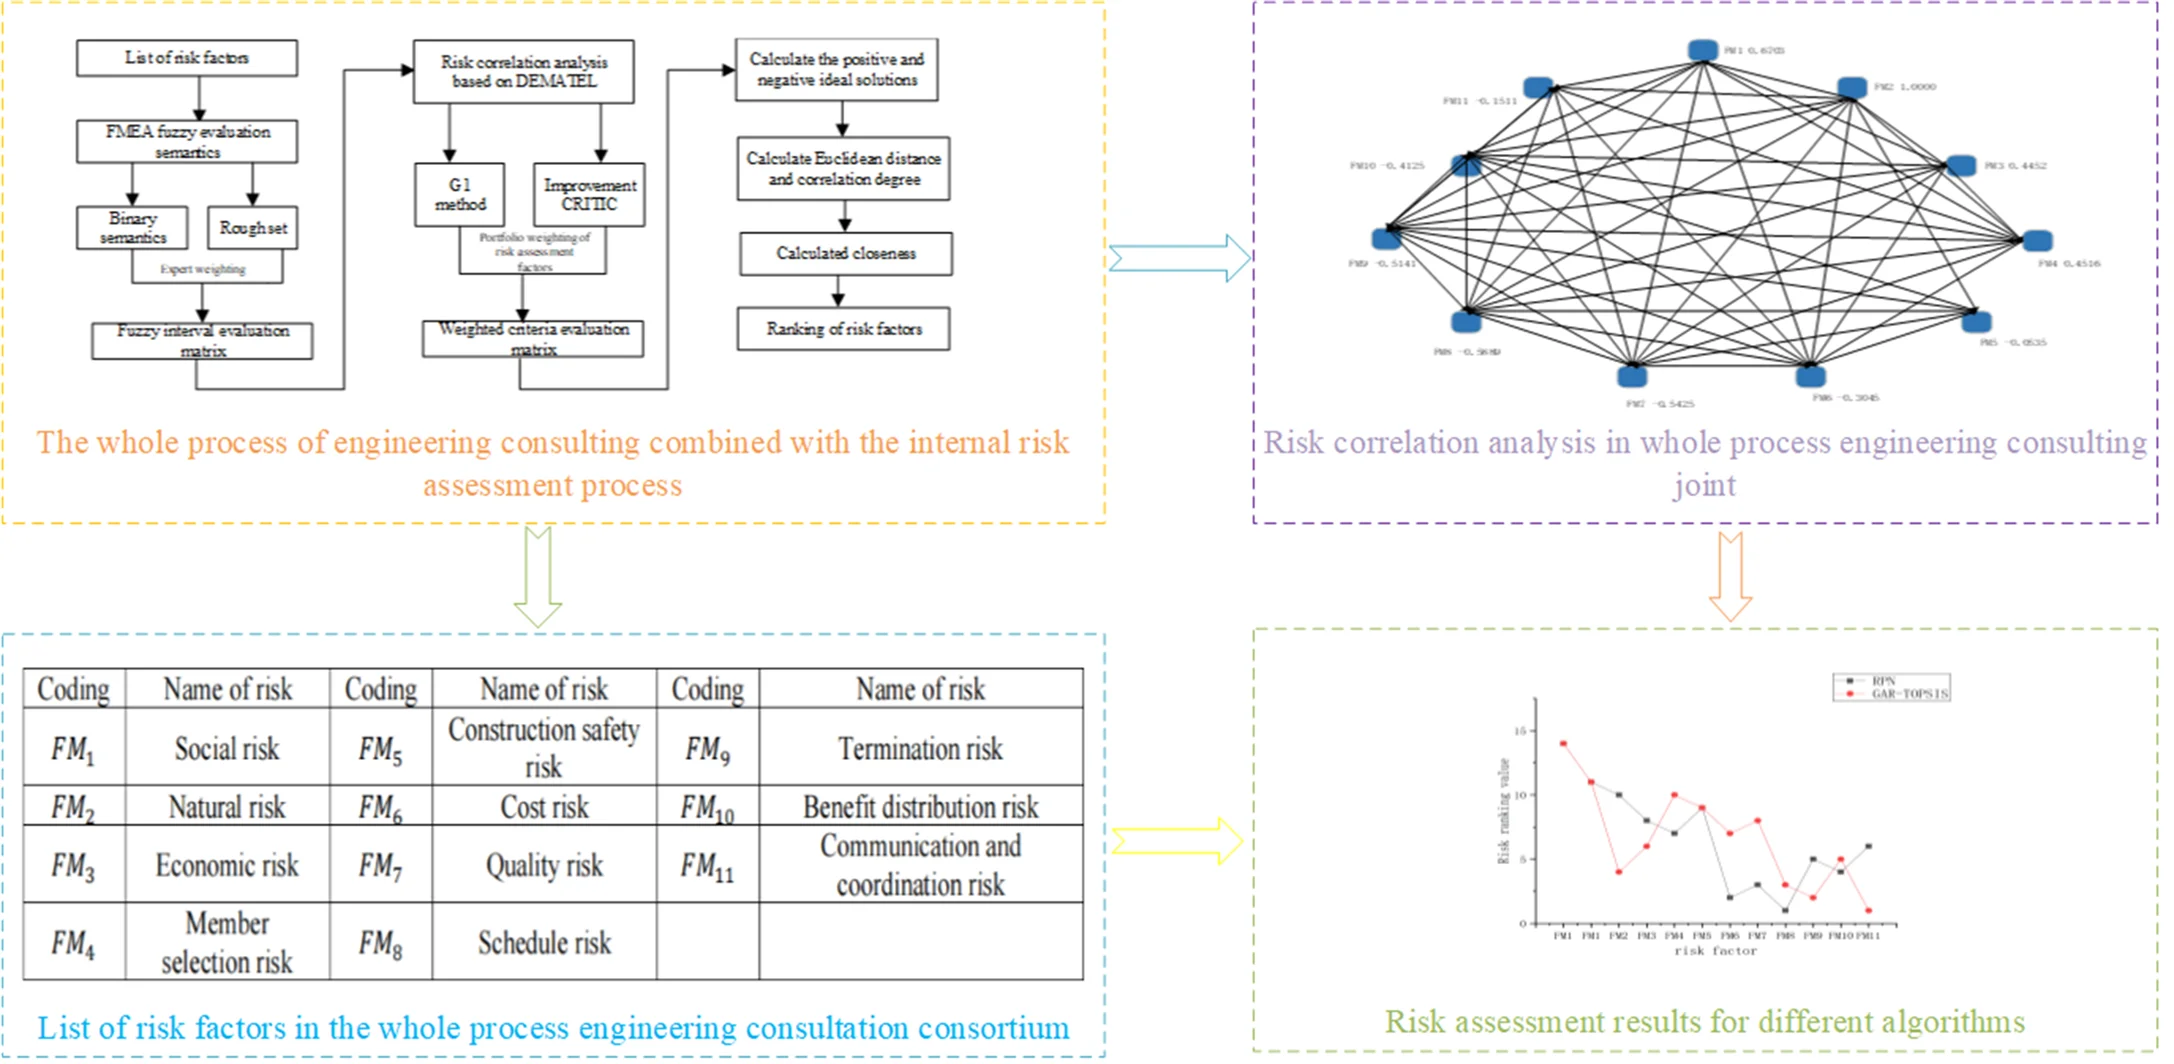
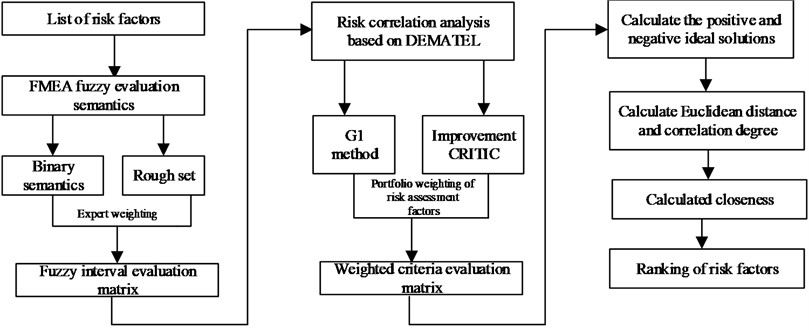
The traditional FMEA model is difficult to quantify the semantics of risk assessment. Evaluation experts and risk assessment factor weights are not considered; Different combinations of risk factors may have the same RPN value, but different hidden risks. The core idea of this model is as follows: DEMATEL model was used to revise severity S, G1-Improvement CRITIC was applied to obtain subjective and objective weight of risk evaluation factors, comprehensive weight was determined based on minimum distance difference, and risk ranking was obtained by GRA-TOPSIS. The specific process is shown in Fig. 3.
Fig. 3The whole process of engineering consulting combined with the internal risk assessment process
3.1. Quantitative evaluation semantics based on fuzzy hesitation set
Binary semantics is a semantic quantization method, First let the fuzzy hesitation set be , in which is an even number:
In order to maintain the integrity of information, it is difficult to quantify the problem of inconsistent evaluation granularity. The evaluation information is discretized based on rough set, and the lower limit and upper limit of the interval are determined according to the evaluation data. The range of objects is , and sort all objects, for ,
The lower approximation domain of is defined as:
The upper approximation domain of is defined as:
and are respectively the lower limit and upper limit of , They are defined as:
Rough set transforms into a set of interval numbers, According to the expert to distinguish different levels corresponding weights, using the method of weighted arithmetic mean as the into as interval Numbers . The expert weight is calculated as follows:
where is the qualification level of the expert, is the work experience, is the project familiarity.
3.2. Correction for risk severity based on fuzzy DELTATE
In the whole process of engineering consulting association, the interaction between risk factors is complicated, which greatly affects the stability of the risk assessment system. Therefore, fuzzy DELTATE model is introduced to analyze the risk correlation, and the specific calculation steps are as follows.
3.2.1. The fuzzy interval type correlation matrix is constructed
According to the 7-particle evaluation word order, experts were invited to evaluate the interaction between the identified risk factors. Fuzzy hesitation level was applied to quantify the evaluation semantics, and maximum value method was used to normalize it. The normalized correlation matrix is shown as follows:
3.2.2. Calculate the comprehensive influence matrix
The solution formula is as follows. Where is the identity matrix:
3.2.3. Determine the net impact of risk factors
As matrix to , the i row are defined as , the m column are defined as , represents the impact of risk pattern, represents the impact of risk pattern. Among them, expresses the net impact degree of risk model. On the whole, the larger the value, the more important to the risk [12]. Therefore, the net impact value of risk factors has a greater correlation with the importance degree of risk factors. and are normalized respectively. Get and risk model corrected by the changes in the DEMATEL. The calculation formula is as follows:
where is the average of the upper and lower limits of the evaluation information.
3.3. Risk evaluation factor weight based on G1-CRITIC combination weight evaluation
3.3.1. G1 sequence method
Step 1: According to the importance of evaluation indicators, experts are invited to evaluate and the sequence relationship of each evaluation indicator is finally written as .
Step 2: According to the importance degree between risk evaluation factors, inviting experts to evaluate the scale value . and according to Eqs. (9) and (10), getting the weight set of evaluation indicators . The weight calculation method of each evaluation index is as follows:
3.3.2. Improve the CRITIC method
Improvement of traditional CRITIC method: since standard deviation cannot accurately measure the dimensional and order of magnitude variability between indicators, it can be measured by coefficient of variation instead. At the same time, considering the positive and negative correlation between indicators and correlation coefficient, the correlation coefficient is absolute value.
Firstly, the original evaluation matrix was constructed, and each index in the evaluation matrix was standardized according to Eq. (11), where and are the sample mean and standard deviation respectively. The coefficient of variation of each index was calculated according to Eq. (12), and the Pearson correlation coefficient, was calculated. According to Eq. (13), the comprehensive coefficient of the independence degree of each index is obtained, and finally the weight of each index is determined according to Eq. (14):
3.3.3. G1 method and improve the CRITIC method integrated empowerment
In order to reflect the influence of subjective and objective weight on the indicator system at the same time, the G1 method should be combined with the subjective and objective weight of improving CRITIC method, and the final vector is . The influence value of scheme J on adaptation factor K is known to be , and the subjective and objective weighted attribute values are and . Solution can be determined the subjective weight value deviation degree . Subjective and objective weights in order to ensure consistency, to ensure the minimum deviation degree, according to the Eq. (15) to calculate weight comprehensive [13]:
3.4. Risk ranking was conducted based on GRA-TOPSIS
Step 1: Calculate a weighted decision matrix and get the positive and negative ideal solutions ; Negative ideal solution .
Step 2: Computed Euclidean distance. The Euclidean distance from the value of the failure mode to the positive and negative ideal solution is and :
Step 3: Calculate grey relational degree. On the basis of the weighted matrix of risk assessment, grey correlation coefficient of the positive ideal solution is ., usually :
The grey correlation coefficient matrix between the evaluation value of the failure mode and the positive ideal solution is as follows:
The gray correlation degree between the evaluation value of the I failure mode and the positive ideal solution is as follows:
Similarly, the correlation values and of the evaluated value of the failure mode and the negative ideal solution can be calculated.
Step 4: The dimensions of Euclidean distance and grey correlation degree are normalized:
Step 5: Integrated Euclidean distance and grey relational degree:
where , Reflects the degree of preference of decision makers, And .
Step 6: Calculate relative closeness:
4. Case analysis
A road network project includes 15 individual projects such as road construction and transformation and industrial park construction and transformation. The total investment of the project is 290,794,630 yuan, among which the construction and installation cost is 103,585 million yuan. The construction period is 21 months. The project is carried out in the form of whole-process engineering consulting consortium, which is composed of three enterprises: A, B and C. Enterprise A is the project management unit and the guidance unit of the consortium, which is responsible for the overall management of the project, Unit B is responsible for the survey and design, and unit C is responsible for the cost consultation.
4.1. Based on WBS and RBS identification process engineering consulting risk factors
According to the above WBS-RBS analysis theory and the actual situation of the project, experts were invited to construct the coupling matrix, and the final list of risk factors identified was shown in Table 2.
4.2. Binary semantics and rough sets were used to evaluate each risk
Step 1: Three experts were invited to evaluate the identified 16 risk factors using a 7-granularity semantic set from the three dimensions of occurrence degree O, severity S, and difficulty detection degree D.
Step 2: Quantitative evaluation semantics.
Score and evaluate the level of experts. According to Eq. (5), the weight of each expert is 0.45, 0.33, 0.22, Based on binary semantics and rough sets, the fuzzy evaluation matrix is calculated by weighted expert weights, as shown in Table 3.
Table 2List of risk factors in the whole process engineering consultation consortium
Coding | Name of risk | Coding | Name of risk | Coding | Name of risk |
Social risk | Construction safety risk | Termination risk | |||
Natural risk | Cost risk | Benefit distribution risk | |||
Economic risk | Quality risk | Communication and coordination risk | |||
Member selection risk | Schedule risk |
Table 3Fuzzy evaluation matrix
2.250 | 3.774 | 2.028 | |
2.187 | 4.767 | 2.137 | |
2.884 | 3.752 | 3.057 | |
3.292 | 2.616 | 3.696 | |
2.657 | 4.236 | 3.105 | |
3.113 | 3.817 | 3.719 | |
3.504 | 3.076 | 4.281 | |
4.317 | 3.454 | 4.252 | |
3.028 | 4.606 | 4.428 | |
3.682 | 3.369 | 4.028 | |
4.448 | 3.995 | 3.509 |
4.3. Based on the fuzzy DEMATEL hesitation to modify risk importance index
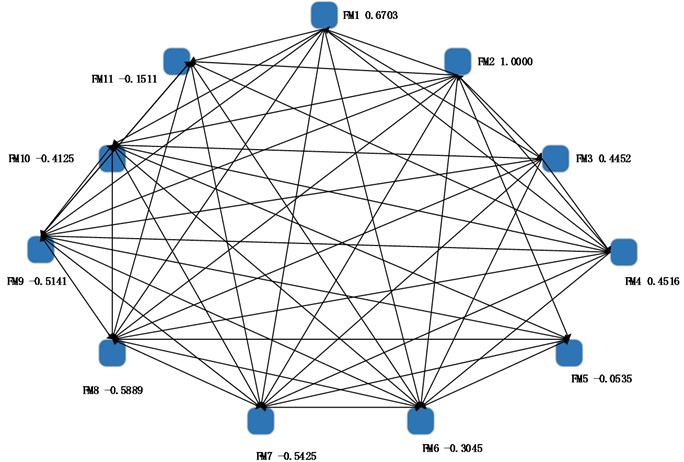
Experts were invited to evaluate the correlation of each risk factor. According to the formula in 3.2, MATLAB was used to calculate the correlation of each risk factor and the upper and lower limit net impact, as shown in Fig. 4.
Fig. 4Risk correlation analysis in whole process engineering consulting joint
4.4. The weight of risk assessment factors was determined based on the combination of G1-improved CRITIC
Step 1: G1 method was used to determine the subjective weight.
Invited three experts to sort and determine how important risk evaluation factors , According to Eq. (9) and (10), the subjective weight of each risk assessment factor is (0.405, 0.363, 0.232).
Step 2: The improved CRITIC method is used to solve the objective weight of risk assessment factors.
Five experts were invited to evaluate the risk evaluation factors: risk occurrence probability O, risk damage degree S, and risk difficulty identification degree D, according to the Eq. (11) on the score normalization, according to the mentioned in 3.3.2 steps, using MATLAB to calculate the objective weight to risk evaluation factors are .
Step 3: Determine the combined weights.
According to the Eq. (15) and the G1 method and improve the CRITIC for the subjective and objective weights, subjective and objective weight calculated by using LINGO of the optimal solution is 0.517, 0.483, The final combined weight of risk assessment factors is .
4.5. Based on the GRA - TOPSIS to sort the risk factors
Step 1: After the risk severity is corrected, the weight of the evaluation risk factor is weighted to obtain the weighted standard evaluation matrix, and the positive and negative ideals are determined as: , .
Step 2: According to the Eqs. (16)-(23), the progress, and risk ranking are shown in Table 4.
Table 4Proximity ranking table based on GRA-TOPSIS
Risk | Degree of proximity | The sorting | Risk | Degree of proximity | The sorting | Risk | Degree of proximity | The sorting |
0.4064 | 11 | 0.4528 | 9 | 0.5394 | 2 | |||
0.5109 | 4 | 0.4678 | 7 | 0.4916 | 5 | |||
0.4691 | 6 | 0.4673 | 8 | 0.5854 | 1 | |||
0.4507 | 10 | 0.5390 | 3 |
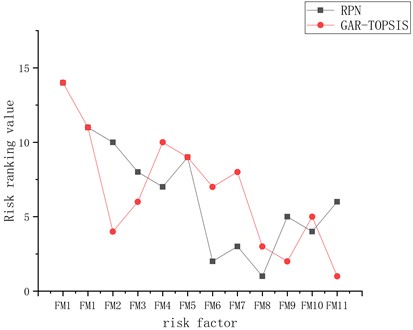
Step 3: Comparative analysis of risk factors sequencing between traditional FMEA and GRA-TOPSIS-FMEA.
Based on the evaluation data in Table 7, the upper and lower limits were averaged to obtain the importance of real evaluation matrix without DEMTEL modification, and the traditional RPN was used to calculate the risk ranking A. GRA-TOPSIS-FMEA risk factor ranking B, the ranking results are shown in Fig. 5.
According to the GRA-TOPSIS-FMEA risk factor ranking results, the key risk factors in the whole process of the project consulting association are communication and coordination risk, termination risk, and schedule risk.
According to the comparative analysis between the TOPSIS-FMEA risk ranking in the improved interval and the traditional RPN method, it can be seen that the communication and coordination risk and termination risk rank higher in the GRA-TOPSIS-FMEA risk ranking, which is consistent with the actual project. Therefore, the improved algorithm is superior to the traditional FMEA algorithm in the risk assessment of the whole process of engineering consulting consortium. It can fully reflect the influence of various subjective and objective factors in the evaluation process and avoid sorting errors.
Fig. 5Risk assessment results for different algorithms
5. Conclusions
1) Binary semantics and rough sets are used to deal with evaluation semantics, which solves the problem that evaluation granularity is inconsistent and difficult to quantify, ensures the objectivity and fuzziness of evaluation information, and reduces the distortion of information. The G1 method and the improved CRITIC method are used to weight the combination of risk assessment factors, and the combination proportion is determined based on the minimum distance difference, which ensures the consistency of subjective and objective weighting, fully considers the subjective and objective factors, and reduces the information loss caused by single weighting.
2) The hesitancy fuzzy DEMATEL was applied to modify the risk severity, and the correlation of risk factors was considered, which made the evaluation model more stable. In risk ranking, GRA-TOPSIS was used to solve the problem that TOPSIS method could not reflect the dynamic change of evaluation index sequence, and overcome the problem caused by ranking only by calculating RPN.
3) Through the example verification, GRA-TOPSIS-FMEA can improve the accuracy and stability of the risk ranking for the whole process of engineering consulting combined with internal risk ranking, and has certain practical value. Although this study evaluates the risk factors in the whole process of engineering consulting, the evaluation factors are not detailed enough, and the detailed analysis of various risk factors is the focus of the next step.
References
-
B. L. Zhou, “Analysis and suggestions on the development of whole process engineering consulting,” (in Chinese), Building Economy, Vol. 40, No. 1, pp. 5–8, 2019.
-
Z. Y. Zhao and Gao Lei, “Problems and countermeasures of whole-process engineering consulting,” (in Chinese), Construction Economics, Vol. 40, No. 12, pp. 5–10, 2019.
-
Y. R. Du, “Research on risk management of whole process engineering consulting project A,” Shandong University, 2021.
-
Q. Zhang, “Research on metro project risk management from the perspective of whole process engineering consulting,” Tianjin University of Technology, 2020.
-
M. Wang, J. Zou, H. L. Wang, and F. L. Zuo, “Improved AHP-CRITIC-MARCOS risk assessment method for distribution network equipment,” (in Chinese), Power System Protection and Control, Vol. 51, No. 3, pp. 164–172, 2023.
-
Y. G. He and J. Liu, “Security risk assessment of electric Internet of Things based on combinatorial Empowerment-Cloud model,” Power Grid Technology, Vol. 44, No. 11, pp. 4302–4309, 2020.
-
R. P. Chen, Z. T. Wang, H. N. Wu, Y. Liu, and F. Y. Meng, “Risk assessment of shield tunnel under buildings based on FAHP method and improved TOPSIS method based on interval number,” (in Chinese), Journal of Shanghai Jiao Tong University, Vol. 56, No. 12, pp. 1710–1719, 2022.
-
L. Wei and J. H. Chen, “Research on implementation risk assessment of “Smart Site System” based on information sensitivity and CSA-BP neural network,” (in Chinese), Journal of Engineering Management, Vol. 37, No. 1, pp. 147–152, 2019.
-
Y. T. Huang and X. B. Huang, “Optimization of BP neural network based on ANP and Sparrow search algorithm for prefabricated building schedule risk assessment,” (in Chinese), Engineering Management Journal, Vol. 36, No. 6, pp. 36–41, 2020.
-
J. X. You, W. Liu, and M. Y. Yang, “Improvement of FMEA for supplier risk assessment,” (in Chinese), Journal of Tong Ji University (Natural Science), Vol. 47, No. 1, pp. 130–135, 2019.
-
X. D. Shi, B. Y. Cheng, K. Huang, and Z. G. Yang, “Aircraft IDG risk assessment based on fuzzy TOPSIS-FMEA,” (in Chinese), Systems Engineering and Electronics, Vol. 44, No. 6, pp. 2060–2064, 2022.
-
X. L. Geng and Y. Z. Zhang, “Improved FMEA risk assessment method based on hesitation fuzzy set,” (in Chinese), Computer Integrated Manufacturing Systems, Vol. 23, No. 2, pp. 340–348, 2017.
-
H. Y. Chen, J. Y. Chu, and D. X. Ma, “Optimization model of disaster prevention shelter location,” (in Chinese), Journal of North China University of Science and Technology (Natural Science Edition), Vol. 38, No. 4, pp. 149–156, 2016.
-
Z. J. Li, J. J. Xiang, T. Sheng, and B. S. Xiao, “Effectiveness evaluation of TOPSIS radar against jamming based on G1-coefficient of variation – KL,” (in Chinese), Journal of Beijing University of Aeronautics and Astronautics, Vol. 47, No. 12, pp. 2571–2578, 2021.
About this article

This research was supported by National Science and Technology Support Program (2013BAJ10B09-2).
The datasets generated during and/or analyzed during the current study are available from the corresponding author on reasonable request.
Jinjian Du: data curation, formal analysis, investigation, methodology, project administration, software, visualization, writing-original draft preparation, writing-review and editing. Jianyu Chu: conceptualization, funding acquisition, supervision, validation.
The authors declare that they have no conflict of interest.
