Abstract
Laser surfacing repair technology for sealing welds is widely used in metal repair. Due to welding technology and usage scenarios, process defects on the metal surface are inevitable. Therefore, ultrasonic surface wave technology is used to analyze the surface defects of metal materials. Principal Component Analysis (PCA) is used to extract the main defect signals on the metal surface, and synthetic aperture focusing technology is used to reduce imaging errors. Considering the lack of PCA in imaging defects, wavelet domain hidden Markov models (WHMM) are combined to optimize the signal, thereby improving the inspection effect of metal defects. In the test results of the relationship between the propagation distance of 316 L steel and the defect echo signal, the echo signal gradually fitted as the propagation distance increased. When the propagation distance was greater than 10 mm, the image acquisition defect signal had significant noise points. Various techniques were used to process the original echo signals of metal surface defects. The improved PCA-WHMM algorithm had significant advantages with the SNR value of the defect image increased by 13.65 % compared to PCA-WHMM. At the same time, the surface repair effects of laser surfacing 316 L metal before and after optimization were compared. The hardness, toughness, and corrosion resistance of the optimized metal were significantly improved. The proposed technological innovation combines traditional laser surfacing repair with deep learning fault diagnosis, which not only greatly improves the efficiency of fault diagnosis, but also proves that this research can effectively avoid common focus issues of laser surfacing repair technology, providing important technical reference for the application of ultrasonic technology in metal defect detection.
1. Introduction
In the aerospace field, sealing weld laser surfacing technology is often used to repair defects corrosion problems in parts. The more precise the part, the higher the difficulty in the repair process. Laser repair technology can ensure the beauty and smoothness of the repaired part while improving the quality of the welding position. However, due to factors such as laser welding technology and materials in the actual working environment, minor defects on the repaired metal surface inevitably occur. This continues to expand over time, affecting the safe operation of industrial facilities. Surface defects in metal materials can greatly affect the use of the equipment and easily cause personal safety accidents. Hence, it is crucial to conduct a thorough safety testing procedure for equipment components during equipment utilization to guarantee the safe operation of the equipment [1]. Various inspection techniques are used to detect surface defects on metal, such as radiographic inspection, penetrant or magnetic particle inspection, eddy current inspection, thermal imaging inspection, and ultrasonic inspection. Ultrasonic inspection is highly efficient in detecting various metal surface defects due to its excellent emission directionality and high detection efficiency by collecting signals from defective areas. Therefore, this study employs ultrasonic inspection technology to analyze metal material defects [2]. To overcome the issue of defect signal error, the PCA algorithm and WHMM model are integrated into the inspection signal optimization process, improving the detection efficacy of ultrasonic technology on metal material surface defects. This research introduces a novel approach to inspecting metal surface defects, thus enhancing the detection accuracy of metal material surface defects.
2. Related work
Surface defects of metal parts have always been a significant concern in modern industrial manufacturing, and the application of ultrasonic inspection technology has propelled rapid development in this field. Both domestic and foreign experts have conducted extensive research on this issue. For instance, Chabot et al. found that additive manufacturing could be a game-changer in modern industrial manufacturing since it uses direct energy deposition for metal processing. However, practical applications lacked effective health control measures. Therefore, a comprehensive ultrasonic technology-based manufacturing process was studied for timely tracking of industrial processes, accurately identifying relevant problems and avoiding defective parts during processing [3]. Similarly, Obadimu et al. proposed an efficiency improvement scheme for existing melt wire manufacturing technologies using immersion ultrasonic testing to detect defective parts in manufacturing, including human error and machining defects. Experimental tests showed that the quality of the part inspection image depended on the probe frequency and accuracy of the processing system parameters [4]. Acevedo et al. studied the impact of residual stress on production in existing field of parts processing, concluding that ultrasonic technology could improve the manufacturing effect of parts and product production quality as an effective residual stress solution [5]. In their research, Gupta et al. investigated various industrial production processes, including casting, rolling, forging, extrusion, etc., requiring extremely high process accuracy in manufacturing technology. In large-scale manufacturing environments, non-destructive testing technology such as visual inspection, penetrant testing, magnetic particle testing, radiographic testing, and ultrasonic testing were applied to the field of parts manufacturing for quality and performance testing. Experimental tests indicated that non-destructive testing technology enables manufacturing optimization and improves the overall production quality of parts [6].
Neural network algorithm technology has seen significant developments in recent years and has been widely employed in medical, industrial manufacturing, graphic recognition, and other fields. The application of neural network technology in metal surface defect detection has greatly improved the detection effect of metal surface defects. Sun et al. found that metal performance defect detection technology has significant implications for industrial manufacturing quality control. They constructed a metal surface defect detection method using convolution models that extracted metal surface features and constructed model training samples. A large volume detection instrument was also constructed based on this technology to address the problem of metal surface volume recognition. Specific testing experiments demonstrated that this proposed technology can effectively identify metal surface defects, including scratches, indentations, pits, and other defects, with a recognition rate of over 97 %, meeting industrial production requirements [7]. Similarly, Luo et al. emphasized the importance of building a health system for parts production and used a full scene vision system to achieve the inspection of metal performance defects. They proposed a non-destructive testing network to solve the problem of extracting image feature distortion by using high-resolution instruments to extract metal surface defect feature parameters. By constructing a surface defect training dataset, the system improved the detection effect of metal performance defects. Experimental tests showed that this technology effectively identifies metal performance defects, with recognition accuracy superior to traditional detection techniques [8]. Mohammed et al. identified the limitations of existing metal crack detection technologies, such as manual maintenance, low detection efficiency, and failure to meet quality requirements. Therefore, they proposed a new technology that displays two-dimensional images of the part surface obtained through visual instruments, extracts image feature data using a depth learning model, and completes the inspection of metal crack defects through model training. Experimental inspection confirmed that this technology is cost-effective and more effective than traditional inspection technologies, meeting the requirements for parts processing and use [9].
As per the above-mentioned research, it has been observed that metal performance defects pose a significant challenge in the industrial manufacturing sector. However, recent advances in ultrasonic testing technology have proven to be highly effective in detecting such defects. In this regard, PCA-WHMM ultrasonic welding detection technology is proposed based on neural network and other advanced methodologies. The proposed technique assimilates ultrasonic detection with cutting-edge neural network technology, enabling superior accuracy in image recognition, defect category diagnosis, and other crucial aspects. Furthermore, the proposed solution exhibits numerous advantages over traditional technologies. For example, the recognition efficiency of defects is faster, the recognition of different types of defects is more accurate, and the integration with traditional recognition technologies greatly improves the comprehensive effect of defect diagnosis. This significantly enhances the application effect of ultrasonic detection technology in detecting metal surface defects. Thereby exhibiting a significantly enhanced application effect of ultrasonic testing technology in detecting metal surface defects.
3. Metal material surface defect detection model construction
3.1. Ultrasonic metal surface signal acquisition and feature analysis
In industrial manufacturing, laser surfacing repair is a widely employed technique for sealing welds in metal parts. This method employs a heat source to weld alloy materials onto the surface of the metal part, resulting in a low-cost and resource-efficient solution. However, the metal surface repaired by this technology is susceptible to various weld defects, which can pose significant safety hazards to the equipment's usage [10]. Fig. 1 demonstrates some of the typical defects encountered in surfacing repair.
Fig. 1Common problems in laser surfacing repair
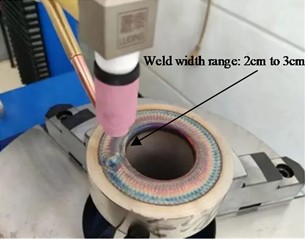
a) The problem of welding spatter
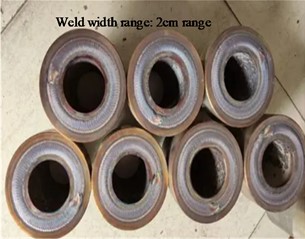
b) Poor wire drawing during surfacing
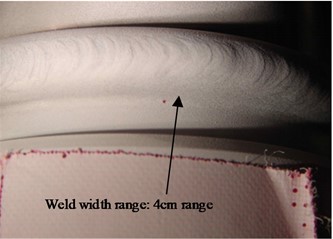
c) Equipment leakage
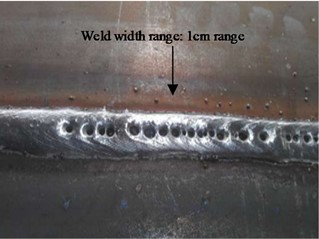
d) Undercut of surfacing
In the context of laser surfacing for metal parts repair, it is imperative to conduct a meticulous examination of the repaired surface to ensure its efficacy. One such technique that has gained prominence in recent times is ultrasonic leaky surface wave inspection technology. This non-destructive testing approach exhibits several advantages over traditional metal performance defect detection technologies, including superior recognition accuracy for metal defects and greater flexibility in application scenarios [11]. During testing, when a solid surface is inspected, the ultrasonic wave moves along the inspection finger, as depicted in Fig. 2, highlighting the propagation trajectory of the ultrasonic metal [12].
Fig. 2Schematic diagram of ultrasonic signal propagation
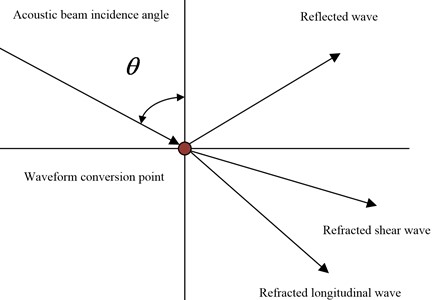
Referring to the schematic diagram in the figure depicting ultrasonic wave propagation on the metal surface, the expression of refraction is determined by Snell’s Law, as demonstrated in Eq. (1):
where, represents the detection of the internal shear wave refraction angle of the metal, represents the detection of the internal longitudinal wave refraction angle of the metal, represents the longitudinal wave velocity in the medium, represents the surface wave velocity, and represents the intermediate shear wave velocity in the medium. In ultrasonic testing, leaky surface waves refer to the appearance of a wave field on the surface of a medium by a sound source and the appearance of waves leaking outward [13]. This phenomenon can reflect the lesions problem on the surface of media objects. In actual metal surface defect detection, the focusing probe will gather ultrasound at a point, and the leakage surface wave can be divided into the leakage surface wave sound field and the focused sound field [14]. If the focal point of the metal solid surface is defined as , which is consistent with the mutual theory, then the amplitude of any point of the leaky surface wave is as shown in Eq. (2):
where, , , and represent the focal point location parameters, represents the propagation speed of sound waves in the medium, represents the focus probe area, represents the probe surface acoustic pressure amplitude, represents the Green’s function, represents the normal vector, and represents the focus size parameter. Green's function is shown in Eq. (3):
where, represents the radius of the circular arc probe, represents the second-order mass wave number, and represents a constant. Due to the use of an elliptical ultrasonic probe to detect metal surface defects, the probe will form a focal point on the second dielectric surface and change the focus shape as the refractive angle changes [15]. Sound source integration is used for expansion and the focal point of the leaky surface wave is shown in Eq. (4):
where, represents the sound velocity of the leaky surface wave, represents the leaky surface wave Greening function, represents the acoustic velocity of the second-order medium, represents the focal area of the second-order medium surface, and represents the area -axis length, as shown in Eq. (5):
where, represents the longitudinal wave incidence angle of the probe. The collection and analysis of metal surface defect features can be achieved by scanning metal surfaces with ultrasonic instruments. The defect detection model of the ultrasonic probe is shown in Fig. 3 [16].
Fig. 3Ultrasonic metal testing model
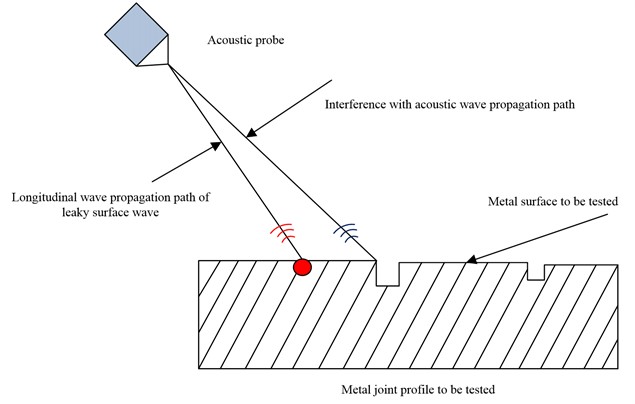
When detecting metal surface defects, the initial step involves calibrating the ultrasonic probe. To enable the probe to receive metal surface-emitted waves, it must be moved along the -axis direction by a specific distance [17]. Additionally, due to variations in the material and structure of the tested metal, ultrasonic waves may exhibit different scattering and attenuation phenomena in different media, particularly in composite materials. Considering that surfacing repair of metal surfaces also belongs to composite metals, studying the effective distance of surface leakage waves and the characteristics of acoustic wave attenuation can facilitate the inspection of metal surface defects.
4. Synthetic aperture-focused imaging model construction based on PCA-WHMM
The ultrasonic signals utilized for metal surface defect detection comprise defect signals, system noise, and structural noise, which differ somewhat from the echo signals generated by conventional ultrasonic testing methods. The relationship between defect signals and noise signals is more intertwined and can better reflect the attributes of metal surface defects. However, unlike these two signals, structural noise does not disperse entirely within the detection signal. As a result, it ultimately impacts the imaging quality of ultrasonic testing in specialized environments such as near-field testing [18]. To enhance the effectiveness of ultrasound technology, a PCA-WHMM signal noise reduction model has been developed by combining principal component analysis (PCA) and wavelet domain hidden Markov models (WHMM), which improves the imaging effect of surface leakage waves [19].
In the field of signal denoising, wavelet transform is widely used in signal denoising, image compression, and other fields. However, when dealing with signal problems, wavelet is also easy to remove effective signals. Markov model can accurately describe the relationship between wavelet coefficients and improve the statistical effect of wavelet coefficients. Therefore, a WHMM model is constructed by combining the two, and its structure is shown in Fig. 4.
Fig. 4WHMM model signal denoising process
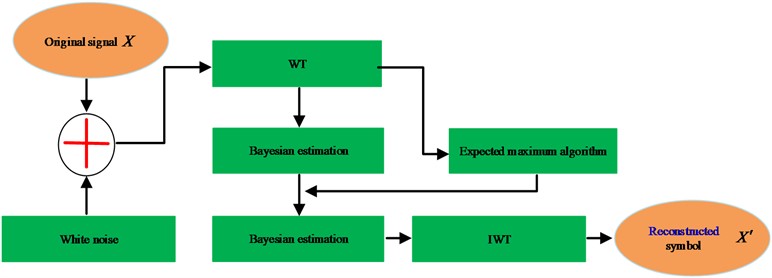
In signal denoising of the WHMM model, the observed signal can be described using wavelet coefficients as shown in Eq. (6):
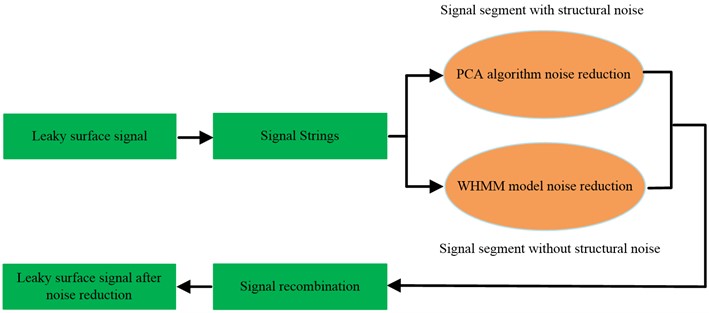
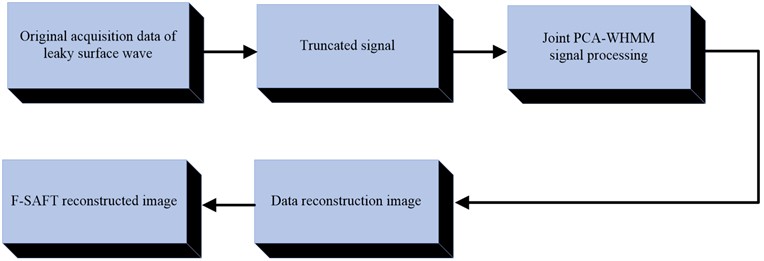
where, represents the measured signal, represents the defective signal, and represents the noise reduction signal. By calculating the inverse wavelet transform, the filtered surface wave signal can be obtained. At the same time, considering that the WHMM model cannot process modulated region signals, PCA and Frequency Domain Synthetic Aperture Focusing Imaging Technology (F-SAFT) were introduced in the study to reconstruct the image of defects. Therefore, the PCA method and WHMM model are combined to process metal surface detection signals [20]. The signal processing flow of the PCA-WHMM model is shown in Fig. 5.
According to the characteristics of acoustic wave detection, the detected metal surface signal is divided into two parts. The first part is the noise near the field area, which is . The sound source far field area is . The original pulse-echo signal is shown in Eq. (7):
The PCA method is used to process the signal, extract the defective signal, and describe the reconstructed signal as . The WHMM model is used to process the signal to enhance the signal-to-noise ratio and improve the recognition rate of the defective signal. The processed signal is described as , and the pulse-echo sampling signal after noise reduction and reconstruction is shown in Eq. (8):
Fig. 5PCA-Whmm model signal noise reduction process
In the composition of metal defect detection imaging, the F-SAFT algorithm is introduced to reduce the composition imaging defect error, while improving the signal-to-noise ratio of the defect image, thereby improving the overall quality of metal performance defect detection composition imaging. Assuming that the acoustic wave emitted by the ultrasonic probe propagates between the defect and the probe position, the detection area is defined as , and there is a change in the sound pressure at any point in the area. The medium sound propagation speed at the equivalent link is , as shown in Eq. (9):
where, represents the mean square sound velocity of both media. The time correspondence has to be satisfied for both types of imaging to calculate the imaging results. The acoustic wave equation is shown in Eq. (10):
where, represents the propagation time of the sound wave. The inverse Fourier transform of can be obtained as shown in Eq. (11):
where, represents the wave number in the axial direction, represents the two-dimensional spectrum, and represents the angular frequency, as shown in Eq. (12):
where, represents the wave number in the axis. is shown in Eq. (13):
From Eq. (12), the two-dimensional spectrum of the target can be obtained by calculating the echo signal. The signal has the maximum amplitude when The planar imaging at depth is shown in Eq. (14):
At the same time, it is also necessary to consider the impact between water and solid media and to calculate the results through different wave numbers in the use of ultrasonic technology. Assuming that the imaging in the water layer is within the thickness range of the water layer, the frequency spectrum of the layer can be obtained from Fourier transform as shown in Eq. (15):
The entire metal surface defect detection adopts ultrasonic testing technology. The ultrasonic probe equipment is placed at the position of the metal surface to be detected, the detection position of the instrument is adjusted, and the characteristic data of the metal surface to be detected are collected. The entire metal surface defect detection process is shown in Fig. 6.
The PCA method is used to process the collected structural noise area signals. For nonstructural noise areas, the WHMM model is used to complete the signal noise reduction processing, and the two-stage processing data is reconstructed. The F-SAFT algorithm is used to achieve the reconstruction of feature data, thereby completing the reconstruction of metal surface defect images, and achieving the inspection of metal surface defects.
Fig. 6F-SAFT Imaging process results of PCA-WHMM data processing
5. Metal surface defect detection experimental analysis
5.1. Metal surface defect signals feature analysis based on ultrasonic technology
MATLAB software was used to analyze the detection of surface leakage wave signals, and ultrasonic probes with a frequency of 5 MHz and 7.5 MHz were selected for testing. The focal length of the experimental probe was 76 mm. 45 type steel and 316 L type steel were selected for metal surface defect detection. Before testing, the boundary reflection method was used to adjust the experimental position of the probe. The experimental distance of the leakage surface wave was continuously increased on the surface of the metal experimental block, ultimately achieving sound pressure fitting to complete the signal testing. Fig. 7 shows the test results of the echo signal received by the probe.
Fig. 7(a) shows the echo signal detected by 45 type steel under a 5 MHz probe. According to the curve results, when the propagation distance was 50 mm, the sound pressure amplitude gradually tended to fit with the increase of the propagation distance of the leaky surface wave on the metal surface. Fig. 7(b) shows the echo signal detected by 316 L steel under a 5 MHz probe. According to the curve results, the acoustic pressure amplitude curve obtained for 316 L steel was similar to that for 45 steel with a shorter fitting distance. When the propagation distance was 40 mm, the acoustic pressure amplitude tended to fit, indicating that there were differences in the detection results of echo signals from different metal materials. Fig. 7(b) and Fig. 7(d) show the echo signals detected by a 7.45 MHz probe for 45 type steel and 316 type steel, respectively. According to the curve change results of the test, there were differences in the attenuation of the final detected echo signal for the same metal sample under different frequency probes. With a 7.45 MHz probe, 45 type steel had a region fitting at a distance of 35 mm, while 316 L type steel had a region fitting at a distance of 25 mm. When ultrasonic technology was used to detect metal surface defects, it was necessary to select a reasonable probe detection frequency based on the type of metal to ensure the detection effect of metal performance defects. To further analyze the detection results of ultrasonic technology on metal material surface curves, a continuous wavelet transform was used to analyze the echo signal, as shown in Fig. 8.
Fig. 7Ultrasonic probe signal detection results
a) Amplitude results for 45 type steel at 5 MHz
b) Amplitude results for 316L type steel at 5 MHz
c) Amplitude results for 45 type steel at 7.5 MHz
d) Amplitude results for 316L type steel at 7.5 MHz
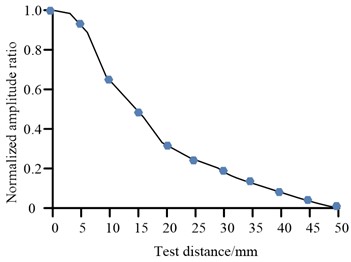
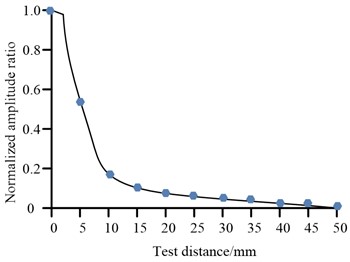
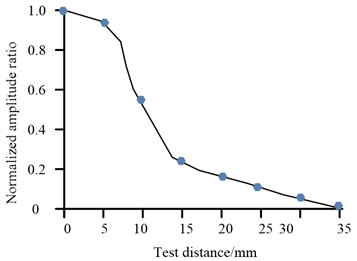
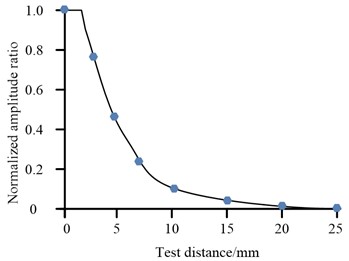
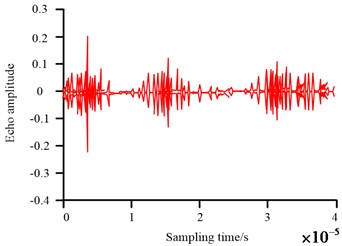
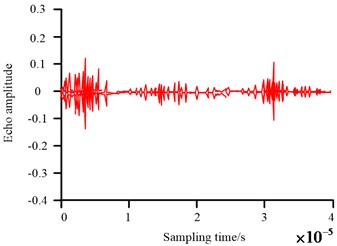
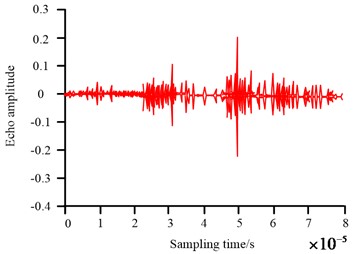
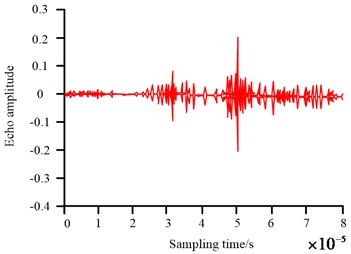
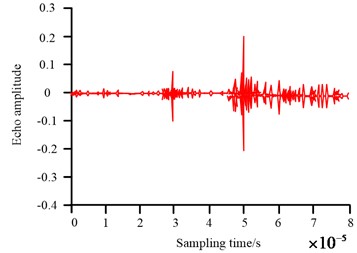
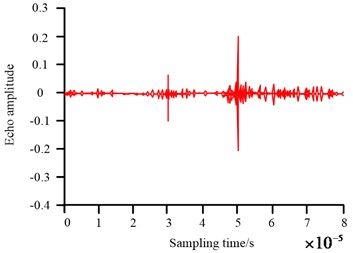
Fig. 8 shows the relationship between propagation distance and defect echo signal of 316 L steel. In the experiment, a 5 MHz probe was selected for metal surface defect detection, and the detection data results were reflected through a one-dimensional wavelet transform. Fig. 8(a) shows the defect echo signal detection results when the propagation distance is 3 mm. When the sampling points were between 2000 and 4000, the defect echo signal had significant fluctuations, and when the sampling points were 2500, the echo signal amplitude was 0.886 MHz. At the same time, signal fluctuations would attenuate with crystal reflection in the detection of metal surface defects, resulting in a significant decrease in the detection results of the echo signal. As shown in Fig. 8(b), the defect signal detection feedback result is shown when the propagation distance is 5 mm. When the propagation distance was 5 mm, it was no longer possible to clearly distinguish each peak wave component from the time domain diagram based on the curve results, and the defect spectrum was significantly lower than the structural noise spectrum. Fig. 8(c) shows the feedback results of defect signal detection when the propagation distance is 8 mm. When the propagation distance was greater than 10 mm, the structural spectrum energy was much higher than the defect spectrum energy, indicating that when the propagation distance was too large, the detection of metal surface defects would be significantly limited. Wavelet transform was used to analyze the spectrum signal, and 316 L steel was selected to detect metal surface defects. Fig. 9 shows the results of surface leakage wave attenuation imaging.
Fig. 8Echo signal experimental detection and analysis results
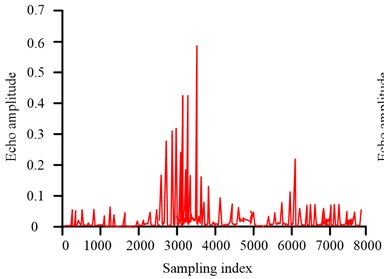
a) Propagation distance: 3 mm
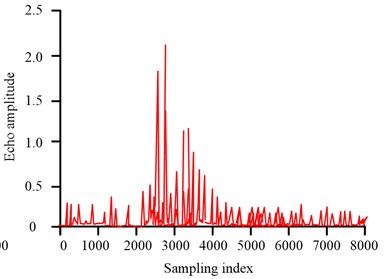
b) Propagation distance: 5 mm
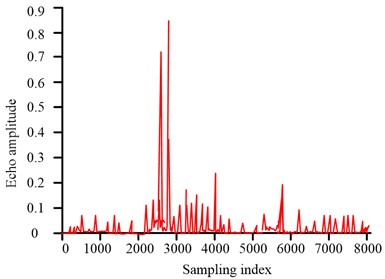
c) Propagation distance: 10 mm
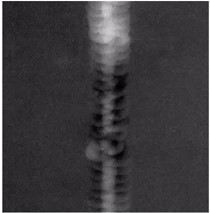
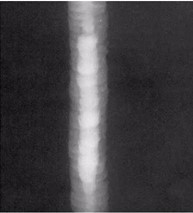
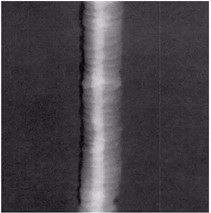
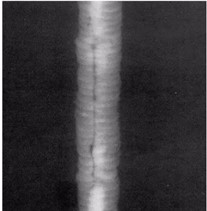
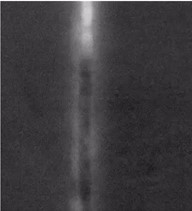
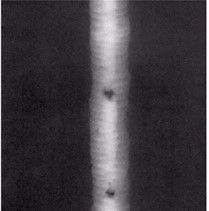
Fig. 9(a) to 9(e) show the results of metal surface defects at propagation distances of 5 mm, 10 mm, 20 mm, 30 mm, and 35 mm, respectively. From the perspective of metal surface defect detection imaging, when the propagation distance was 5 mm, the defect signal and structural noise signal can be clearly seen, and the reflected signal corresponding to the defect signal can also be clearly identified. At a propagation distance of 10 mm, structural noise signals, defect signals, and reflected signals can still be recognized in the image, but echo signal diffusion problems occurred at the bottom edge of the image, and the image quality significantly decreased. When the propagation distance was 20 mm, there was a distortion problem between the defect signal and the structural noise signal at this moment with image quality further decreased. At a propagation distance of 30 mm, due to the increasingly serious problem of echo signal diffusion, the captured defect signals were difficult to distinguish and cannot meet the requirements for metal surface defect detection. When the propagation distance was 35 mm, the echo signal can be vaguely captured in the image, but the type of leakage surface signal cannot be accurately identified.
6. Synthetic aperture-focused imaging experimental analysis based on PCA-WHMM
To improve the imaging effect of metal surface defects, the proposed PCA-WHMM synthetic aperture-focused imaging technology was used to optimize the imaging quality. The experimental testing system was Windows 10, and the processor was Intel i7. The analysis was completed under MATLAB software. In the experiment, a 10 mm position echo signal was selected for scanning and imaging analysis of metal surface defects, with a total of 600 data samples, 200 test sets, and 200 validation sets. Train the image data using the proposed model, and identify the final imaging defects based on the solder joint standards in the image. The experimental results are shown in Fig. 10.
Fig. 9Relationship results between leakage surface wave distance and attenuation curve (Scale 1/6)
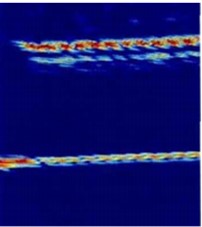
a) Echo imaging results at 5 mm position
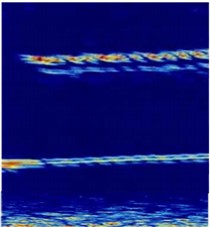
b) Echo imaging results at 10 mm position
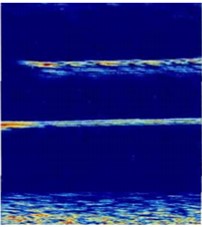
c) Echo imaging results at 20 mm position
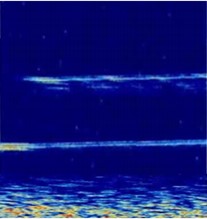
d) Echo imaging results at 30 mm position
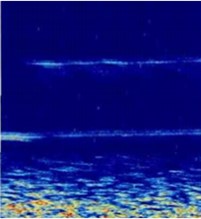
e) Echo imaging results at 35 mm position
Fig. 10Noise reduction comparison results of surface leakage wave echo signals
a) Sampling hole echo signal diagram
b) Echo signal diagram of sampling hole after PCA noise reduction
Fig. 10(a) and Fig. 10(b) show the original echo signal and the signal results after PCA noise reduction processing, respectively. According to the original image, due to the signal diffusion problem of surface leakage wave on the inspected metal surface, the metal surface defect detection imaging was affected. Therefore, PCA was used to process the 316 L metal defect signal over a relatively long distance, as shown in Fig. 10(b). From the graph results, the noise interference problem of the defect signal significantly decreased when the adoption time was 0.00003 s, but still faced the problem of signal diffusion. In response, the improved PCA-WHMM technology was used to denoise the echo signal at a long distance, as shown in Fig. 11.
Fig. 11Noise reduction results of echo signals by different algorithms
a) Original echo signal diagram
b) PCA noise reduction echo signal diagram
c) PCA-WHMM noise reduction and reconstruction echo signal diagram
d) Improve PCA-WHMM noise reduction and reconstruction echo signal diagram
In Fig. 11(a), Fig. 11(b), Fig. 11(c), and Fig. 11(d), the original echo signal, PCA noise reduction signal, PCA-WHMM noise reduction signal, and improved PCA-WHMM noise reduction signal results are shown respectively. From the noise reduction results, compared to PCA and PCA-WHMM noise reduction results, the improved PCA-WHMM noise reduction system had less noise. Especially in the improved PCA-WHMM, the wavelet algorithm was used to reconstruct the signal distortion problem, and the echo signal noise problem significantly decreased at 0 to 0.00005 seconds, and the curve was also more stable. The final echo signal noise reduction results are shown in Table 1.
Table 1Comparison results of echo signal after noise reduction processing
Defect sample number | Raw data SNR/dB | PCA-WHMM | Improve PCA-WHMM | ||
Reconstruct data SNR/dB | D-value/dB | Reconstruct data SNR/dB | D-value/dB | ||
1 | 24.65 | 25.65 | 1.00 | 26.54 | 1 |
2 | 24.65 | 25.75 | 1.01 | 26.34 | 2 |
3 | 15.35 | 16.69 | 1.34 | 16.96 | 3 |
4 | 13.54 | 14.23 | 0.69 | 15.67 | 4 |
5 | 23.24 | 23.95 | 0.71 | 25.64 | 5 |
6 | 17.35 | 17.96 | 0.61 | 18.64 | 6 |
7 | 13.54 | 14.36 | 0.82 | 15.64 | 7 |
8 | 16.24 | 17.95 | 0.71 | 18.64 | 8 |
9 | 19.64 | 21.58 | 1.94 | 21.95 | 9 |
10 | 17.36 | 18.65 | 1.29 | 19.64 | 10 |
From the data in Table 1, both PCA-WHMM and improved PCA-WHMM algorithms can achieve noise reduction processing of original image data. In comparison, the improved PCA-WHMM algorithm had better processing effects on the original image data. For example, in defect sample numbers 5, 6, and 7, the optimized reconstructed data SNR values of PCA-WHMM were 23.95 dB, 17.35 dB, and 13.54 dB, respectively. The improved PCA-WHMM was 25.64 dB, 18.64 dB, and 15.64 dB, respectively, an overall improvement of 13.65 %. Improved PC-WHMM can significantly improve the SNR value of defect images and the detection effect of metal surface defects. As shown in Fig. 12, the final laser surfacing repair metal material surface defect detection results.
From Fig. 12(a) to Fig. 12(f), common defects on metal surfaces such as root overlap, external undercut, internal undercut, root depression, weld burn through, and weld slag inclusion are detected. After improving the noise reduction processing of PCA-WHMM technology, it can accurately judge common metal surface defects and improve the recognition effect. Table 2 shows the comparison results of optimized laser surfacing repair metal surface performance parameters.
In Table 2, the original performance is 100 % based on the original performance of 316 L metal surfaces. According to the comparison results in Table 2, the parameters such as hardness, toughness, and corrosion resistance of laser surfacing before optimization were only 85.6 %, 81.7 %, and 95.6 % of the original ones and were 100.0 % after optimization. The repair effect of laser surfacing can be significantly improved using ultrasonic technology.
Fig. 12Final laser surfacing repair metal material surface defect detection results (Scale: 1/4)
a) Root overlap
b) External bite
c) Internal biting
d) Root concavity
e) Welding burnthrough
f) Welding slag inclusion
Table 2Comparison of optimized laser surfacing repair metal surface parameters
Welding performance parameters | Laser surfacing repair of metal surface / % | Optimized laser surfacing for repairing metal surfaces / % |
Thermal crack resistance | 65.6 | 95.5 |
Kang cold cracking ability | 75.7 | 96.2 |
Hardness | 85.6 | 95.7 |
Toughness performance | 81.7 | 95.6 |
Fatigue strength | 75.5 | 96.3 |
Corrosion resistance | 86.4 | 100.0 |
7. Conclusions
Metal surface defects frequently arise in metal parts repaired by surfacing welding, posing serious safety hazards to equipment production and safe use. Consequently, ultrasonic technology is employed to detect metal surface defects, aimed at enhancing the repair effect. To address surface leakage wave diffusion's impact on defect signals, PCA and WHMM models are used for echo signal noise reduction processing. Synthetic aperture focusing technology is also utilized to facilitate the reconstruction of metal surface defect signal maps, thereby improving ultrasonic technology's detection effect on metal surface defects. In detecting varying ultrasonic propagation distances, as the distance increases, image quality depreciates due to signal diffusion challenges. When the propagation distance lies between 5 mm and 10 mm, there is a clear defect signal. To optimize results for longer-range echo signals, improved PCA-WHMM technology is utilized. For the defect sample numbers 5, 6, and 7, the optimized reconstructed data SNR values of PCA-WHMM stand at 23.95 dB, 17.35 dB, and 13.54 dB, respectively, while those of improved PCA-WHMM are 25.64 dB, 18.64 dB, and 15.64 dB. Compared to PCA-WHMM, improved PCA-WHMM enhances image construction quality by 13.65 %. Finally, comparing the repair effects of laser surfacing on 316 L metal before and after optimization, the optimized metal parameters such as hardness, fatigue strength, and corrosion resistance align with original performance. Improved PCA-WHMM significantly enhances defect image SNR value and meets metal surface defect detection requirements. However, this study also has its limitations. The experiment mainly targets laser surfacing's metal surface defect issues without accounting for more complex curved metal surface challenges, which require further improvement in the future.
References
-
X. Ma et al., “Application of deep learning convolutional neural networks for internal tablet defect detection: high accuracy, throughput, and adaptability,” Journal of Pharmaceutical Sciences, Vol. 109, No. 4, pp. 1547–1557, Apr. 2020, https://doi.org/10.1016/j.xphs.2020.01.014
-
A. Kordijazi, T. Zhao, J. Zhang, K. Alrfou, and P. Rohatgi, “A review of application of machine learning in design, synthesis, and characterization of metal matrix composites: Current status and emerging applications,” JOM, Vol. 73, No. 7, pp. 2060–2074, Jul. 2021, https://doi.org/10.1007/s11837-021-04701-2
-
A. Chabot, N. Laroche, E. Carcreff, M. Rauch, and J.-Y. Hascoët, “Towards defect monitoring for metallic additive manufacturing components using phased array ultrasonic testing,” Journal of Intelligent Manufacturing, Vol. 31, No. 5, pp. 1191–1201, Jun. 2020, https://doi.org/10.1007/s10845-019-01505-9
-
S. O. Obadimu, J. Mclaughlin, and K. I. Kourousis, “Immersion ultrasonic testing of artificially induced defects in fused filament fabricated steel 316L,” 3D Printing and Additive Manufacturing, Vol. 10, No. 1, pp. 34–39, Feb. 2023, https://doi.org/10.1089/3dp.2021.0095
-
R. Acevedo, P. Sedlak, R. Kolman, and M. Fredel, “Residual stress analysis of additive manufacturing of metallic parts using ultrasonic waves: State of the art review,” Journal of Materials Research and Technology, Vol. 9, No. 4, pp. 9457–9477, Jul. 2020, https://doi.org/10.1016/j.jmrt.2020.05.092
-
M. Gupta, M. A. Khan, R. Butola, and M. Ranganath, “Advances in applications of non-destructive testing (NDT): a review,” Advances in Materials and Processing Technologies, Vol. 8, No. 2, pp. 2286–2307, 2022.
-
Jia Sun, Peng Wang, Yongkang Luo, and Wanyi Li, “Surface defects detection based on adaptive multiscale image collection and convolutional neural networks,” IEEE Transactions on Instrumentation and Measurement, Vol. 68, No. 12, pp. 4787–4797, 2019.
-
C. Luo et al., “Autonomous detection of damage to multiple steel surfaces from 360° panoramas using deep neural networks,” Computer-Aided Civil and Infrastructure Engineering, Vol. 36, No. 12, pp. 1585–1599, Dec. 2021, https://doi.org/10.1111/mice.12686
-
Y. S. Mohamed, H. M. Shehata, M. Abdellatif, and T. H. Awad, “Steel crack depth estimation based on 2D images using artificial neural networks,” Alexandria Engineering Journal, Vol. 58, No. 4, pp. 1167–1174, Dec. 2019, https://doi.org/10.1016/j.aej.2019.10.001
-
J. Zhang et al., “Laser ultrasonic imaging for defect detection on metal additive manufacturing components with rough surfaces,” Applied Optics, Vol. 59, No. 33, pp. 10380–10388, Nov. 2020, https://doi.org/10.1364/ao.405284
-
H. Chen, D. Fan, J. Huang, W. Huang, G. Zhang, and L. Huang, “Finite element analysis model on ultrasonic phased array technique for material defect time of flight diffraction detection,” Science of Advanced Materials, Vol. 12, No. 5, pp. 665–675, May 2020, https://doi.org/10.1166/sam.2020.3689
-
X. Jin et al., “DM-RIS: Deep multimodel rail inspection system with improved MRF-GMM and CNN,” IEEE Transactions on Instrumentation and Measurement, Vol. 69, No. 4, pp. 1051–1065, Apr. 2020, https://doi.org/10.1109/tim.2019.2909940
-
Menghui Niu, Kechen Song, Liming Huang, Qi Wang, Yunhui Yan, and Q. Meng, “Unsupervised saliency detection of rail surface defects using stereoscopic images,” IEEE Transactions on Industrial Informatics, Vol. 17, No. 3, pp. 2271–2281, 2021.
-
A. I. Albannai, “Review the common defects in friction stir welding,” International Journal of Scientific and Technology Research, Vol. 9, No. 11, pp. 318–329, 2020.
-
M. Garg and G. Dhiman, “Deep convolution neural network approach for defect inspection of textured surfaces,” in Journal of the Institute of Electronics and Computer, Vol. 2, No. 1, pp. 28–38, 2020, https://doi.org/10.33969/jiec.2020.21003
-
S. B. Block, R. D. Da Silva, and L. B. Dorini., “Inspection of imprint defects in stamped metal surfaces using deep learning and tracking,” IEEE Transactions on Industrial Electronics, Vol. 68, No. 5, pp. 4498–4507, 2020.
-
S. Cheon, H. Lee, C. O. Kim, and S. H. Lee., “Convolutional neural network for wafer surface defect classification and the detection of unknown defect class,” IEEE Transactions on Semiconductor Manufacturing, Vol. 32, No. 2, pp. 163–170, 2019.
-
V. Lozovan, R. Skrynkovskyy, V. Yuzevych, M. Yasinskyi, and G. Pawlowski, “Forming the toolset for development of a system to control quality of operation of underground pipelines by oil and gas enterprises with the use of neural networks,” Eastern-European Journal of Enterprise Technologies, Vol. 2, No. 5 (98), pp. 41–48, Apr. 2019, https://doi.org/10.15587/1729-4061.2019.161484
-
K. Qiu, L. Tian, and P. Wang, “An effective framework of automated visual surface defect detection for metal parts,” IEEE Sensors Journal, Vol. 21, No. 18, pp. 20412–20420, Sep. 2021, https://doi.org/10.1109/jsen.2021.3095410
-
O. Bezsonov et al., “Resource and energy saving neural network-based control approach for continuous carbon steel pickling process,” Journal of Sustainable Development of Energy, Water and Environment Systems, Vol. 7, No. 2, pp. 275–292, 2019.
Cited by
About this article

The research is supported by City Key Laboratory of Die Surface Treatment and Manufacturing Technology in Nanchang, China (2021-NCZDSY-003).
The datasets generated during and/or analyzed during the current study are available from the corresponding author on reasonable request.
Weiyong Wang contributed to conceptualization, data curation, formal analysis, investigation, methodology, project administration, writing – original draft preparation and writing – review and editing.
The authors declare that they have no conflict of interest.
