Abstract
A method of operational control of the residual resource of the tank is proposed. As a tool, the measurement of deformations of the tank wall, the assessment of plastic deformations are used. To determine the deformation, it is proposed to use a light guide installed on the wall, with the help of which the change in the curvature of the wall is measured. A device prototype containing a light guide and the necessary electronics has been developed, and the dependence of the device readings on the curvature of the light guide has been experimentally determined. The simulation of the tank in the computer simulation program was carried out in order to compare the integral of the relative deformation over the height of the tank with the readings of the device. An algorithm for processing measurements of device readings and estimating the residual life of the tank is proposed.
1. Introduction
Diagnostics of the state of structures and units is a key task in the field of transport and storage of oil. Every year, the requirements for the quality and safety of facilities are growing. At the same time, the costs of capital construction of new facilities are increasing, so it is necessary to carry out timely repairs to extend the periods of trouble-free service of facilities.
There are many ways to diagnose tanks, such as ultrasonic testing of wall thickness and condition of welds, acoustic emission testing, radiographic testing. Such studies can be carried out without decommissioning the tank and are carried out every few years. It is obvious that the receipt of diagnostic information occurs with a large delay relative to the moment of the measurement.
In contrast to the described methods, there are technologies for continuous monitoring of the technical condition of objects. Basically, they apply to operating equipment, such as pumping units or compressors [1]. Such systems are used on pumping equipment and work by analyzing the level of vibration. This method is not applicable to structures, since they do not create vibrations, so other parameters must be analyzed.
To analyze the technical condition of the tank, it is proposed to use the value of the bending of the vertical wall. Under the action of the hydrostatic load of the stored product, elastic-plastic deformations of the wall occur, which increase with the increase in service life.
The purpose of this research is to develop a method for diagnosing the technical condition of the tank through continuous monitoring of plastic deformations of the wall.
It is proposed to use a light guide as a sensitive element, which is adjacent to the surface of the tank wall and will allow assessing its deformation. The method is based on the principle of changing the intensity of the light flux passing through the fiber, depending on the degree of its deformation.
The operating principle of such sensors is described in [2], [3]. The design may differ depending on the required accuracy, but all devices determine the deformation of the object on which the light guide is installed by changing the resonant frequency, which depends on the bending angle of the light guide.
The use of sensors of this type was considered for use as early as the late 1980s. In [4], it is proposed to place fiber optic sensors inside structures during installation in order to measure internal stress and strain. The authors come to the conclusion about the possibility of using sensors for real-time analysis of stress, deformation and temperature and suggest mounting sensors in bridges, dams and other civil engineering structures. The use of fiber optic sensors has been proposed in more recent work. The advantage of the system is its high accuracy, light weight, and insensitivity to electromagnetic fields [5].
The use of fiber-optic sensors for diagnosing the condition of bridges and detecting defects is described in [6]. The author proposes to use one light guide instead of multiple sensors installed along the entire object, which leads to a more accurate determination of the degree and location of the defect. The method has been successfully tested in the laboratory and is used to diagnose the Göta drawbridge Alvbron (Götaälvbron).
The sensors under consideration have found application in the construction of space structures [7] for detecting deformations. The system collects data and analyzes the state of the object in real time. In addition, the data obtained through fiber-optic sensors make it possible to create a complete digital model of the object being diagnosed.
There are examples of using sensors based on fiber-optic cables to monitor pipeline deformations [8], [9], but this method has not found wide application.
The studies described above suggest the possibility of using fiber-optic sensors to measure the deformation of the tank wall. Further, by evaluating the value of the plastic deformation of the wall, it is possible to obtain the number of cycles before the formation of fatigue cracks and determine the remaining life of the tank.
2. Development of a prototype for determining wall deformation using a light guide
An experimental prototype was developed containing a fiber optic sensor. Let us determine how the readings obtained by the developed device depend on the radius of curvature of the LED.
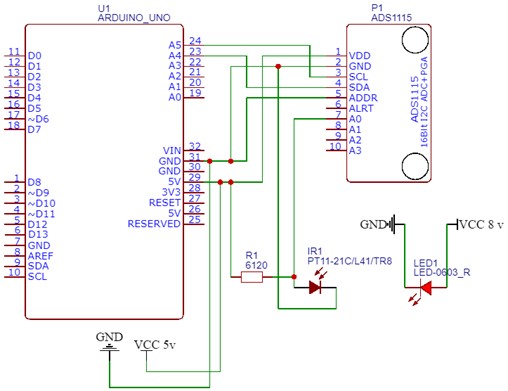
The main elements of the experimental device were a fabricated light guide based on silicone and heat-shrinkable tubes, together with a pair of photodiode and light-emitting diode (Fig. 1 and Fig. 2). The length of the LED was 840 mm. An optocoupler with an emission/reception wave peak of 940 nm was adopted as a photodiode and an LED. To obtain and process the results, an electronic board was developed (Fig. 3), which includes the Arduino microcontroller Uno, external 16-bit A/D converter with built-in ADS1115 signal amplifier.
Fig. 1Light guide scheme
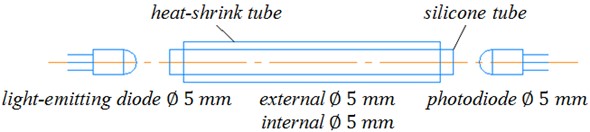
Fig. 2General view of the prototype light guide
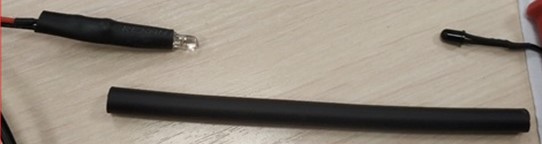
Fig. 3Electric scheme of the developed electronic board for determining the wall deformation using a light guide
3. Conducting experimental studies to determine the deformation of the tank wall according to the indications of the developed device.
The purpose of these experimental studies was to study how the readings obtained by the developed device with a light guide depend on the deformation of the light guide, in other words, on the radius of curvature.
Templates with known radius of curvature were prepared, the light guide was compared with the template, as a result of which the radius of its curvature was determined. Next, for each radius of curvature, the readings of the developed device were determined. The results of experimental measurements are presented below (Fig. 4).
Fig. 4Dependence of the readings of the experimental setup on the curvature of the light guide
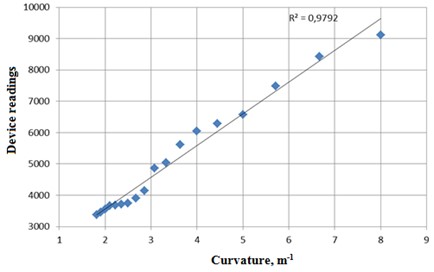
Based on the processing of the results of experimental data, it was found that the readings obtained by the developed device are described with high accuracy by the following linear dependence (with the coefficient of determination equals 0,9792):
where are readings of the device; is the curvature of the fiber (i.e., the reciprocal of the bend radius), in m-1.
The fundamental conclusion that we draw from the obtained results is that the readings of the sensor from the light guide depend linearly on the curvature. We note that the sensor readings actually reflect the resistance of the LED. This means that the sensor readings for the sum of the fiber segments obey the additivity law. Thus, based on the analysis of the dependence obtained, it can be concluded that if the deformation of the LED is complex (that is, different from bending along a simple arc), then the sensor readings will actually correspond to the sum of the curvature along the length of the LED:
In this case, is the readings of the device; is the height of the tank; is curvature of the tank wall depending on the vertical coordinate; is the value of the corresponding integral; and are some coefficients.
However, the radius of curvature of the light guide or the tank wall is directly proportional to the relative deformation on the surface, therefore, it is possible to replace:
where is the integral of the relative deformation of the tank wall in height.
4. Analysis and interpretation of the readings of the developed device with an optical fiber when installed on the tank wall
Next, we consider the installation of a light guide on the tank wall. During the operation of the tank, filling the tank, the light guide will be deformed along with the wall. Thus, the key step is to compare the integral with the deformation of the tank wall.
Let us analyze what the integral is equal to for various cases of tank wall deformation at different heights of the liquid inflow tanks, including taking into account the plastic deformation of the wall.
Let us consider how the integral Eq. (4) depends on the height of liquid overflow in the tank without plastic deformation. One option is to determine the dependence empirically, for example, when conducting hydraulic tests. In the event that for some reason this is not possible, then it can be estimated analytically.
Fig. 5Scheme of loading the tank (at the level of oil inflow 12 m)
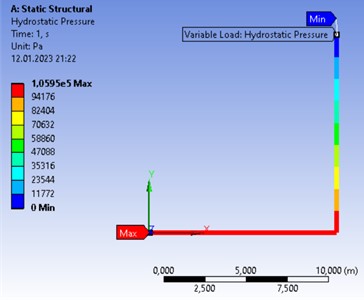
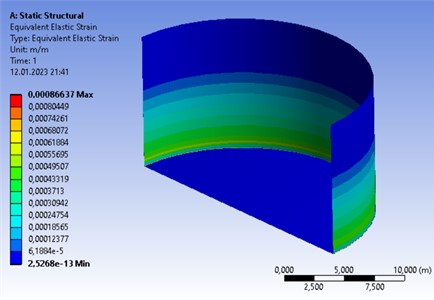
Fig. 6Relative deformations in the tank (at the oil flood level of 8 m)
In this case, we will use the Ansys program , the Mechanical module Static Structural in which we will create a flat model of the tank wall. As an example, let’s take a conditional tank RVS-5000, which stores oil with a density of 900 kg/m3. Tank height 12 m, tank diameter 22.8 m. Wall thickness 8 mm. We will produce a numerical solution until the convergence of the final result (function convergence) 1 %. The loading scheme is shown below (Fig. 5).
As an example, a diagram with relative deformations in the tank at an oil flood level of 8 m is shown (Fig. 6).
The relative deformation of the tank wall along its entire height was determined at different inflow heights. The results are presented below (Fig. 7). Deformation control was carried out at 565 points along the height. The inflow height was set in increments of 0,1 m. The peak on the graph at almost 0 m is due to high stresses in the morning seam, which connects the wall and the bottom of the tank.
Fig. 7Relative deformations along the height in the tank at different levels of oil injection
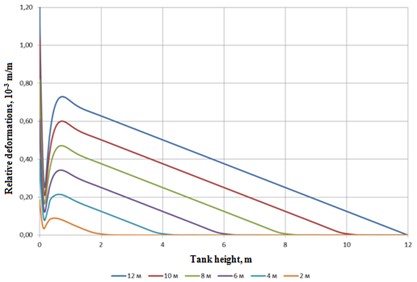
Based on this graph, it is possible to obtain the dependence of the integral of relative deformation on the height of the overflow in the tank (Fig. 8).
Fig. 8Dependence of the integral of relative deformation S from the height of the overflow in the tank
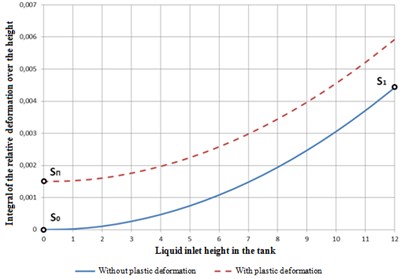
We conditionally accept that plastic deformation accumulates evenly along the height of the tank wall. Thus, over time and as the remaining resource decreases, the line on the graph will increase (the solid line turns into a dotted line).
Let and be the value of the integral of the relative strain and the readings of the device in the absence of plastic deformation (that is, at the beginning of operation) in a tank without liquid; and – the corresponding values in the absence of plastic deformation in a tank with a known liquid level; and – the corresponding values in the presence of plastic deformation in a tank without liquid. Then the following expressions are true:
From the obtained system of equations, it is possible to determine the value of relative plastic deformations:
Let note that the integral for different tanks can be different, and, as mentioned earlier, is determined either empirically or analytically.
Also, from Eq. (11), together with the fact that the instrument reading depends linearly on the curvature, the important conclusion follows that the result does not depend on the specific instrument setting, there is no need to calibrate. It is only necessary to operate with the values of the ratio of the difference in readings: ( ) and (). This makes the proposed method extremely convenient.
5. Estimation of remaining tank life
Having determined the value of relative plastic deformation, the next step is to estimate the residual life. This step can be done in a variety of ways, as there are different empirical studies and therefore different evaluation methods. For example, you can use the estimate according to the Coffin-Manson equation, which allows you to determine the number of cycles before the formation of fatigue cracks:
where is the amplitude of the total deformation per cycle; is the average cycle stress; is ultimate strength of the material under static tension; is the modulus of elasticity; is the relative narrowing of the cross-sectional area of the sample under tension; the number of cycles before the formation of fatigue cracks .
Substituting as the amplitude of the total deformation per cycle the previously obtained value Eq. (12), we determine the number of cycles before the formation of fatigue cracks .
In conjunction with the tank operation schedule, the number of filling cycles in the future can be converted into a residual resource in years.
6. Conclusions
A new method was proposed for assessing the residual life of structures using the example of an oil storage tank.
In general, the algorithm for implementing the method is as follows:
1) Installation on the wall of the tank of a device for determining the curvature of the wall based on a light guide and a pair of LED-photoresistor, as well as the necessary electronics.
2) Construction of the dependence “integral of relative deformation ” on the height of the inflow tank (Fig. 8) experimentally or analytically. Fixing device readings and .
3) During the operation of the tank, the following periodic actions are carried out:
3.1. Control of indications of the device at the moment of tank emptying.
3.2. Estimation of relative plastic deformations according to the Eq. (11).
3.3. Evaluation of the number of cycles before the formation of fatigue cracks, for example, according to the Eq. (12).
3.4. Estimation of the remaining life of the tank based on information about the plans for the operation of the tank and design cycles before the formation of fatigue cracks.
It should be noted that the proposed method does not require significant capital investments, can be easily automated, which will allow real-time assessment of the technical condition without human intervention.
References
-
A. Valeev, A. Siraeva, and Y. Chen, “Application of clustering algorithms to detect abnormal state of pumping equipment,” Liquid and Gaseous Energy Resources, Vol. 2, No. 2, pp. 73–79, Dec. 2022, https://doi.org/10.21595/lger.2022.23079
-
F. A. Egorov, A. P. Neugodnikov, and V. I. Pospelov, “Deformation meter and methods for measuring deformation (options),” (in Russian), Patent RF 2 322 649 C1, April 20, 2008.
-
V. A. Soifer et al., “Fiber optic device for measuring the transverse strain vector,” (in Russian), Patent RF 2 386 105 C1, April 10, 2010.
-
A. Mendez, T. F. Morse, and F. Mendez, “Applications of embedded optical fiber sensors in reinforced concrete buildings and structures,” in OE/FIBERS ’89, Vol. 1170, pp. 60–69, Feb. 1990, https://doi.org/10.1117/12.963084
-
K. S. C. Kuang, W. J. Cantwell, and P. J. Scully, “An evaluation of a novel plastic optical fibre sensor for axial strain and bend measurements,” Measurement Science and Technology, Vol. 13, No. 10, pp. 1523–1534, Oct. 2002, https://doi.org/10.1088/0957-0233/13/10/303
-
B. Glisic and D. Inaudi, “Development of method for in-service crack detection based on distributed fiber optic sensors,” Structural Health Monitoring, Vol. 11, No. 2, pp. 161–171, Mar. 2012, https://doi.org/10.1177/1475921711414233
-
S. Minakuchi and N. Takeda, “Recent advancement in optical fiber sensing for aerospace composite structures,” Photonic Sensors, Vol. 3, No. 4, pp. 345–354, Dec. 2013, https://doi.org/10.1007/s13320-013-0133-4
-
S. Zhang, B. Liu, and J. He, “Pipeline deformation monitoring using distributed fiber optical sensor,” Measurement, Vol. 133, pp. 208–213, Feb. 2019, https://doi.org/10.1016/j.measurement.2018.10.021
-
P. Rajeev, J. Kodikara, W. K. Chiu, and T. Kuen, “Distributed optical fibre sensors and their applications in pipeline monitoring,” Key Engineering Materials, Vol. 558, pp. 424–434, Jun. 2013, https://doi.org/10.4028/www.scientific.net/kem.558.424
About this article

The study was supported by the Russian Science Foundation Grant No. 22-29-00970, https://rscf.ru/project/22-29-00970/.
The datasets generated during and/or analyzed during the current study are available from the corresponding author on reasonable request.
The authors declare that they have no conflict of interest.
