Abstract
Gear transmission system is an important component of the shearer cutting part. The quality of its performance affects the reliable and high-efficiency operation of the whole system. Multi-rigid body and rigid-flexible coupling models were established respectively, and the dynamic analysis is carried out in the virtual simulation software Adams for the gear transmission system of the shearer cutting section. The dynamic characteristics of the gear transmission system under different load conditions were studied. The effects of constant load torque and step load torque on the dynamic characteristics of the drive system are explored. The research results show that the simulation results obtained from the rigid-flexible coupling model of the gear transmission system are closer to the actual operating conditions. It provides a visual means of dynamic analysis, which is more intuitive and convenient. The research methods and results can provide a reference for the further exploration of the electromechanical coupling dynamic characteristics of the motor-gear transmission system.
Highlights
- Multi-rigid body and rigid-flexible coupling models of gear transmission system are established
- The dynamics of the gear transmission system under different loads were simulated and analyzed in the ADAMS software
- The effects of constant load torque and step load torque on the dynamic characteristics of the drive system are explored
1. Introduction
Gear transmission system is one of the important components of the shearer cutting section, and its performance directly determines the operating efficiency of the shearer cutting section. When the cutting part of the shearer encounters uneven coal seam, gangue and coal rock mass, it will be subjected to a strong impact and large fluctuation load, which will be further transmitted to the gear transmission system, resulting in vibration and noise. When the vibration frequency of the system is not much different from the operating frequency of the gear, the resonance phenomenon will occur, causing the gear to be damaged and unable to transmit normally. Therefore, to improve the performance of each component, it is of great significance to study the response characteristics of the gear transmission system in the cutting section.
Several researches have been carried out in this field. Xun et al. studied the influence of tooth profile modification on the vibration amplitude distribution and tooth surface contact loss probability under different manufacturing tooth profile errors [1]. Geng et al. studied the dynamic characteristics of gears from the perspective of rigid-flexible coupling and nonlinearity [2, 3]. Dadon et al. proposed a general dynamic model for simulating tooth surface faults more accurately, and verified the rationality of the model by simulating and analyzing the gear transmission system with and without tooth surface faults [4]. Yi et al. found that when the gear system resonates, the spectrograms of the current and electromagnetic torque obtain recognizable characteristics [5]. Liu et al. proposed to include the calculation of all natural frequencies under different meshing conditions in the design of the transmission system, but to ignore the parameters of the meshing frequency and its frequency multiplication [6]. Jiang et al. studied the electromechanical coupling torsional vibration characteristics of the gear transmission system driven by a low-speed and high-torque permanent magnet synchronous motor, and found that the electromagnetic effect reduces the first natural frequency of the system and inhibits the vibration of the gear [7-9]. Ge et al. proposed a fuzzy control method based on active disturbance rejection and self-adaptation to suppress effectively the dynamic load of the transmission system [10]. Wang et al. analyzed the influence of damping ratio, mesh stiffness and excitation frequency of a planetary gear transmission system, and applied the research results as an analysis basis for the design of transmission system [11]. Yu et al. proposed a new calculation method for gear mesh stiffness considering the microstructure of gear teeth [12, 13]. Chen et al. established a nonlinear dynamic model of gears, and analyzed the effects of time-varying mesh stiffness, static transmission error and shaft torsional stiffness on the dynamic reliability of gears [14, 15]. Sheng et al. analyzed the effects of static excitation, dynamic, internal and external excitations on the resonance response of the transmission system[16, 17]. He et al. built a transmission system model with a combination of planetary gears and sun gears considering the influence of comprehensive deformation and dynamic meshing force [18]. Sun et al. used ADAMS, AMESim and Matlab to explore the dynamic response of a electromechanic-hydraulic system, and found that the operating height of the drum has a great influence on the maximum gear meshing force [19]. Wang et al. studied the electromechanical dynamic characteristics of the motor-gear transmission system under shock and step loads through experiments and simulations, which provided a reference for improving the dynamic performance and for monitoring the operating conditions [20]. Gao et al. proposed a method to optimize the gear transmission system, which reduced the system size and the maximum torsional acceleration of the drum and effectively reduced the manufacturing cost and failure rate [21]. By comparing the NIPPF and ANIPPF controllers, EL-Sayed et al. found that the latter more effectively suppressed the amplitude and chaotic motion of the system. The research results provided a theoretical basis for the design and construction of a shearer semi-direct drive cutting transmission system [22].
In order to better improve the performance of the gear transmission system, taking the gear transmission system of the cutting part of the shearer as the research object, the multi-rigid and rigid-flexible coupling models of the gear transmission system are established based on the Adams analysis software, and the simulation results of the multi-rigid model and the rigid-flexible coupling model are compared and analyzed. The operating conditions of the gear transmission system are simulated. Different load moments are set. The load diagram for each gear including the gear meshing force is made, and the influence law of the load torque on the transmission system is obtained.
2. Gear transmission system simulation
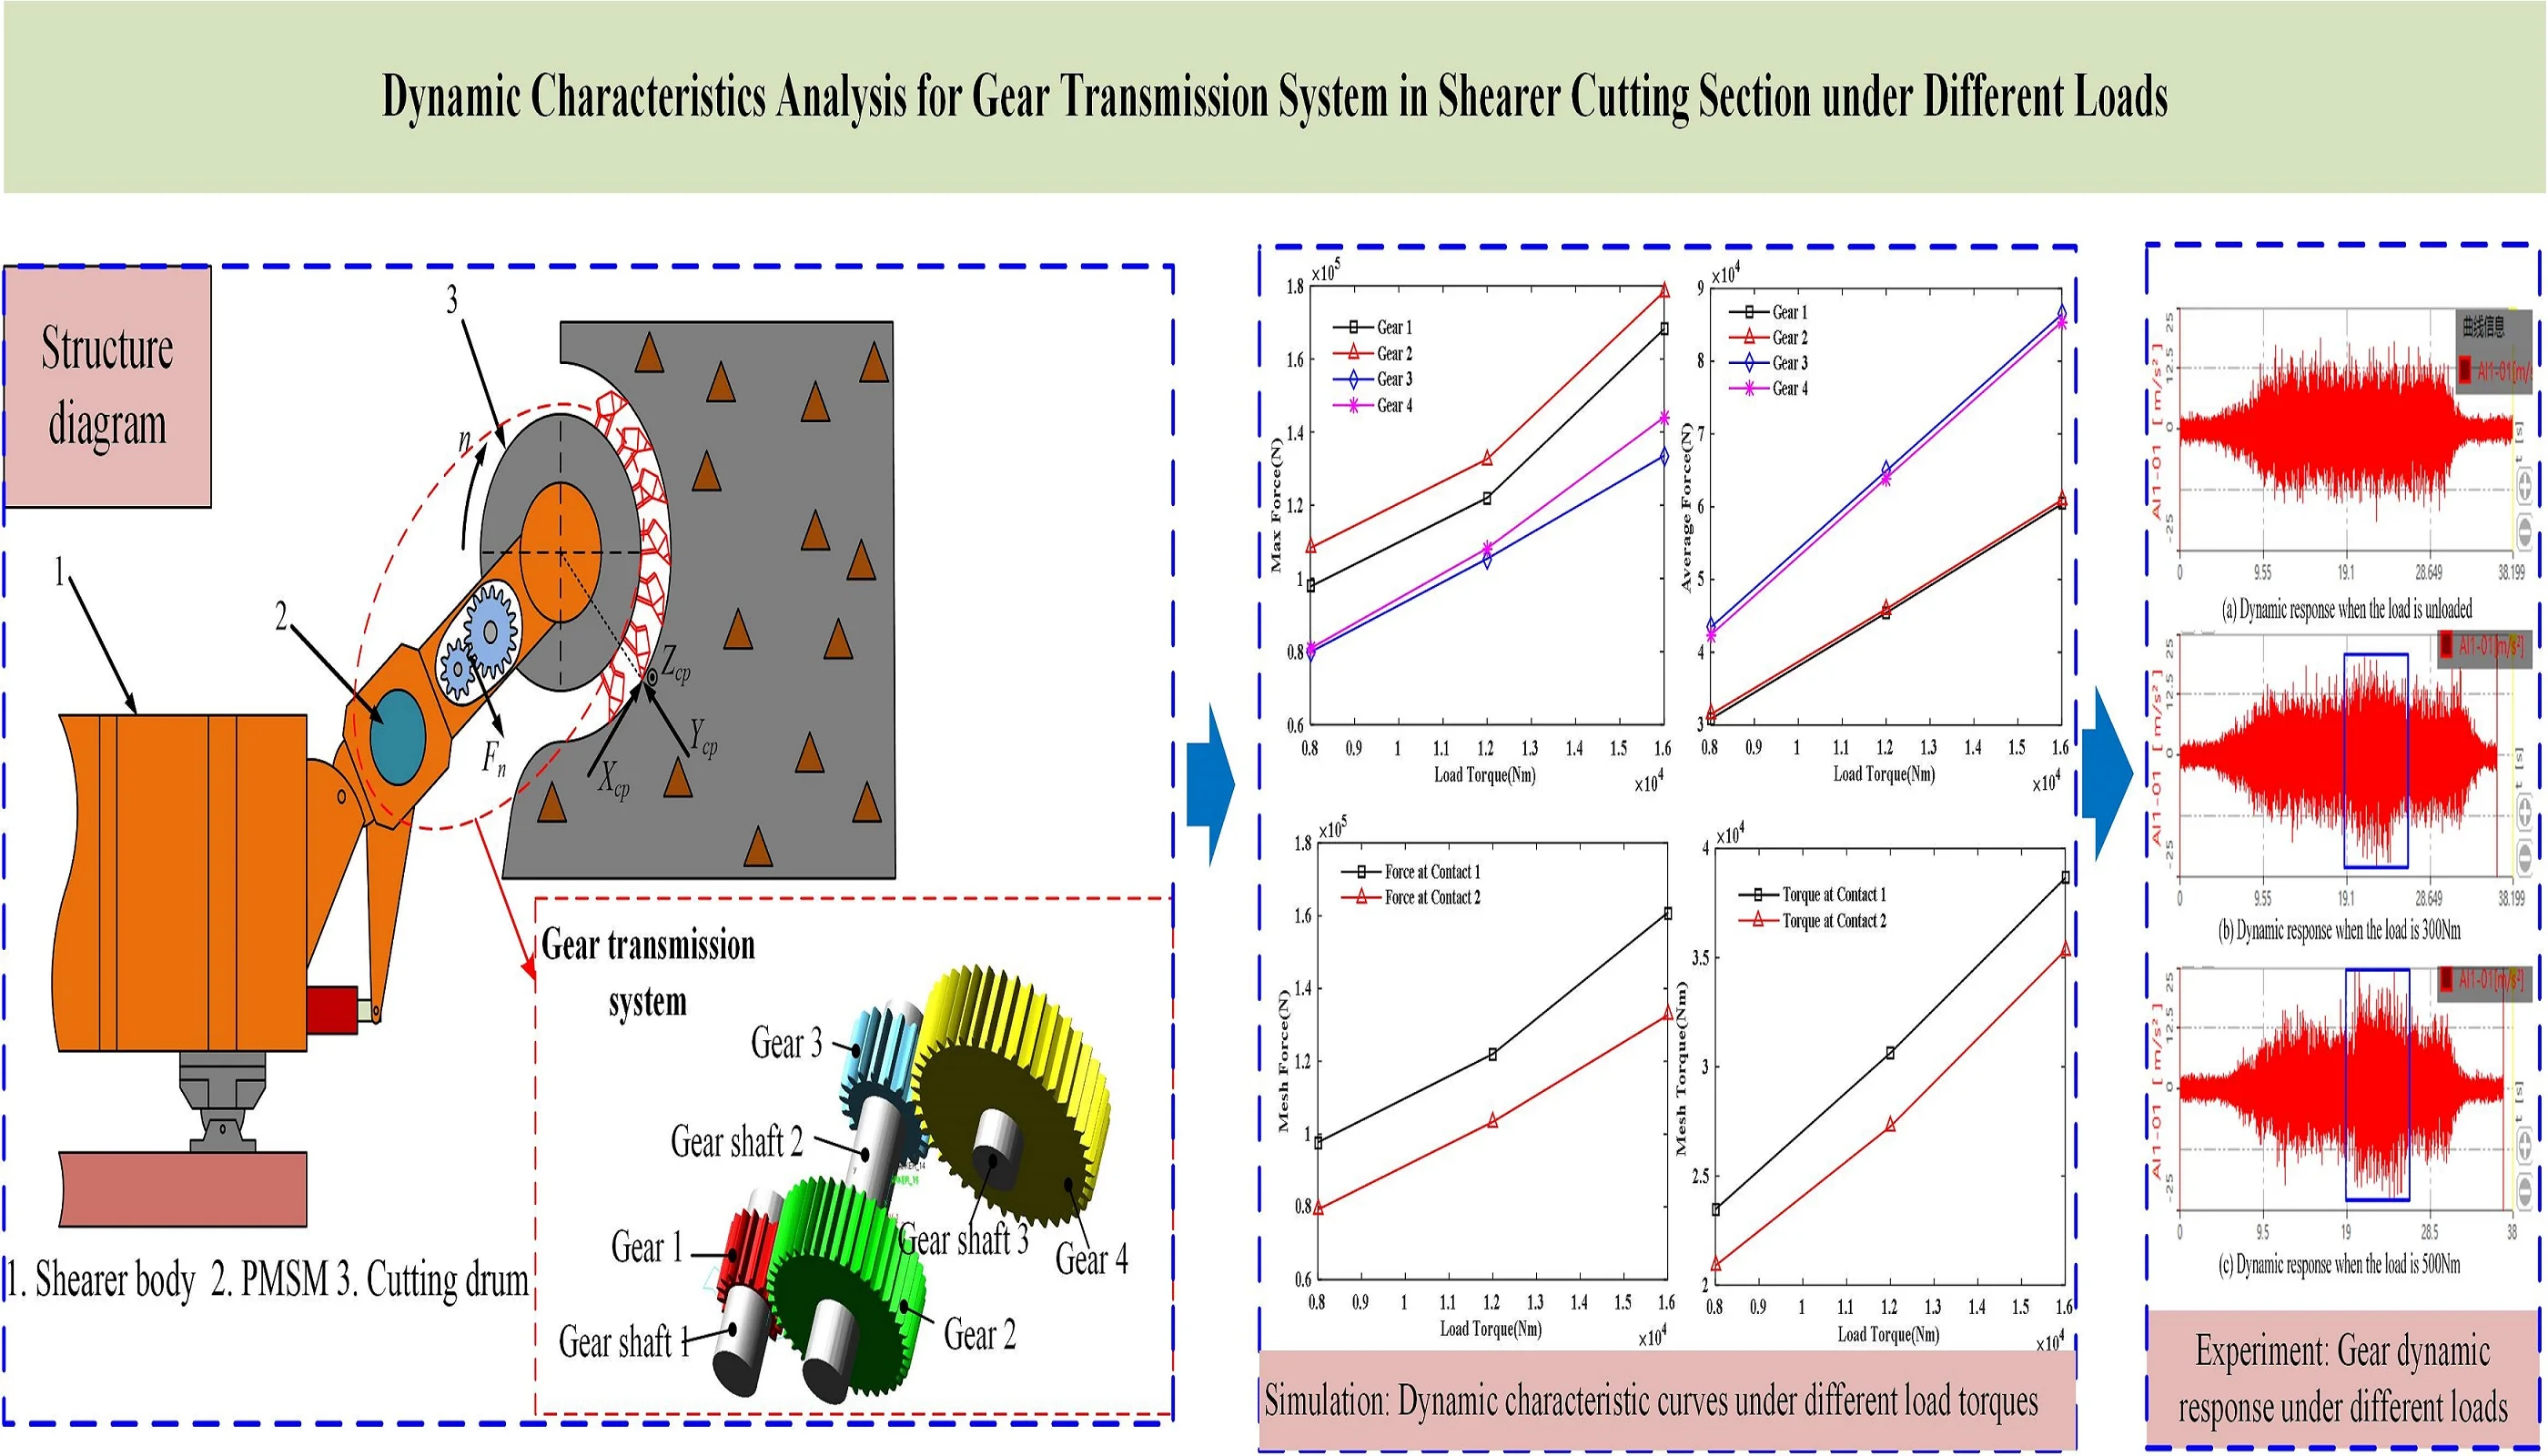
A schematic diagram of the gear transmission system in the shearer is shown in Fig. 1.
Fig. 1Schematic diagram of shearer cutting section
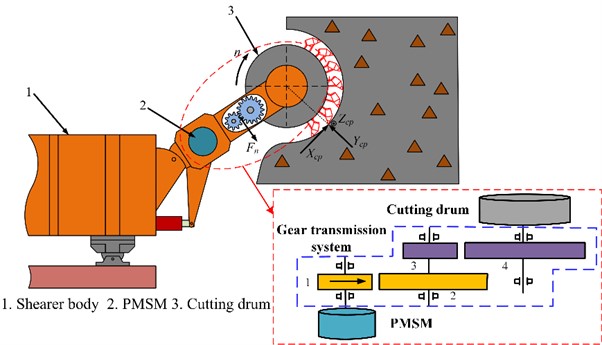
Shearer is mainly used for coal mining in coal mines. It mainly includes 2 pairs of meshing spur gears, 3 transmission shafts and 6 bearings. Since the huge end load is constantly changing during the coal mining process, it will directly affect the dynamic characteristics of the gear transmission system. Therefore, the research on the dynamic characteristics of the gear transmission system of the shearer cutting section has crucial significance for the overall performance improvement.
2.1. Multi-rigid body dynamics modeling
The main parameters of gears and gear shafts are shown in Table 1.
Table 1Gear and gear shaft parameters
Number | Modulus, (mm) | Number of teeth, | Pressure angle, (0) | Tooth width, (mm) | Gear ratio, | Shaft diameter (mm) | Shaft length (mm) |
1 | 8 | 17 | 20 | 110 | 1 | 100 | 250 |
2 | 8 | 39 | 20 | 100 | 2.294 | 100 | 550 |
3 | 10 | 19 | 20 | 110 | 2.294 | ||
4 | 10 | 40 | 20 | 100 | 4.83 | 100 | 250 |
A 3D model of the gear transmission system was established using Pro/E software. Then, the 3D solid model was saved in Parasolid (*.x-t) format, and imported into the ADAMS software to build a virtual prototype model. After the model is imported, the connection constraints and contact forces between the various components are set. Gear meshing is simulated using the Impact contact function.
The Impact function expression is as follows:
where is the distance between the two colliding objects, is the speed of the two colliding objects, is the reference distance of , is the stiffness coefficient of the contact surface, is the rigid force index, is the maximum damping coefficient of the contact surface, is the mutual penetration depth. When , the objects touch, otherwise they do not touch.
According to the Hertzian contact theory, the contact surface stiffness coefficient is expressed as follows:
where is the comprehensive radius of curvature, and is the comprehensive elastic modulus.
is expressed as follows:
where and are the radii of the gear indexing circle.
is expressed as follows:
where and are the Young’s moduli of the collision gear material, and and are the Poisson’s ratios of the collision gear material. The gear material is steel. The parameters of gear contacts 1 and 2 are calculated, as shown in Table 2.
Table 2Contact force parameters
Number | Material | (mm) | (mm) | (mm) | (N/m2) | (N/m) |
Contact force 1 | Steel | 68 | 158 | 47.357 | 1.12×10⁵ | 1.0277×10⁶ |
Contact force 2 | Steel | 95 | 200 | 64.407 | 1.12×10⁵ | 1.1985×10⁶ |
Fig. 2Multi-rigid body model
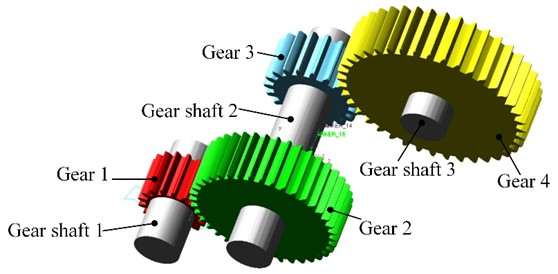
Figure 2 shows the multi-rigid body model after adding constraints and contacts. The drive rotation pair is added to shaft 1. Load torque is added to shaft 3. The applied load moment is 16000 N·m. The simulation time is set to 0.3 s, and the simulation step size is set to 2000.
Fig. 3Time history curve of transmission shaft speed
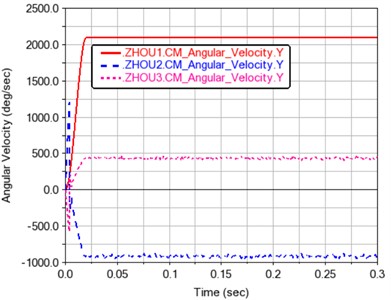
According to Fig. 3, from the direction perspective, the direction of axis 1 is positive, the one of axis 2 is negative, and finally the one of axis 3 is positive. It shows that the rotation speed of the drive shaft conforms to the law of gear transmission. From the numerical point of view, the average speed of axis 1 is 2100 d/s. The average speed of axis 2 is –915.4153 d/s, and the average speed of axis 3 is 434.8455 d/s. So, the calculation formula of transmission ratio can be expressed as follows:
where is the transmission ratio, is the speed of the input shaft, and is the speed of the output shaft. According to the average speed of each axis, 2.294, 4.829, which shows that the transmission ratio in the model is very close to the theoretical transmission ratio. It also shows that the established multi-rigid body dynamic model is reliable and reasonable.
Fig. 4 shows the total meshing force of the gears. It can be seen that after the transmission is stabilized, the meshing force of the gears makes them mesh and disengage regularly with the rotation of the gears. The main reason is that the second pair of gears is closer to the end load. The impact is even greater. It shows a variation law that fluctuates around the mean value.
Fig. 4Time history curve of meshing force
a) Contact 1 total meshing force
b) Contact 2 total meshing force
2.2. Rigid-flexible coupling dynamics simulation
Due to that the small deformations will occur when the gears mesh, because the gear is a flexible body, and this deformation will further cause the force and load changes of the gear during the gear meshing process. Based on the ADAMS/Viewflex module, the rigid body of the gear is converted into a flexible body. After the gear becomes flexible, it is necessary to delete the rigid contact and change it into the flexible contact. The unit sizes of gear 1, gear 2, gear 3, and gear 4 are uniformly set to 10 mm. After the ADAMS flexibility processed, the unit numbers of gear 1, gear 2, gear 3, and gear 4 are 2638, 9928, 4386, and 13594 respectively.
Consistent with the multi-rigid body model, the load moment is set to 16000 N·m. The simulation time is 0.3 s, and the simulation step is 2000. The simulation results are shown in Fig. 5.
Fig. 5Time history curve of transmission shaft speed
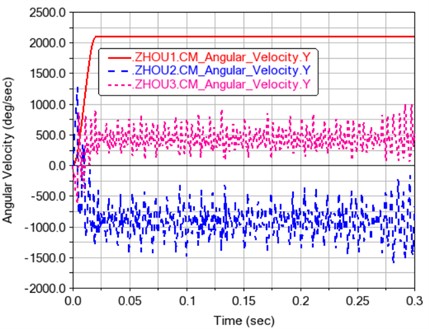
According to Fig. 5, from the direction perspective, the direction of axis 1 is positive, the direction of axis 2 is negative, and the direction of axis 3 is positive, which indicates that the rotation speed of the transmission shaft conforms to the law of gear transmission. From the numerical point of view, the average speed of axis 1 is 2100 d/s. The average speed of axis 2 is –918.2197 d/s, and the average speed of axis 3 is 435.1158 d/s. According to the average speed of each axis, 2.287, 4.826, which shows that the transmission ratio in the model is very close to the theoretical transmission ratio.
Table 3Theoretical speed and actual speed table of each drive shaft
Number | Theoretical speed, d/s | Multiple rigid body average speed, d/s | Rigid-flexible coupling average speed, d/s |
Gear shaft 1 | 2100 | 2100 | 2100 |
Gear shaft 2 | –915.4316 | -915.4153 | –918.2197 |
Gear shaft 3 | 434.7826 | 434.8455 | 435.1158 |
Table 3 shows the theoretical speed and actual average speed of the drive shaft before and after the flexible body of the gear. It can be seen from the table that the average rotational speed of each driven shaft increased after the gear became flexible. Comparing Fig. 5 and Fig. 3, it can be found that the rotational speed of each transmission shaft fluctuates more after the gear became flexible, and the calculated actual value of the transmission ratio is also larger than the theoretical value. This is because in the actual transmission process, the gears have non-ideal meshing due to problems such as deformation and impact, which makes the difference between the instantaneous transmission ratio and the theoretical transmission ratio.
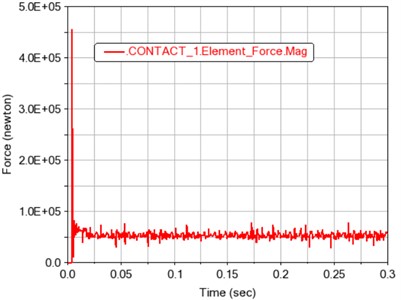
Fig. 6Contact 1 gear total meshing force
a) Time curve of total meshing force
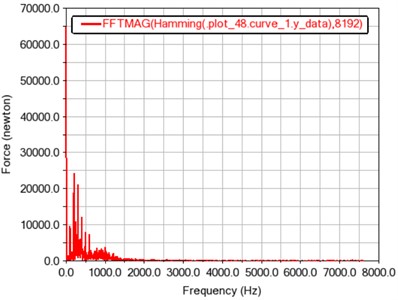
b) Frequency curve of total meshing force
From the time history curve of gear meshing force depicted in Fig. 6(a), it can be concluded that the gear meshing force of contact 1 fluctuates around its average value of 64782.8524 N. The fluctuation period and the fluctuation range are generally presented as a stable value, which is also in line with the periodic meshing motion law of the gear teeth. As it can be seen from the spectrogram depicted in Fig. 6(b), the peak points are located at frequencies of around 99, 198, 297, and 396 Hz, and the maximum amplitude occurs at around 198 Hz.
The meshing frequency equation is as follows:
where is the meshing frequency, is the number of gear teeth, and (r/min) is the rotational speed.
According to the Eq. (6), the theoretical meshing frequency is calculated as 99.17. The frequencies shown in Fig. 6(b) are multiples of the theoretical meshing frequency.
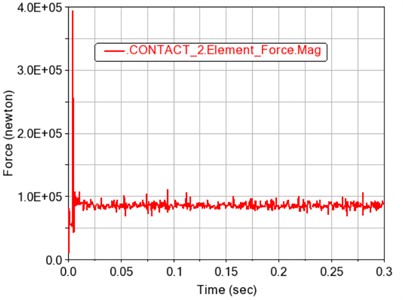
The meshing force of the contact 2 gears fluctuates up and down around its average value of 90719.7409 N, and the fluctuation period and fluctuation range are roughly a stable value, which is also in line with the periodic meshing motion of the gear teeth.
Fig. 7Contact 2 gear total meshing force
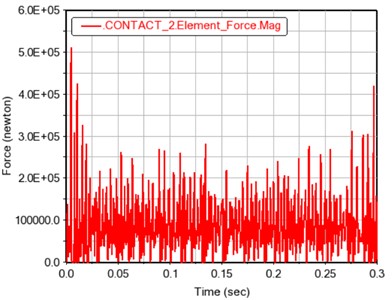
a) Time curve of total meshing force
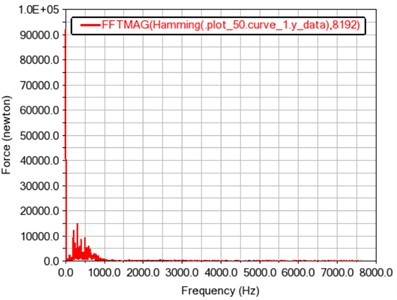
b) Frequency curve of total meshing force
From Fig. 7(b), it is found that the peak points also occur at frequencies of around 99, 198, 297, and 396 Hz, and the maximum amplitude occurs at around 297 Hz. In summary, the rigid-flexible coupling model can also provide a reference for a further research on the dynamic characteristics of gears.
3. Dynamic simulation under different loads
Due to the existence of uneven coal seam, gangue and coal rock mass, the load applied at the cutting section during coal mining works fluctuates, so the dynamic characteristics of the transmission system shall be studied in depth. As a result, different load moments of 8000 N·m, 12000 N·m, 16000 N·m and step load moments are set. The input shaft speed is set to 350 rpm, and a drive function is added to the rotating pair of axis 1. Table 4 shows the maximum load of each gear under different load moments. Table 5 shows the average load of each gear under different load moments. Table 6 shows the meshing force and moment at the contact point of different load moments.
Table 4Maximum load of each gear under different load moments
Load torque (N·m) | Gear 1 (N) | Gear 2 (N) | Gear 3 (N) | Gear 4 (N) |
8000 | 97776.4477 | 108330 | 79867.1716 | 80852.4061 |
12000 | 122050 | 132650 | 105400 | 108240 |
16000 | 168180 | 178400 | 133530 | 144040 |
Table 5Average value of load on each gear under different load torques
Load torque (N·m) | Gear 1 (N) | Gear 2 (N) | Gear 3 (N) | Gear 4 (N) |
8000 | 30814.924 | 31450.3714 | 43407.5067 | 42357.9812 |
12000 | 45414.3505 | 45933.7998 | 64916.1955 | 63913.2362 |
16000 | 60362.7299 | 60909.1292 | 86419.2894 | 85404.6557 |
Table 6Meshing force and moment at contact point under different load torques
Load torque (N·m) | Contact 1 meshing force (N) | Contact 2 meshing force (N) | Contact 1 maximum torque (N·m) | Contact 2 maximum torque (N·m) |
8000 | 97726.884 | 79257.6426 | 23473.7647 | 20890.5247 |
12000 | 122010 | 103340 | 30634.3987 | 27265.1693 |
16000 | 160830 | 132670 | 38650.8595 | 35335.5673 |
According to Table 4, Table 5, and Table 6, the dynamic characteristic curves of Fig. 9 under different load moments are drawn.
It can be seen from Fig. 8(a) and 8(b) that the maximum load and average load on each gear increase with the increase of the load torque. It can be seen from Fig. 8(c) and 8(d) that the maximum gear meshing force and meshing torque also increase with the increase of the load torque.
Fig. 8Dynamic characteristic curves under different load torques
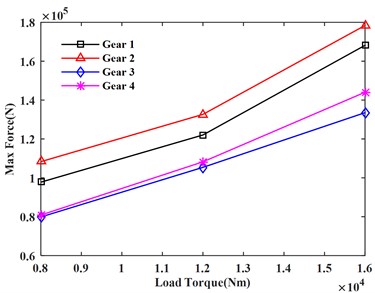
a) Maximum load
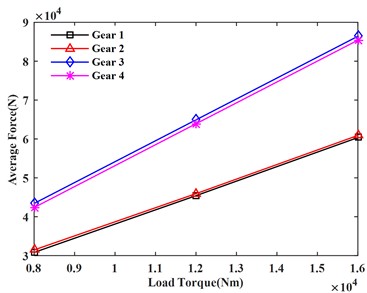
b) Average load
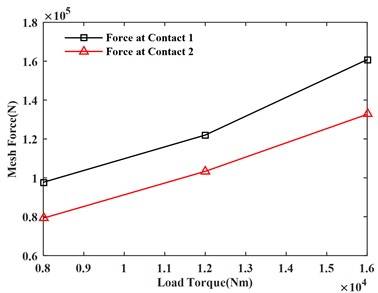
c) Meshing force
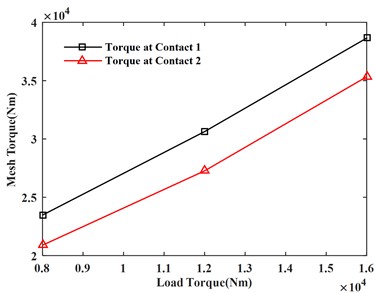
d) Meshing torque
In order to observe the fluctuations of gear dynamic characteristics under continuous load changes, step functions were integrated and applied to the load curve, as shown in Fig. 9. The simulation results are shown in Figs. 10-13.
Fig. 9Load torque
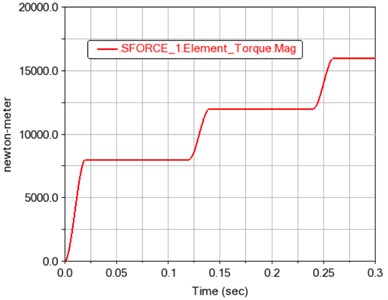
Fig. 10Variation curve of angular velocity of each gear
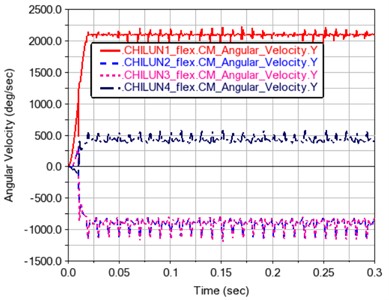
It can be seen from Fig. 10 that after the operation has been stabilized, the average speed of gear 1 becomes 2100.1936 d/s. The average speed of gear 2 is –915.3471 d/s. The average speed of gear 3 is –915.084 d/s, and the average speed of gear 4 is 435.0932 d/s.
Fig. 11 shows the force of gears 1~4. It can be seen from the force time history figure that the gear force is positively correlated with the load. It also shows that the simulation of gear transmission system created in the Adams software is simple and reliable.
Fig. 11Load time history curve of each gear
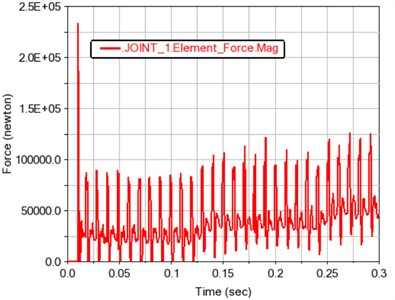
a) Gear 1
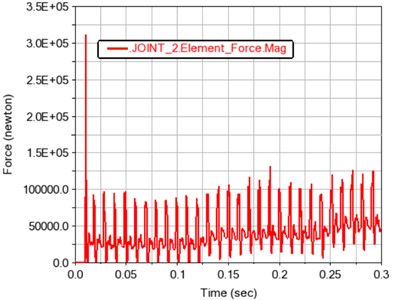
b) Gear 2
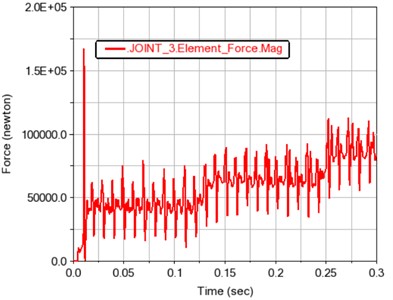
c) Gear 3
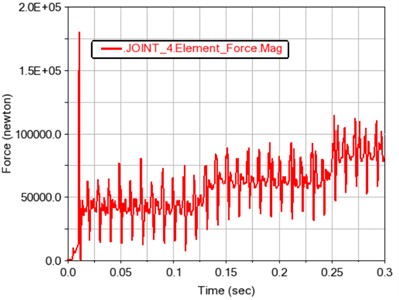
d) Gear 4
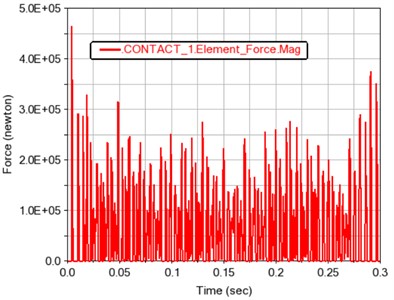
Fig. 12 and 13 show the meshing force and moment of gears 1, 2 and 3, 4 after contact, respectively. The contact force and contact torque are also positively correlated with the load fluctuation, and conform to the relationship of the transmission ratio.
Fig. 12Time history curve of gear meshing force and torque in contact 1
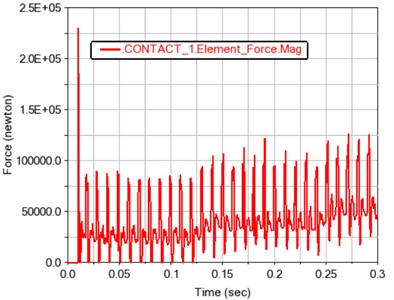
a) Gear meshing force
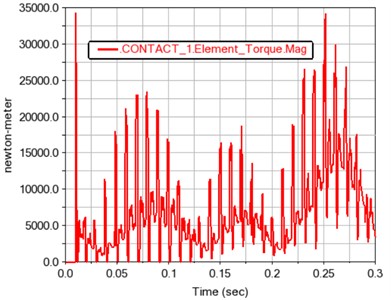
b) Gear meshing torque
Fig. 13Time history curve of gear meshing force and torque in contact 2
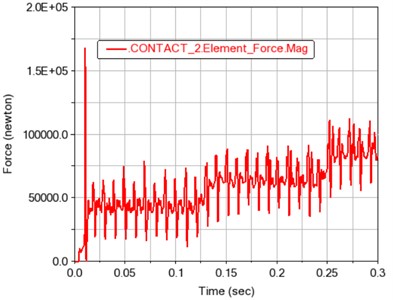
a) Gear meshing force
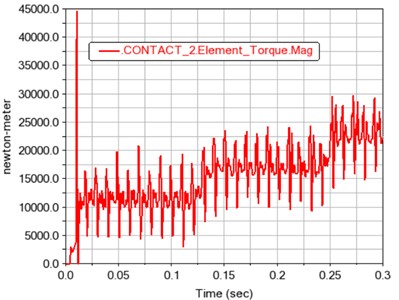
b) Gear meshing torque
Fig. 14Experimental layout of semi-direct drive gear transmission system
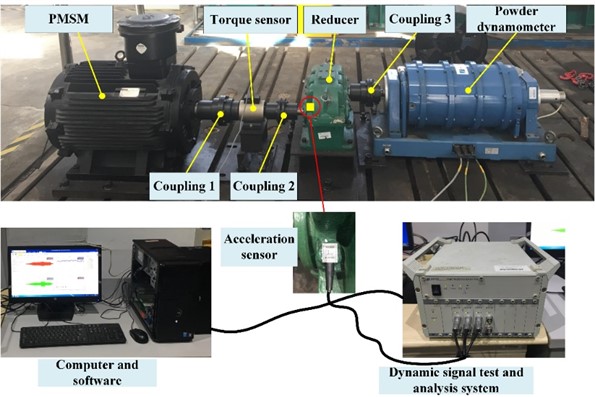
Fig. 15Relationship between speed and time of PMSM
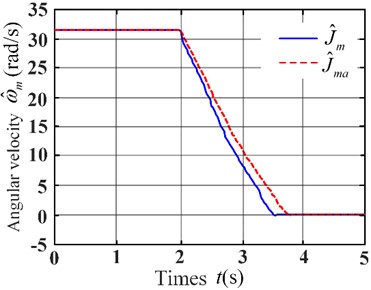
To verify the correctness of the simulation results, a small test bench for the proportional load simulation was built, as shown in Fig. 14. According to the principle of small-size parameter scaling and the deceleration method of inertia identification, the permanent magnet motor had been started to the rated speed and then stopped freely. The data of free stop of permanent magnet motor under no-load state and flywheel state with known inertia 0.262 kg·m2 were recorded. According to the obtained data, the relationship curve between speed and time was drawn, as shown in Fig. 15.
According to the relationship between speed and time in Fig. 15, data of different time stages were intercepted respectively, as shown in Table 7.
Table 7Experimental data for inertia of moment identification of PMSM
Operating condition | Initial | Middle | Final | Initial | Middle | Final | ||
No-load state | (s) | 2.10 | 2.56 | 3.10 | (s) | 2.14 | 2.60 | 3.14 |
(rad/s) | 28.3952 | 16.8303 | 5.3635 | (rad/s) | 27.4732 | 15.6373 | 4.8952 | |
Flywheel state | (s) | 2.18 | 2.74 | 3.40 | (s) | 2.22 | 2.78 | 3.44 |
(rad/s) | 28.3322 | 16.7447 | 5.1936 | (rad/s) | 27.5204 | 15.7237 | 4.7967 |
According to the data from Table 7, the load similarity coefficient of the system was calculated as 71.6. The final load torque fluctuated around 16000 N·m, so the actual final load should fluctuate around 16000N·m/71.6 = 223.46 N·m. The acceleration sensor was installed at the reducer of the small proportion load simulation test platform, and the test position of the acceleration sensor is installed at the external box close to the first stage gear, as shown in Fig. 14.
Fig. 16Gear dynamic response under different loads
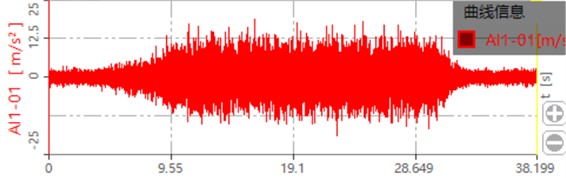
a) Dynamic response when the load is unloaded
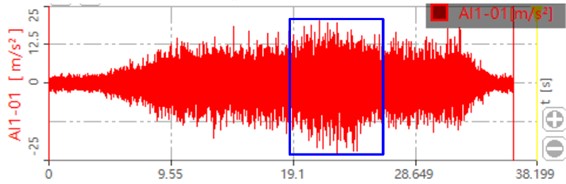
b) Dynamic response when the load is 300 Nm
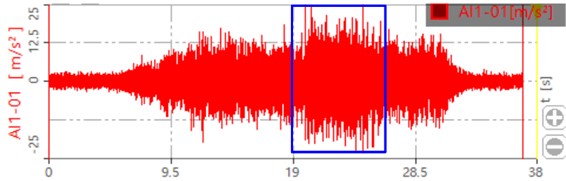
c) Dynamic response when the load is 500 Nm
The collected dynamic signal is transferred to the dynamic signal test and analysis system. The dynamic response of the gear after processing is shown in Fig. 16. The blue box in the figure shows the dynamic response of the gear after loading. It can be seen that when the load is zero, the maximum value is around 15 m/s2. When the load is 300 Nm, the maximum value is around 20 m/s2. When the load is 500 Nm, the maximum value is around 25 m/s2. This is also consistent with the loading trend of the simulation, which proves that the contact force and dynamic response of the system increase with the increase of the load.
4. Conclusions
The geometric model of the gear cutting transmission system in shearer was established by using the 3D modeling software Pro/E. The dynamics of the gear transmission system under different loads were simulated and analyzed in the ADAMS software. To be close to the actual operating condition of the gear transmission system, it was set flexibly. The research results showed that the speed fluctuation had raised after the gear had become flexible. The gear meshing force was positively related to the load. They also demonstrated that the analysis of the dynamic characteristics of the gear in the Adams software was correct and reliable. At the same time, the detailed modeling process was given in this paper, which could provide a reference for the subsequent co-simulation of the electromechanical coupling model.
References
-
C. Xun, X. Long, and H. Hua, “Effects of random tooth profile errors on the dynamic behaviors of planetary gears,” Journal of Sound and Vibration, Vol. 415, pp. 91–110, Feb. 2018, https://doi.org/10.1016/j.jsv.2017.11.022
-
Z. Geng, J. Li, K. Xiao, and J. Wang, “Analysis on the vibration reduction for a new rigid-flexible gear transmission system,” Journal of Vibration and Control, Vol. 28, No. 17-18, pp. 2212–2225, Sep. 2022, https://doi.org/10.1177/10775463211013245
-
Z. Geng, K. Xiao, J. Li, and J. Wang, “Bifurcation and chaos of a spur gear transmission system with non-uniform wear,” Journal of Vibration and Acoustics, Vol. 143, No. 3, Jun. 2021, https://doi.org/10.1115/1.4048269
-
I. Dadon, N. Koren, R. Klein, and J. Bortman, “A realistic dynamic model for gear fault diagnosis,” Engineering Failure Analysis, Vol. 84, pp. 77–100, Feb. 2018, https://doi.org/10.1016/j.engfailanal.2017.10.012
-
Y. Yi, D. Qin, and C. Liu, “Investigation of electromechanical coupling vibration characteristics of an electric drive multistage gear system,” Mechanism and Machine Theory, Vol. 121, pp. 446–459, Mar. 2018, https://doi.org/10.1016/j.mechmachtheory.2017.11.011
-
C. Liu, D. Qin, and Y. Liao, “Electromechanical dynamic analysis for the cutting transmission system of the unmanned long-wall shearer under variable speed process,” Journal of Vibroengineering, Vol. 19, No. 5, pp. 3191–3206, Aug. 2017, https://doi.org/10.21595/jve.2017.17724
-
S. Jiang, W. Li, L. Sheng, J. Chen, and M. Li, “Nonlinear torsional vibration analysis and control of semidirect electromechanical coupling transmission system in shearer,” Shock and Vibration, Vol. 2019, pp. 1–12, Mar. 2019, https://doi.org/10.1155/2019/7431239
-
S. Jiang, W. Li, Y. Wang, X. Yang, and S. Xu, “Study on electromechanical coupling torsional resonance characteristics of gear system driven by PMSM: a case on shearer semi-direct drive cutting transmission system,” Nonlinear Dynamics, Vol. 104, No. 2, pp. 1205–1225, Apr. 2021, https://doi.org/10.1007/s11071-021-06364-9
-
S. Jiang, W. Li, G. Xin, L. Sheng, M. Fan, and X. Yang, “Analysis of torsional vibration characteristics and time delay feedback control of semi-direct drive cutting transmission system in shearer,” Chaos, Solitons and Fractals, Vol. 132, p. 109607, Mar. 2020, https://doi.org/10.1016/j.chaos.2020.109607
-
S. Ge, D. Qin, M. Hu, and Y. Liu, “Active torque control for gear dynamic load suppression in a drum shearer cutting transmission system under impact loads,” Journal of Vibration and Control, Vol. 24, No. 21, p. 107754631774312, Nov. 2017, https://doi.org/10.1177/1077546317743121
-
X. Wang and J. Guo, “Modeling and Simulation of nonlinear dynamic characteristics of gear drive system in shearer cutting,” in International Conference on Computer Systems, Electronics and Control (ICCSEC), 2017.
-
X. Yu, Y. Sun, H. Li, and S. Wu, “An improved meshing stiffness calculation algorithm for gear pair involving fractal contact stiffness based on dynamic contact force,” European Journal of Mechanics – A/Solids, Vol. 94, p. 104595, Jul. 2022, https://doi.org/10.1016/j.euromechsol.2022.104595
-
X. Yu, Y. Sun, and S. Wu, “Multi-stage contact model between fractal rough surfaces based on multi-scale asperity deformation,” Applied Mathematical Modelling, Vol. 109, pp. 229–250, Sep. 2022, https://doi.org/10.1016/j.apm.2022.04.029
-
J. Chen, W. Li, L. Sheng, S. Jiang, and M. Li, “Study on reliability of shearer permanent magnet semi-direct drive gear transmission system,” International Journal of Fatigue, Vol. 132, p. 105387, Mar. 2020, https://doi.org/10.1016/j.ijfatigue.2019.105387
-
J. Chen, W. Li, G. Xin, L. Sheng, S. Jiang, and M. Li, “Nonlinear dynamic characteristics analysis and chaos control of a gear transmission system in a shearer under temperature effects,” Proceedings of the Institution of Mechanical Engineers, Part C: Journal of Mechanical Engineering Science, Vol. 233, No. 16, pp. 5691–5709, Aug. 2019, https://doi.org/10.1177/0954406219854112
-
L. Sheng, W. Li, G. Ye, S. Jiang, and Y. Li, “Stability and combined vibration of gear transmission system in shearer cutting section under multi-parameter excitation,” International Journal of Dynamics and Control, Vol. 9, No. 2, pp. 392–402, Jun. 2021, https://doi.org/10.1007/s40435-020-00687-y
-
L. Sheng, W. Li, G. Ye, and K. Feng, “Nonlinear dynamic analysis of gear system in shearer cutting section under wear failure,” Proceedings of the Institution of Mechanical Engineers, Part K: Journal of Multi-body Dynamics, Vol. 236, No. 1, pp. 99–112, Mar. 2022, https://doi.org/10.1177/14644193211053540
-
J. J. He, H. T. Chen, J. F. Leng, Z. Guan, and C. X. Luo, “Research on load sharing characteristics of planetary gear system with flexible shaft structure in shearer cutting unit,” in 15th Symposium on Piezoelectrcity, Acoustic Waves and Device Applications (SPAWDA), 2021.
-
L. Q. Sun, K. Jiang, Q. L. Zeng, K. D. Gao, and X. D. Zhang, “Influence of drum cutting height on shearer cutting unit vibration by co-simulation method,” International Journal of Simulation Modelling, Vol. 20, No. 1, pp. 111–122, 2021.
-
Y. Wang, C. Liu, and Y. Liao, “Electromechanical dynamic simulation and experiment for multi-stage gear transmission system with planetary gears,” Cluster Computing, Vol. 22, No. S2, pp. 3031–3041, Mar. 2019, https://doi.org/10.1007/s10586-018-1835-6
-
H. Gao and J. Chen, “Intelligent optimization design of the cutting unit’s transmission system of a shearer based on robustness,” International Journal of Pattern Recognition and Artificial Intelligence, Vol. 35, No. 9, p. 2158009, Jul. 2021, https://doi.org/10.1142/s021800142158009x
-
A. T. El-Sayed and H. S. Bauomy, “NIPPF versus ANIPPF controller outcomes on semi-direct drive cutting transmission system in a shearer,” Chaos, Solitons and Fractals, Vol. 156, p. 111778, Mar. 2022, https://doi.org/10.1016/j.chaos.2021.111778
About this article

This work is supported by the National Natural Science Foundation of China (Grant No. 52375250, 52005232), Natural Science Foundation of Jiangsu Province, China (Grant No. BK20201024). Basic Research Program of Xuzhou City (Grant No. KC22023), The University Synergy Innovation Program of Anhui Province (Grant No. GXXT-2022-019).
The datasets generated during and/or analyzed during the current study are available from the corresponding author on reasonable request.
Lianhcao Sheng and Jujinyong contributed significantly to analysis and manuscript preparation. Guo Ye and Xing Deng performed the data analyses and wrote the manuscript. Lianchao Sheng completed the final review.
The authors declare that they have no conflict of interest.
