Abstract
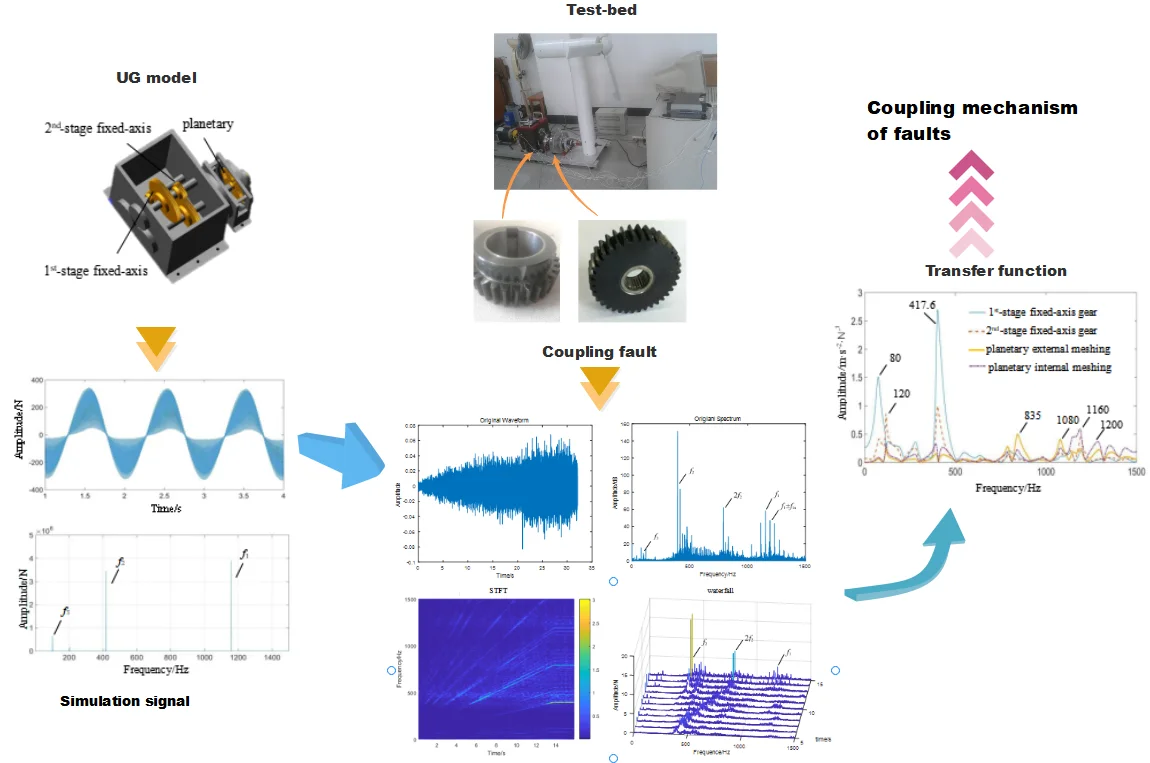
In multi-stage gear transmission system, the accident is often not caused by a single fault, but by coupling fault. The decoupling and identification of coupling faults has always been a hot topic. Through the analysis of frequency characteristics and transmission characteristics, this paper explored the correlation of coupling faults in multistage gear transmission system, and analyzed the coupling mechanism of faults. According to the fault test-bed, a 3D model was built to analyze the contact force and vibration characteristics of gears at all stages. STFT and waterfall diagram were used to analyze the coupling correlation characteristics of experimental signals under two single faults and coupling faults: fixed-axis gear crack and planetary gear wear. The contact force transfer function of all stages of gears to the box was built by using the system identification theory. The source of the fault characteristic frequency component was found through the transfer function, and the transmission characteristic of the fault was revealed. It can be seen from the results that the fault coupling is not the superposition of frequency characteristics. In the coupled signal, the frequency characteristic with the largest amplitude increase is not the fault gear itself, but the intermediate gear connected with them and affected by them. This phenomenon is often misled and misjudged in the analysis.
Highlights
- STFT and waterfall diagram were used to analyze the coupling correlation characteristics of experimental signals under two single faults and coupling faults: fixed-axis gear crack and planetary gear wear.
- The contact force transfer function of all stages of gears to the box was built by using the system identification theory. The source of the fault characteristic frequency component was found through the transfer function, and the transmission characteristic of the fault was revealed.
- Through the analysis of frequency characteristics and transmission characteristics, this paper explored the correlation of coupling faults in multistage gear transmission system, and analyzed the coupling mechanism of faults.
1. Introduction
In the multistage gear transmission system, all the performance indexes are decreased due to the long-term operation of the machinery. When there is a slight gear fault, it is often difficult to detect. Especially when many minor faults are mixed together, the running state becomes complex. There are often high peaks which are difficult to track the source accurately, which brings trouble to the decoupling and identification of coupling faults. The characteristics of multiple faults are rarely simple superposition, which may lead to new associated relations. If we can excavate these related relationships, we will solve the problem.
Research on fault coupling comes more from the coupling between faults in rotor system, such as misalignment, rubbing, unbalance, loose [1-5] and so on. The common method is to study the dynamic behavior, frequency response and dynamic change path of the system from the perspective of fault mechanism, based on time domain diagram, wavelet basis function, axis orbit diagram, bifurcation diagram, Poincaré section diagram, nonlinear output frequency response function (NOFRF) and other methods.
With the progress of machine learning technology, fault identification is developing towards intelligence. The mapping relationship between fault feature and fault mode is established by constructing intelligent diagnosis model. The early machine learning methods include artificial neural network [6], support vector machine, empirical mode decomposition [7], decision tree and so on. After more than 10 years, it has developed into the current deep learning technology, such as stacked supervised auto-encoder [8-9], deep convolutional network [10], deep belief network [11], deep residual network [12], genetic algorithm [13] and so on. For complex signals, new algorithms such as shift invariant dictionary learning [14] and particle swarm optimization (PSO) neural network [15] are proposed. Deep learning can adaptively extract or fuse fault features and realize the information exchange between feature extraction and health status recognition. However, this method is very efficient for single channel. The effect of decoupling for multi-channel coupling fault is not good.
In order to decouple the hybrid model, some scholars have proposed some algorithms. For example, Edmond Q. Wu [16] uses the covariance of log likelihood of complete data to accurately identify the similar components and dynamics of the developed hybrid model. Zhang Z. H. [17] proposed an Tri-Partition State Alphabet-Based sequence pattern (Tri-SASP), which can deeply understand the sequence pattern through time correlation analysis. Hongjiang Cui [18] proposed a fault diagnosis method of rolling parts of rolling bearing based on variational mode decomposition (VMD) and maximum correlation kurtosis deconvolution (MCKD), so as to decompose the weak fault signal of rolling parts of rolling bearing. Wu Deng [19] proposed an enhanced FAST NSGA-II based on special congestion strategy and adaptive crossover strategy, which can effectively find the global Pareto solution set and improve the distribution and convergence performance of PS.
With the help of the self-learning ability of machine learning, the data-driven intelligent diagnosis model does not need to deeply study the decline mechanism of mechanical equipment, which is favored by scholars. At present, the research based on this method has been more comprehensive and in-depth. However, due to the complexity and diversity of failure mechanisms, great individual differences, and the coupling between physical processes, the modeling of fault diagnosis method based on physical model is very difficult. It has always been a difficult point, and few scholars are willing to study it in depth. Due to the lack of basic research, the results of machine learning can not be verified, which increases the uncertainty of its prediction results. This has seriously affected the development of machine learning technology. So far, the physical model and failure mechanism of the decline process of integrated gearbox are not perfect. Aiming at this problem, this paper starts with the dynamic model, analyzes the correlation of fault vibration sources, and completes the decoupling of coupling faults from the fault mechanism. This research will provide a theoretical basis for intelligent diagnosis methods.
The research on the mechanism of coupling fault of multistage gear system mainly includes mathematical model simulation and kinematics simulation. Previously, the author team has established a mathematical model to simulate the system fault frequency characteristics varying with parameters, so as to analyze the sensitivity and correlation of fault characteristics to parameters. However, the results of this method depend too much on the mathematical model. Due to the complexity and diversity of coupling fault failure mechanisms and great individual differences, the established model is lack of universal applicability and is difficult to be extended to other systems. In order to solve this problem, the kinematics simulation model based on 3D solid model is adopted in this paper. However, the disadvantage of the kinematic model is that its results are too ideal, so it must be combined with the experimental results. The transfer path analysis (TPA) [20] is used to integrate simulation and experiment to construct the transfer function of input and output. Explore the source of each frequency component in the experimental signal under coupling fault, so as to analyze the vibration mechanism of coupling fault in the system.
In this paper, aiming at the multi-stage gear transmission system, the kinematic simulation model is used to calculate the meshing exciting force and frequency spectrum characteristics of the normal state and the coupling fault state of fixed shaft gear crack and planetary gear wear. Then the experimental signal is used to study the change of the vibration characteristics of the system during the speed-up process. The frequency characteristics related to the fault are determined by short-time Fourier transform and waterfall map. Finally, the simulation signal is combined with the experimental signal, and the transfer path method is used to mine the peak source of the transfer function to find out the fault characteristics and joint characteristics of the coupling fault.
2. Dynamic model of multistage gear transmission system
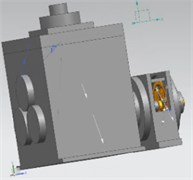
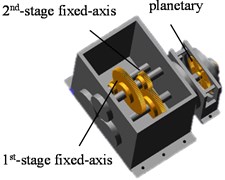
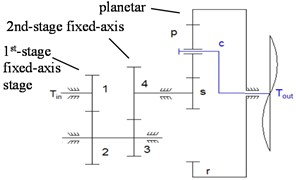
With reference to the multi-stage gear transmission system test bench (Fig. 1), a 3D model of ADAMS was established (Fig. 2). The setting of modeling parameters can be found in the author's paper [21]. In order to reflect the nonlinear characteristics of the gearbox, the model was softened [22-23]. There are two gearboxes in the system. On the left is a fixed-axis gearbox with two-stage fixed-axis gears. On the right is a planetary gearbox with one-stage planetary gear train. The drive shaft is placed on the left side of the fixed-axis gearbox. The three-stage gear defined from left to right are the 1st-stage fixed-axis gear, the 2nd-stage fixed-axis gear, planetary gear respectively. The gears in the test-bed are all involute cylindrical spur gears with pressure angle of 20°. The gear parameters in Fig. 2 are shown in Table 1.
Fig. 1Multi-stage gear transmission system test-bed
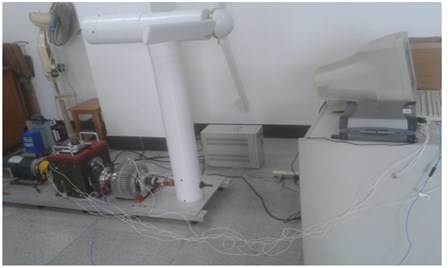
Fig. 2ADAMS model: a) gearbox, b) internal meshing gear, and c) torsional dynamic model
a)
b)
c)
Table 1Gear parameters
Gear | Number of tooth | Face width / mm | Module / mm |
1 | 29 | 30 | 1.5 |
2 | 100 | 30 | 1.5 |
3 | 36 | 30 | 1.5 |
4 | 90 | 20 | 1.5 |
s | 28 | 20 | 1.0 |
pn | 36 | 20 | 1.0 |
c | 20 | 1.0 | |
r | 100 | 20 | 1.0 |
3. Signal analysis of gear contact force
In order to study the dynamic response characteristics of the system, the ADAMS model was used to solve the gear contact force signal. Uniform drive speed of 40 Hz was applied to the drive shaft. Load torque of 300,000 N/mm was applied to the planet carrier. The characteristic frequency parameters of gears at all stages of the test-bed were calculated according to the number of gear teeth, as shown in Table 2.
Table 2Main frequency parameters
Characteristic frequency | Calculation formula | Value [Hz] |
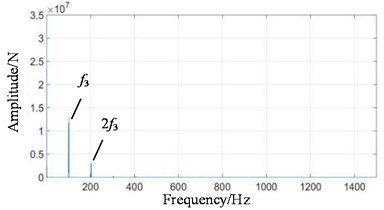
1st-stage fixed-axis gear meshing frequency | 1160 | |
2nd-stage fixed-axis gear meshing frequency | 417.6 | |
Planetary gear meshing frequency | 101.5 |
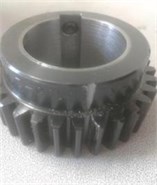
Fig. 3Cracked gear: a) actual gear, and b) simulation gear model
a)
b)
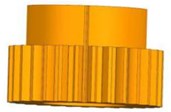
Fig. 4Wear planetary gear: a) actual gear, and b) simulation gear mode

a)
b)
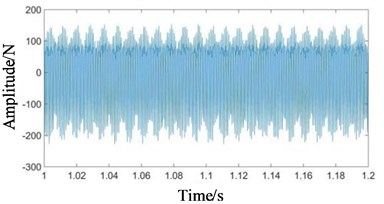
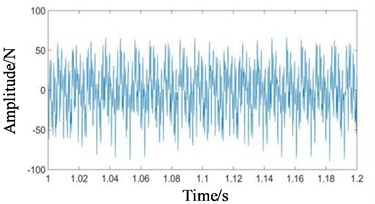
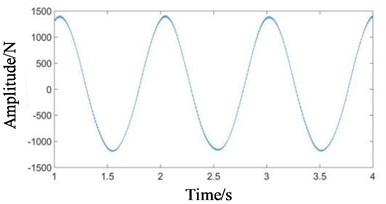
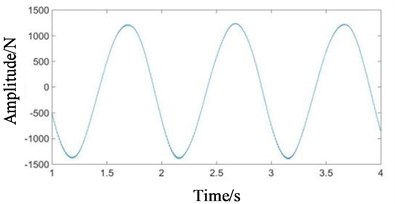
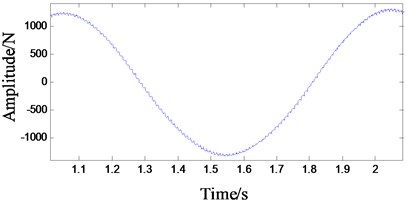
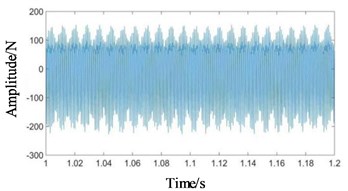
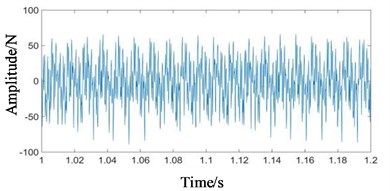
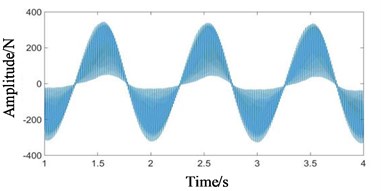
Fig. 5Time domain signals at all stages under normal state: a) 1st-stage fixed-axis, b) 2nd-stage fixed-axis, c) planetary external meshing, d) planetary internal meshing, and e) enlarged view of planetary external meshing
a)
b)
c)
d)
e)
The contact force signals under normal and coupling faults were solved, as shown in Figs. 5-6. The coupling fault is the coupling of fixed-axis crack and planetary gear wear fault. The crack occurs at the tooth root of the 1st-stage fixed-axis driving gear, and the wear fault occurs in the planetary gear. The faulty gears are shown in Fig. 3 and 4.
Fig. 6Time domain signals at all stages under coupling fault state: a) 1st-stage fixed-axis, b) 2nd-stage fixed-axis, c) planetary external meshing, and d) planetary internal meshing
a)
b)
c)
d)
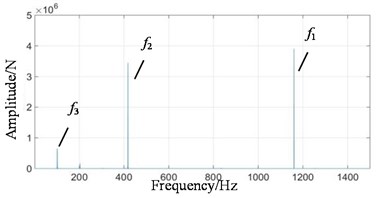
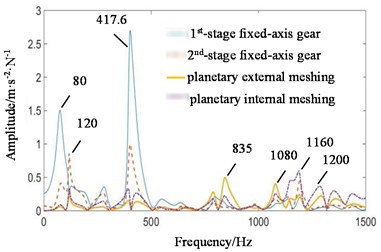
Compared with Figs. 5 and 6, it can be seen that the fixed-axis gear signals have almost no change, and the planetary gear signals change greatly. The overall amplitude of Fig. 6(c) and 6(d) decreased, while the original tiny increased sharply. Observe the frequency domain signals, as shown in Figs. 7-8.
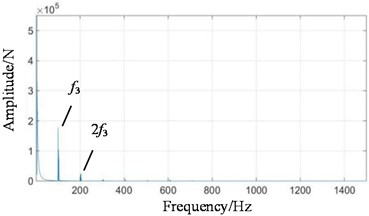
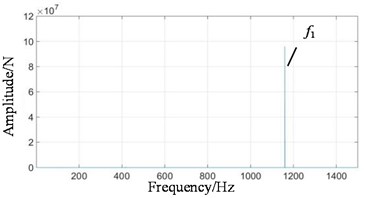
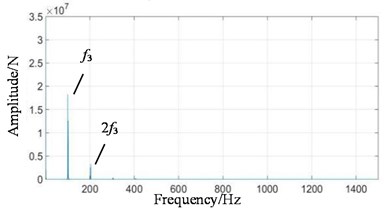
Compared with Figs. 7 and 8, the fixed-axis frequency domain also has little change, and the amplitude of and its frequency doubling increases sharply. In the author's research, it is found that when only the fixed-axis gear crack fault, the fixed-axis gear crack has little effect on the vibration response of the planetary gear. Its main feature is that the amplitude of and increases slightly, which is similar to Fig. 8(a) and 8(b), so it is not listed. When there is only planetary gear wear fault, it has minor effect on the vibration response of fixed-axis gearbox. Its fault characteristics are similar to coupling fault, which shows that and its multiplication amplitude are obvious, so it is also not listed.
Depending on the time domain and frequency domain signals, when the fixed-axis gear crack fault and the planetary gear wear fault occur simultaneously, the planetary gear wear fault feature dominates.
Fig. 7Frequency domain signals at all stages under normal state: a) 1st-stage fixed-axis, b) 2nd-stage fixed-axis, c) planetary external meshing, and d) planetary internal meshing
a)
b)
c)
d)
Fig. 8Frequency domain signals at all stages under coupling fault state: a) 1st-stage fixed-axis, b) 2nd-stage fixed-axis, c) planetary external meshing, and d) planetary internal meshing
a)
b)
c)
d)
4. Frequency domain characteristics and transfer function analysis of test signals
4.1. Frequency domain characteristics of test signals
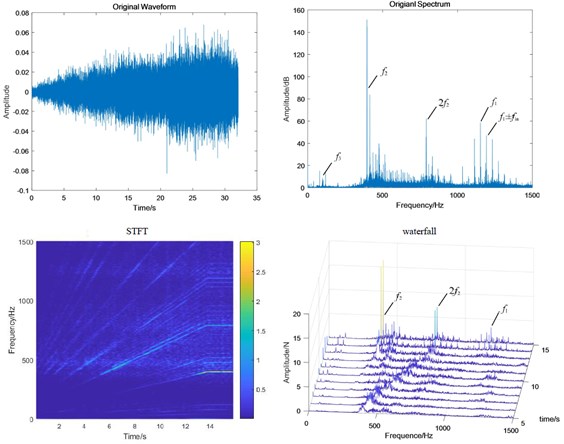
The 1st-stage fixed-axis driving gear was replaced by a tooth root crack gear. The planetary gear was replaced by a wear gear. Test the horizontal acceleration signals on the surface of the two gearboxes under normal, fixed-axis crack, planetary wear and coupling fault, as shown in Fig. 9-12. In order to investigate the change of the vibration characteristics of the system during the speed-up process, the vibration signals of the two boxes were tested from 0 to 40 Hz speed. Magnetic brake loads 10 V. In order to clearly reflect the changing process of the frequency peak value with the speed, the time domain, frequency domain (speed 40 Hz), STFT (short-time Fourier transform) and waterfall diagrams were drawn respectively.
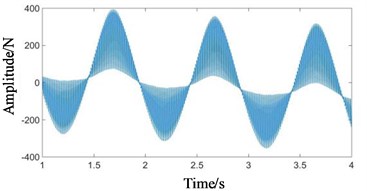
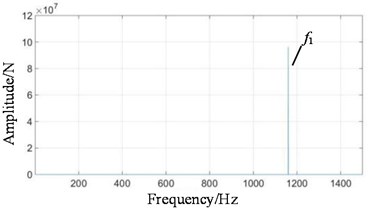
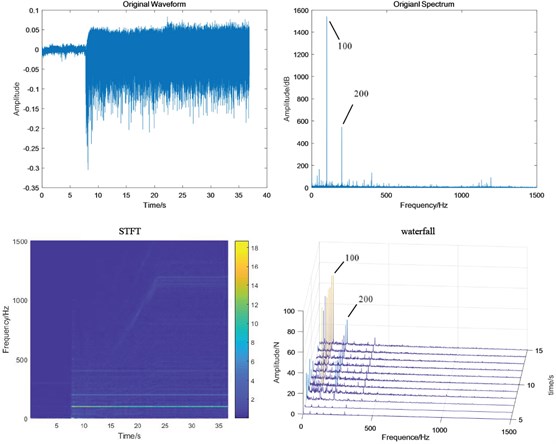
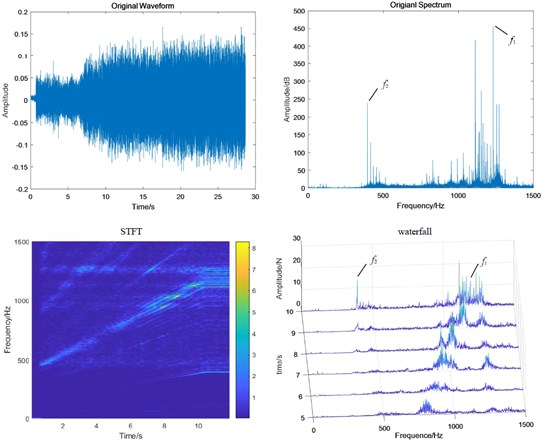
Fig. 9Test bench signals under normal condition: a) fixed-axis gearbox, and b) planetary gearbox
a)
b)
It can be viewed in Fig. 9(a) that the vibration amplitude is small under normal condition, and the power frequency 100 Hz and its frequency doubling 200 Hz are dominant, which do not change with the increase of speed. The amplitude of the principal vibration feature is small. Compared with Fig. 7, it is found that there is no 100 Hz power frequency in the simulation signal because it is too ideal. In fact, the motor vibrates violently. The fixed-axis gearbox is connected with the motor and is greatly affected by it, so that its own characteristic in the frequency spectrum is covered by the power frequency. There is a fixed-axis gearbox between the planetary gearbox and the motor. In Fig. 9(b), the energy of 100 Hz is reduced and and are highlighted.
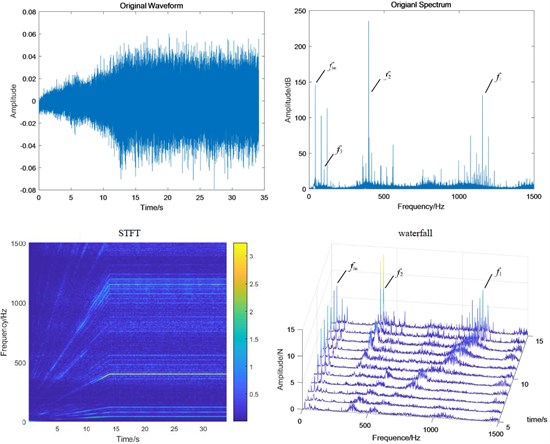
Fig. 10Test bench signal under fixed-axis crack condition: a) fixed-axis gearbox, and b) planetary gearbox
a)
b)
When the system contains fixed-axis crack fault, the fault characteristic is more obvious and the amplitude is higher. The side band has a wider band and more orders. This change also accords with the general law of fixed-axis fault characteristics. In the planetary gearbox, the amplitude of has also increased significantly, but its change is somewhat sudden. From the STFT diagram, we can see that the frequency near the frequency 500 Hz and 1250 Hz does not change with the speed, so it should be the natural frequency band of the planetary gear. Therefore, the sudden increase of near the 500 Hz may be caused by the coincidence with the natural frequency band.
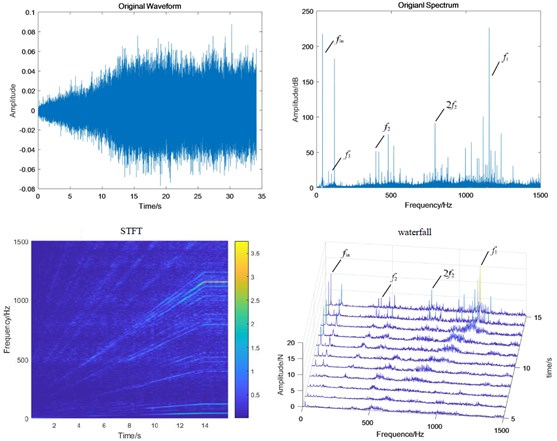
Fig. 11Test bench signal under planetary wear condition: a) fixed-axis gearbox, and b) planetary gearbox
a)
b)
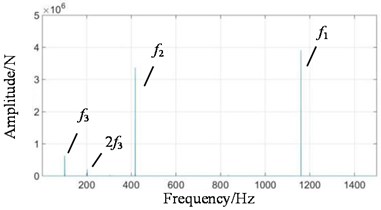
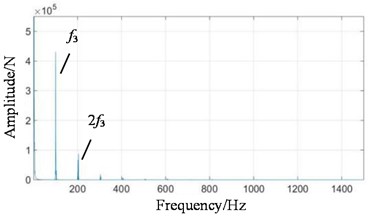
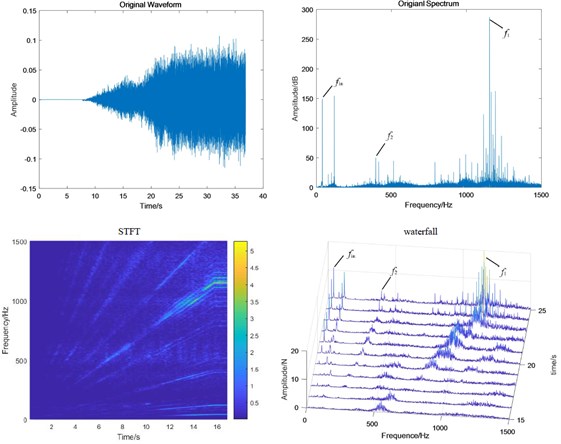
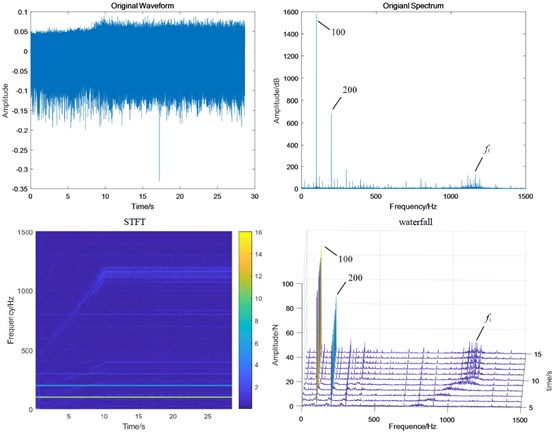
When the system contains planetary wear fault, the characteristics of fixed-axis gearbox are not so single, and its components become rich and complex. The frequency amplitude of , and are obvious, among which the amplitude of is the highest, followed by , and their modulation to form a side band. In the simulation Fig. 8, the planetary gear wear only shows growth, and the additional frequency components remain unchanged. Comparing Fig. 11(b) with Fig. 9(b), it is found that the amplitude of in the planetary gearbox does increase slightly. and also increased significantly, and the amplitude of decreased slightly. It can still be seen that the frequency amplitude increase around 500 Hz natural frequency.
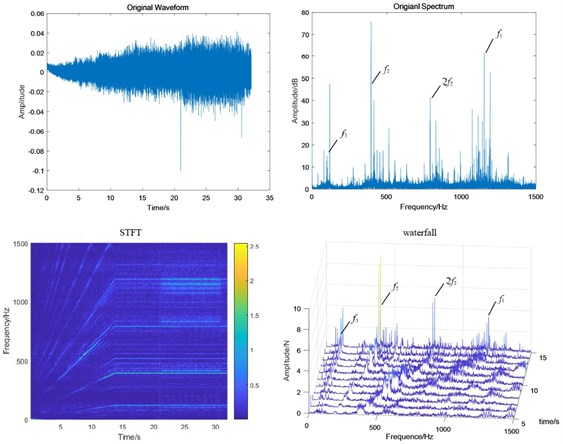
Fig. 12Test bench signal under coupling fault condition: a) fixed-axis gearbox, and b) planetary gearbox
a)
b)
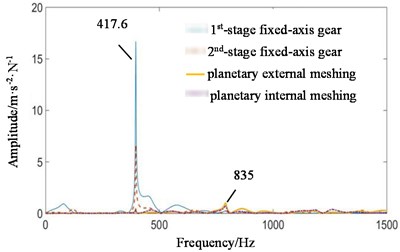
When the two faults are coupled, the planetary wear feature is still the main feature in the fixed-axis gearbox. The most obvious peak is , followed by , and . There are abundant modulation sidebands with intervals of and around the peaks. The energy in the planetary gearbox is concentrated, almost on and . There are many and small sidebands. The amplitude of and decreased significantly.
Single fixed-axis crack or planetary wear fault can be identified by the increase of characteristic frequency of each box in the experimental signal. However, when the two are coupled, the situation is more complex. The frequency amplitude of the fixed-axis crack feature in the fixed-axis gearbox does not increase. The amplitude of planetary wear in the planetary gearbox does not increase, but decreases to be difficult to find. On the contrary, the amplitude of and increases rapidly, which brings misleading and misjudgment to the monitoring. Next, a transfer function analysis will be performed on the signal to explore the sources of and .
4.2. Transfer function analysis
The vibration transmission path system model of multistage gear transmission system is established by using system identification method. The contact force simulation signal in Fig. 8 is used as the input excitation force. The box surface test signal in Fig. 12 is used as output. Tustin inverse transformation and auto regressive exogenous (ARX) model with multi-point input and single point output are used to solve the problem. The transfer function amplitude frequency response curve of each path of the two boxes in the coupling fault state is obtained, as shown in Fig. 13.
Fig. 13Transfer function amplitude frequency response curve of each transmission path when meshing contact force at all stages is transmitted to the box under coupling fault state: a) fixed-axis gearbox, and b) planetary gearbox
a)
b)
In Fig. 13(a), higher amplitude 80 Hz and 120 Hz are not visible in the simulation signal, but exist in the experimental signal. It is the frequency doubling of the rotation frequency of the input shaft. The transfer function shows that it comes from the 1st and 2nd stage fixed-axis meshing vibration, which accords with the actual situation of the project. The amplitude of is the highest, and this phenomenon can be found in both simulation and experimental diagrams, but the source cannot be seen. The amplitude-frequency response curve of the transfer function shows that the energy comes from the 1st and 2nd stage fixed-axis meshing vibration. The planetary gear features are mainly concentrated in , , and their surrounding 40 Hz modulation sideband. As can be seen in Fig. 13(b), the peak in the planetary gearbox still comes from the 1st and 2nd stage fixed-axis gears. Compared with other frequency features, the peak is so obvious that other features in its transfer function image are not visible.
It is proved that the coupling of faults is not the superposition of frequency characteristics. The faulty gears are the 1st-stage fixed-axis and the planetary gear respectively. But when the fault is coupled, the frequency component to be strengthened is not or , but . As the two-stage fixed-axis gears are respectively connected to the two, affected by both of them, the final vibration is the most intense. This phenomenon is often misled and misjudged in the analysis. The 1st and 2nd stage fixed-axes gear are in the same box, and the distance is relatively close, so they account for a large proportion in the transfer function.
5. Conclusions
In order to study the coupling correlation and fault transmission characteristics of gears in multi-stage gear system. The transfer function method is used to explore the relationship between gears. According to the multi-stage gear transmission system, a three-dimensional model is built based on the fault test-rig to analyze the contact force vibration characteristics of all stages of gears. Based on the system identification theory, the transfer function of the contact force of each gear to the box is constructed. By finding the source of each frequency component of the transfer function, the transfer characteristics of the fault are revealed. This study reveals the vibration coupling and transmission mechanism of multi-stage gear system.
References
-
Y. Liu, X. Xin, Y. Zhao, S. Ming, Y. Ma, and J. Han, “Study on coupling fault dynamics of sliding bearing-rotor system,” Journal of Computational and Nonlinear Dynamics, Vol. 14, No. 4, pp. 1–11, Apr. 2019, https://doi.org/10.1115/1.4042688
-
M. Zhen et al., “Nonlinear dynamic analysis of misalignment-Rub-impact coupling fault of rolling bearing rotor system,” Journal of Vibration and Shock, Vol. 39, No. 7, pp. 140–147, 2020.
-
Zhinong Li, Yunlong Li, and Haiyang Diao, “Research on diagnosis method of rotor misalignment-bumping coupling fault based on nonlinear output frequency response function,” Journal of Mechanical Engineering, Vol. 55, No. 19, p. 84, 2019, https://doi.org/10.3901/jme.2019.19.084
-
Y. Yang, Y. Yang, D. Cao, G. Chen, and Y. Jin, “Response evaluation of imbalance-rub-pedestal looseness coupling fault on a geometrically nonlinear rotor system,” Mechanical Systems and Signal Processing, Vol. 118, pp. 423–442, Mar. 2019, https://doi.org/10.1016/j.ymssp.2018.08.063
-
Y. Liu et al., “Characteristic analysis of looseness-rubbing coupling fault in rotor-sliding-bearing system,” Journal of Vibroengineering, Vol. 29, No. 3, pp. 549–554, 2016.
-
S. Guo, T. Yang, H. Hua, and J. Cao, “Coupling fault diagnosis of wind turbine gearbox based on multitask parallel convolutional neural networks with overall information,” Renewable Energy, Vol. 178, pp. 639–650, Nov. 2021, https://doi.org/10.1016/j.renene.2021.06.088
-
R. Jia, F. Ma, H. Wu, X. Luo, and X. Ma, “Coupling fault feature extraction method based on bivariate empirical mode decomposition and full spectrum for rotating machinery,” Mathematical Problems in Engineering, Vol. 2018, pp. 1–10, 2018, https://doi.org/10.1155/2018/4598706
-
Wang Yl, Yang Hb, Yuan Xf, Shardt Yaw, Yang Ch, and Gui Wh, “Deep learning for fault-relevant feature extraction and fault classification with stacked supervised auto-encoder,” Journal of Process Control, Vol. 92, pp. 79–89, 2020.
-
S.-Y. Lin, C.-C. Chiang, J.-B. Li, Z.-S. Hung, and K.-M. Chao, “Dynamic fine-tuning stacked auto-encoder neural network for weather forecast,” Future Generation Computer Systems, Vol. 89, pp. 446–454, Dec. 2018, https://doi.org/10.1016/j.future.2018.06.052
-
X. Li, B. Wu, G. Liu, X. Zhu, and L. Wang, “Microleveling aerogeophysical data using deep convolutional network and MoG-RPCA,” Artificial Intelligence in Geosciences, Vol. 2, pp. 20–25, Dec. 2021, https://doi.org/10.1016/j.aiig.2021.08.003
-
L. Hu, Y. Zhang, and N. Yousefi, “Nonlinear modeling of the polymer membrane fuel cells using deep belief networks and modified water strider algorithm,” Energy Reports, Vol. 7, pp. 2460–2469, Nov. 2021, https://doi.org/10.1016/j.egyr.2021.04.050
-
H. Liu and F. Cao, “Improved dual-scale residual network for image super-resolution,” Neural Networks, Vol. 132, pp. 84–95, Dec. 2020, https://doi.org/10.1016/j.neunet.2020.08.008
-
A. T. Bhat, Anupama, Akshatha, M. S. Rao, and D. G. Pai, “Traffic violation detection in India using genetic algorithm,” Global Transitions Proceedings, Vol. 2, No. 2, pp. 309–314, Nov. 2021, https://doi.org/10.1016/j.gltp.2021.08.056
-
H. Zhou, J. Chen, G. Dong, and R. Wang, “Detection and diagnosis of bearing faults using shift-invariant dictionary learning and hidden Markov model,” Mechanical Systems and Signal Processing, Vol. 72-73, pp. 65–79, May 2016, https://doi.org/10.1016/j.ymssp.2015.11.022
-
X. Kan et al., “A novel IoT network intrusion detection approach based on adaptive particle swarm optimization convolutional neural network,” Information Sciences, Vol. 568, pp. 147–162, Aug. 2021, https://doi.org/10.1016/j.ins.2021.03.060
-
E. Q. Wu et al., “Self-paced dynamic infinite mixture model for fatigue evaluation of pilots’ brains,” IEEE Transactions on Cybernetics, pp. 1–16, 2021, https://doi.org/10.1109/tcyb.2020.3033005
-
Z.-H. Zhang, F. Min, G.-S. Chen, S.-P. Shen, Z.-C. Wen, and X.-B. Zhou, “Tri-partition state alphabet-based sequential pattern for multivariate time series,” Cognitive Computation, pp. 1–19, May 2021, https://doi.org/10.1007/s12559-021-09871-4
-
H. Cui, Y. Guan, and H. Chen, “Rolling element fault diagnosis based on VMD and sensitivity MCKD,” IEEE Access, Vol. 9, pp. 120297–120308, 2021, https://doi.org/10.1109/access.2021.3108972
-
W. Deng et al., “An enhanced fast non-dominated solution sorting genetic algorithm for multi-objective problems,” Information Sciences, Vol. 585, pp. 441–453, Mar. 2022, https://doi.org/10.1016/j.ins.2021.11.052
-
F. X. Magrans, J. Poblet-Puig, and A. Rodríguez-Ferran, “The solution of linear mechanical systems in terms of path superposition,” Mechanical Systems and Signal Processing, Vol. 85, pp. 111–125, Feb. 2017, https://doi.org/10.1016/j.ymssp.2016.07.044
-
L. Li, X. Wang, and X. Zhao, “Transmission characteristics of planetary gear wear in multistage gear transmission system,” Journal of Vibroengineering, Vol. 21, No. 5, pp. 1308–1321, Aug. 2019, https://doi.org/10.21595/jve.2019.20224
-
X. G. Ma, W. Yang, X. M. You, C. G. Chen, and F. Zhang, “Multi-body dynamical analysis on rigid-flexible coupling for planetary gear system,” Chinese Journal of Construction Machinery, Vol. 7, No. 2, pp. 146–152, 2009.
-
Y. L. He et al., “Flexible multibody dynamics modeling and simulation analysis of large-scale wind turbine drivetrain,” Journal of Mechanical Engineering, Vol. 50, No. 1, pp. 61–69, 2014.
About this article

This work is supported by Serve local projects of Shaanxi Provincial Education Department, China (Program No. 20JC001), and Natural Science Basic Research Program of Shaanxi, China (Program No. 2022JM-252).
