Abstract
A new approach to experimental investigation of thermal flow field produced along an isothermal plate of finite dimensions in free convection is presented. The experimental procedure is based upon a flow visualization technique developed earlier by author. The contribution of this paper apparently is that a physical grid placed in the light path of a photographic flow visualization system enhances the ability to discern growth of thermal flow field produced due to temperature difference between a body and its surroundings. The results obtained from flow visualization experiment are verified with a correlation predicted by earlier published work.
Highlights
- A new approach to experimental investigation of visualization of thermal flow field produced along an isothermal plate of of finite dimensions in free convection
- Contribution of this paper is the development of a physical grid (grating) placed in the light path of simple photographic flow visualization technique
- This simple and novel visualization technique enhances the ability to ascertain the growth of thermal flow field in free convection
- The results obtained from the present visualization experiment are compared with the results of earlier published work to validate the present technique
- The present technique is principally used for qualitative measurement of thermal field. However, this can be used for quantitative studies if the grating superimposed in the flow field are properly oriented
1. Introduction
Laminar natural convection heat transfer from flat plates is a problem which is of interest in a variety of industrial as well as research applications. The study of natural convective heat transfer from a vertical flat plate at uniform temperature in a quiescent medium has attracted a great deal of interest from many investigators [1-4] during the past.
Theoretical predictions of laminar heat transfer correlations can be obtained for a plate with arbitrary inclination as described by King and Reible [4] based on their experimental observations. In terms of modified Rayleigh number, , the predicted relation can be shown to be:
where, the local Nusselt number, , and the modified Rayleigh number are defined by:
is the Prandtl number (= ) and is the modified Grashof number and defined by:
Visual observations of the motions which are caused solely by the density gradients created by the difference in temperature are presented here using a relatively simple but novel photographic method of flow visualization [5-7] developed earlier. To the best of the knowledge and belief of the author this technique for processing the image patterns recorded photographically seems to be new for the quantitative study of natural convection from isothermal surfaces. The results obtained are a consequence of visualization of the convective heat transfer from real vertical plates.
2. Experiment
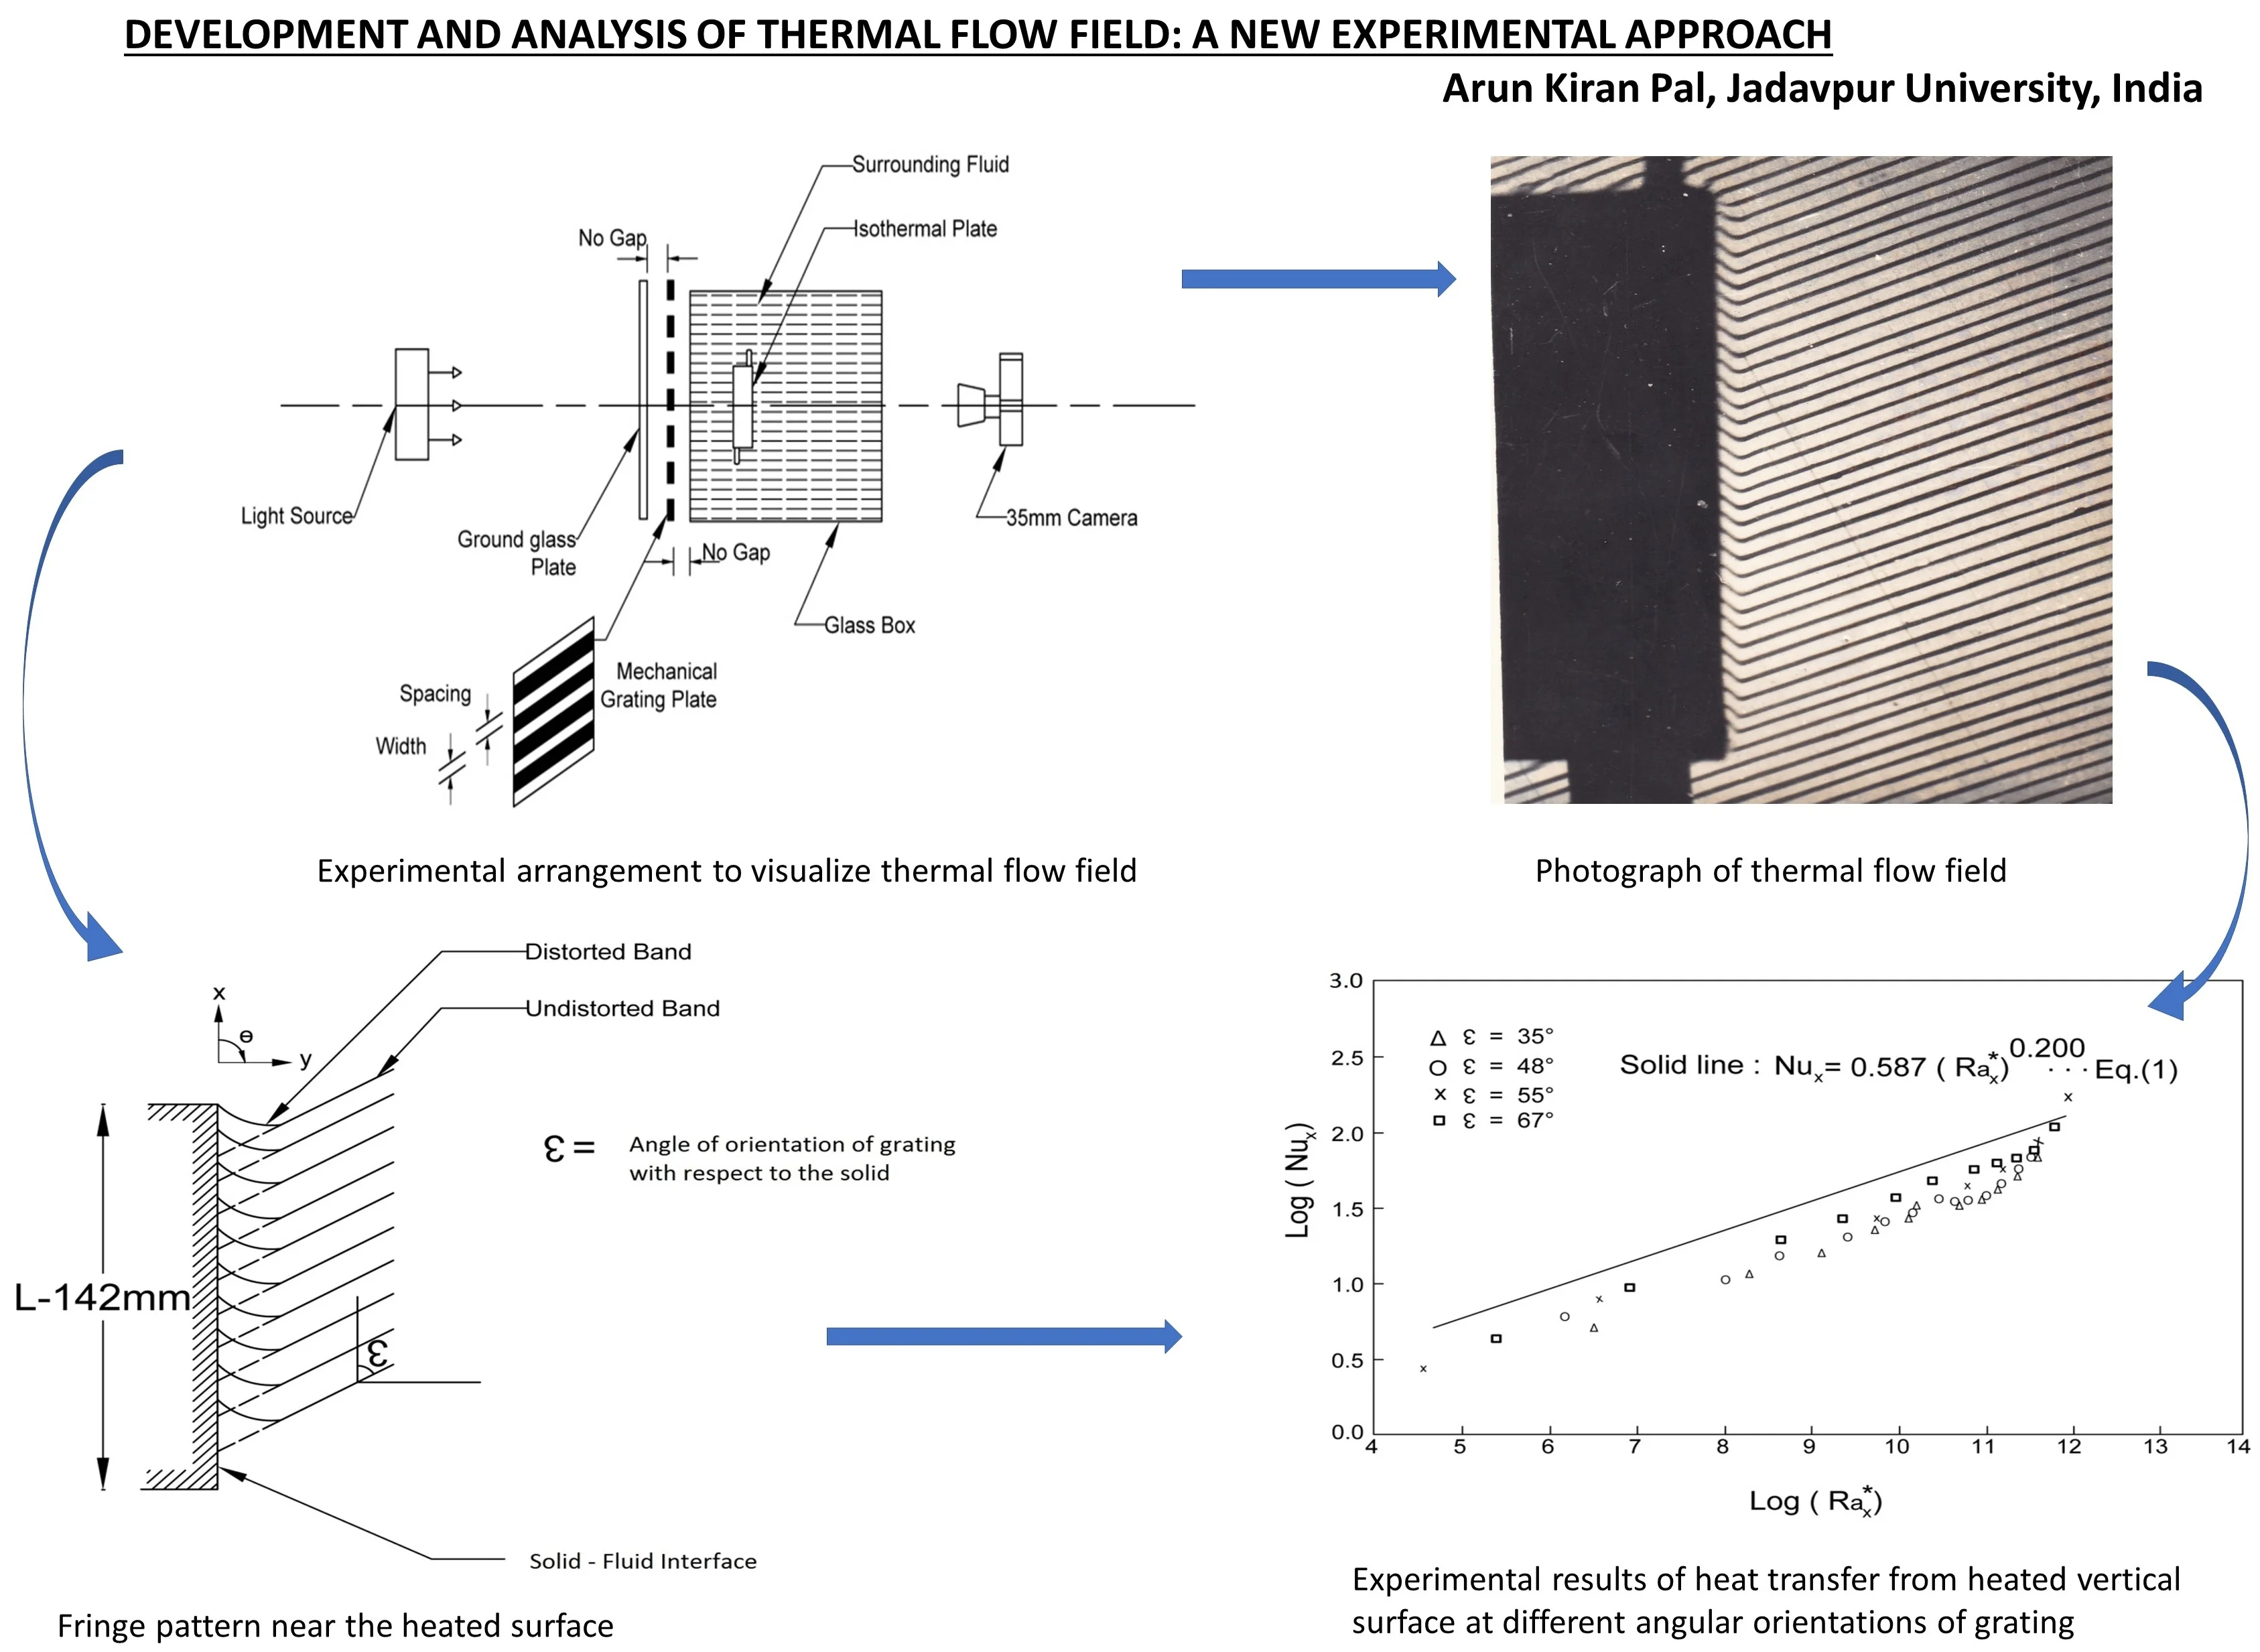
The study of natural convective heat transfer on a isothermal plate placed in vertical position ( 0 degree) is carried out using a simple but new experimental method. The experimental arrangement shown in the sketch (Fig. 1) has been made to record the image of the flow field produced by the heated plate. The isothermal wall of length 142 (mm) is heated by saturated steam (100 °C) at atmospheric pressure and immersed in still water. The fluid surrounding the isothermal wall is kept in a transparent glass box of size 500 (mm) × 400 (mm) × 220 (mm) such that effect of temperature differences at the interface between the two medium can be visualized easily. The heated surface used for these experiments is so arranged inside the water tank that it can be placed in any inclination. The leading edge of the heated surface is situated about 120 (mm) above the bottom of the tank and the trailing edge of the heated surface is always at least 120 (mm) below the top of the water surface.
Fig. 1Experimental arrangement to visualize natural convective flow along a heated plate
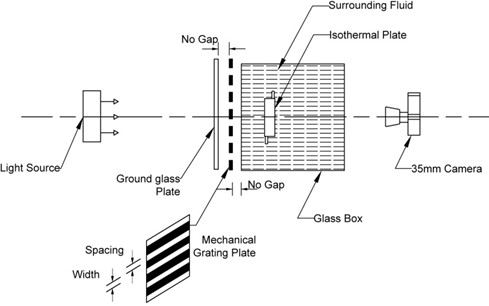
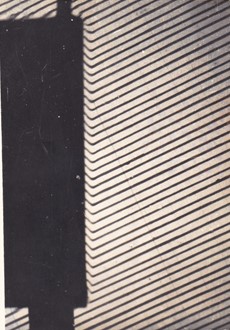
The thermal field (shown in Fig. 2) at a particular temperature difference of 77 °C, has been photographed using the experimental arrangement illustrated in Fig. 1. A strong diffused parallel light beam is passed through the mechanical grating in the form of alternate bright and dark bands of equal widths and the test section, where the model (heated isothermal plate) is placed. The image configuration shown in Fig. 2 is thus obtained by superimposing the shadows of grating on the flow field and recorded by a conventional 35 mm SLR film camera in black and white mode. The exposure time and aperture ( number) which vary with the lighting and flow conditions are determined by using a photographic exposure meter.
Fig. 2Photograph of the natural convective flow from an isothermal vertical plate to water at ΔT=Tw-Tf= 77 °C [7]
![Photograph of the natural convective flow from an isothermal vertical plate to water at ΔT=Tw-Tf= 77 °C [7]](https://static-01.extrica.com/articles/23514/23514-img2.jpg)
The introduction of the alternate bright and dark bands (marked as mechanical grating plate in Fig. 1) have a great influence on the nature of contrast to the so-called interferometric pattern of the flow field obtained in this way. It, however, differs from the conventional interferogram for the resolution of the flow field depends on the width, spacing, as well as the fineness and uniformity of the parallel equidistant bands made on a transparent plastic sheet [6].
3. Results
A close look into the image (Fig. 2) obtained using the method mentioned above reveals that a distortion of the regular fringe pattern in the close vicinity of the vertical surface ( 0 degree) of the heated plate. It is obvious that whenever a temperature gradient is present between two medium, the fringes at the transition zone then are no longer straight, but are distorted. The distorted fringe pattern (Fig. 2) obtained by the present photographic technique generally resembles with the Moirѐ fringe pattern of conventional interferogram showing thermal fields on a heated vertical surface as illustrated previously by Goldstein [8]. A thermal plume at the upper edge of the vertical surface is also quite clear in the image of Fig. 2 as expected [3].
Fig. 3Fringe pattern near the heated surface
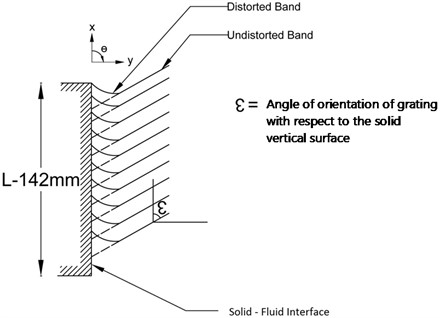
Now it should be reasonable to consider the deviations of grating lines adjacent to the boundary surface are proportional to the change of density. The transition between the regular grating pattern and that of the distorted pattern adjacent to the wall can be employed to determine the local heat transfer coefficient. It is seen that the development of thermal field along an isothermal vertical surface also depends on the angular orientation () of the straight parallel bands with respect to the vertical surface as explained in Fig. 3.
The thermal flow fields developed for different orientation angles of the grating for 67 and 48 degree are shown in the images given in Fig. 2 and Fig. 4, which are obtained at same Prandtl number, 2.92; and the temperature difference between the solid wall and the surrounding fluid is 77 °C.
Fig. 4Photograph of thermal flow field for angle of orientation of grating ε= 48°
Analysis of the flow patterns obtained for different orientation angles of fringes gives evidence that the deviations or shifts of the undisturbed straight bands are dependent on . The local Nusselt number is dependent upon the temperature gradient of the fluid and the wall, which in turn is related to the boundary layer thickness, , at the vertical surface of the solid wall as stated in Eq. (2).
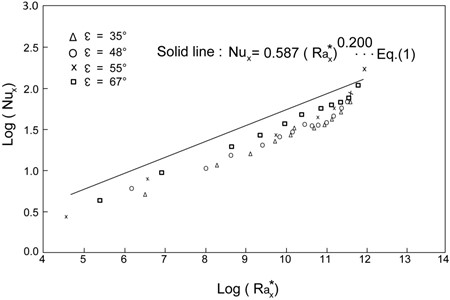
Fig. 5 shows the results which are collected from the measurements of heat transfer from the wall of the heated vertical surface at different angular orientations of grating. The local Nusselt number as determined from the flow pattern is plotted as a function of the modified Rayleigh number.
Fig. 5Variation of Nusselt number with modified Rayleigh number as observed in the experiment
4. Discussions
The experimental data obtained from the enlarged view of images are compared with the heat transfer correlation in free convection suggested by King and Reible [4]. Based on the results obtained, correlations have been proposed to evaluate the Nusselt numbers as shown in Fig. 5. The form of proposed correlation takes into account the variation of different angular orientations of grating as shown. It is found that the Nusselt number shows fairly large dependence on the orientation angles of grating used in the experiment. The validation of the obtained results is made through comparison between the present study with available literature. As a first approximation it is clear that the agreement between the present results and the correlation postulated early [4] is quite satisfactory and the present results seem to agree with the predicted values within the bound of experimental accuracy. The Nusselt number determined experimentally is always found to be less than the estimated ones (Fig. 5) and the mean deviation is about 12.5 % from the predicted values. In other words this implies that the observed thickness of thermal field would be greater than the estimated ones. This deviation may be due to the local disturbances caused during the flow of steam passing through the metal box containing the plate. Moreover the effect of surface roughness of isothermal vertical wall on the flow field is not considered in the present study. This may cause a substantial amount of errors for the observed values of Nusselt number as it is known that the influence of surface roughness of the vertical wall may disturb the fluid motion and induces mixing and thus convection [9]. It is also evident from Fig. 5 that the deviations between the observed and predicted results usually become comparatively small at higher values of the angle of orientation of the parallel dark band (angle ) with respect to the vertical surface.
5. Conclusions
From the observed experimental results it may be said in conclusion that it is possible to relate the measured displacement of regular grating with the gradient of fluid temperature at the solid surface. It implies that the local heat transfer coefficient or the Nusselt number could be determined directly from the images of the thermal field recorded by the present photographic visualization method.
The present study is principally used for qualitative descriptions of a density or temperature field. However, this can be used for quantitative studies in particular if the alternate dark bands superimposed on the flow fields are properly oriented. Also, the effect of width and spacing of the alternate bright and dark bands used in the present investigation on the thermal flow field need to be studied further for quantitative estimation. The differences between existing heat transfer correlation and experimental data presented here indicate that further studies on this experimental technique may be worthy. Considering the findings and future scopes the proposed approach may be considered as an important dimension to the emerging area of optimization and prediction of boundary layer thickness developed in the thermal flow field across vertical or inclined plate in free convection.
References
-
T. Fujii and H. Imura, “Natural-convection heat transfer from a plate with arbitrary inclination,” International Journal of Heat and Mass Transfer, Vol. 15, No. 4, pp. 755–767, Apr. 1972, https://doi.org/10.1016/0017-9310(72)90118-4
-
R. Yang and L. S. Yao, “Natural convection along a finite vertical plate,” Journal of Heat Transfer, Vol. 109, No. 2, pp. 413–418, May 1987, https://doi.org/10.1115/1.3248097
-
W. M. Lewandowski, “Natural convection heat transfer from plates of finite dimensions,” International Journal of Heat and Mass Transfer, Vol. 34, No. 3, pp. 875–885, Mar. 1991, https://doi.org/10.1016/0017-9310(91)90133-y
-
J. A. King and D. D. Reible, “Laminar natural convection heat transfer from inclined surfaces,” International Journal of Heat and Mass Transfer, Vol. 34, No. 7, pp. 1901–1904, Jul. 1991, https://doi.org/10.1016/0017-9310(91)90165-b
-
A. K. Pal and B. Bose, “A new optical study of supersonic flow past wedge profiles by hydraulic analogy,” Experiments in Fluids, Vol. 14, No. 3, pp. 210–213, Jan. 1993, https://doi.org/10.1007/bf00189513
-
A. K. Pal and B. Bose, “Simple method of supersonic flow visualization using watertable,” AIAA Journal, Vol. 33, No. 1, pp. 181–182, Jan. 1995, https://doi.org/10.2514/3.12357
-
A. K. Pal, and B. Bose, “A novel technique of flow visualization for the study of two-dimensional flow problems,” in Proceedings of the 3rd Asian Symposium on Visualization, pp. 808–813, 1994.
-
R. J. Goldstein, “Optical techniques for temperature measurement,” in Measurements in Heat Transfer, Hemisphere, Washington, 1976, pp. 241–293.
-
M. J. Tummers and M. Steunebrink, “Effect of surface roughness on heat transfer in Rayleigh-Bénard convection,” International Journal of Heat and Mass Transfer, Vol. 139, pp. 1056–1064, Aug. 2019, https://doi.org/10.1016/j.ijheatmasstransfer.2019.05.066
About this article

The authors have not disclosed any funding.
The datasets generated during and/or analyzed during the current study are available from the corresponding author on reasonable request.
The authors declare that they have no conflict of interest.
