Abstract
The study of the acoustic characteristics of sound-absorbing structures (SAS) seems to be an urgent task aimed at solving the problem of noise both in the cabin of aircraft and aircraft engine noise. Results of experimental study of the effect of the size of the cell edges of a fiberglass honeycomb core and the degree of perforation on the acoustic characteristics of single-layer sound-absorbing structures are presented. Tests of samples of sound-absorbing structures were performed on an interferometer type installation with a normal incidence of sound waves. The dependence of the acoustic characteristics of SAS on the size of the edge of the honeycomb filler is shown, in connection with the overlap of the holes of the perforated sheet of SAS with the edges of the honeycomb block. The dependence of the resonant frequency and the efficiency of the structure on the diameter of the holes of the perforated sheet are shown.
Highlights
- The study of the acoustic characteristics of sound-absorbing structures (SAS) seems to be an urgent task aimed at solving the problem of noise both in the cabin of aircraft and aircraft engine noise.
- Six samples of single-layer resonant sound-absorbing structures with honeycomb rib lengths 2.5, 4.2 and 8 mm and two perforated sheets with hole diameters 1 and 1.6 mm were studied at the interferometer installation with a normal sound wave incidence.
- The dependence of the acoustic characteristics of SAS on the size of the edge of the honeycomb filler is shown, in connection with the overlap of the holes of the perforated sheet of SAS with the edges of the honeycomb block.
1. Introduction
To reduce noise levels in the cabins of airplanes [1-3] and helicopters [4-6], as well as aircraft engine noise [7-10], various sound-absorbing structures (SAS) are currently widely used [11-15]. Numerical modeling of SAS, especially of the nonlocally reacting and combined types, is currently a rather difficult task [16-21], therefore experimental methods for determining acoustic characteristics and tuning the SAS to a problematic frequency range do not lose their relevance. Parametric studies of SAS on installations such as “interferometer” and “interferometer with flow” contribute to the development of effective methods for predicting the acoustic characteristics of the SAS [22-24].
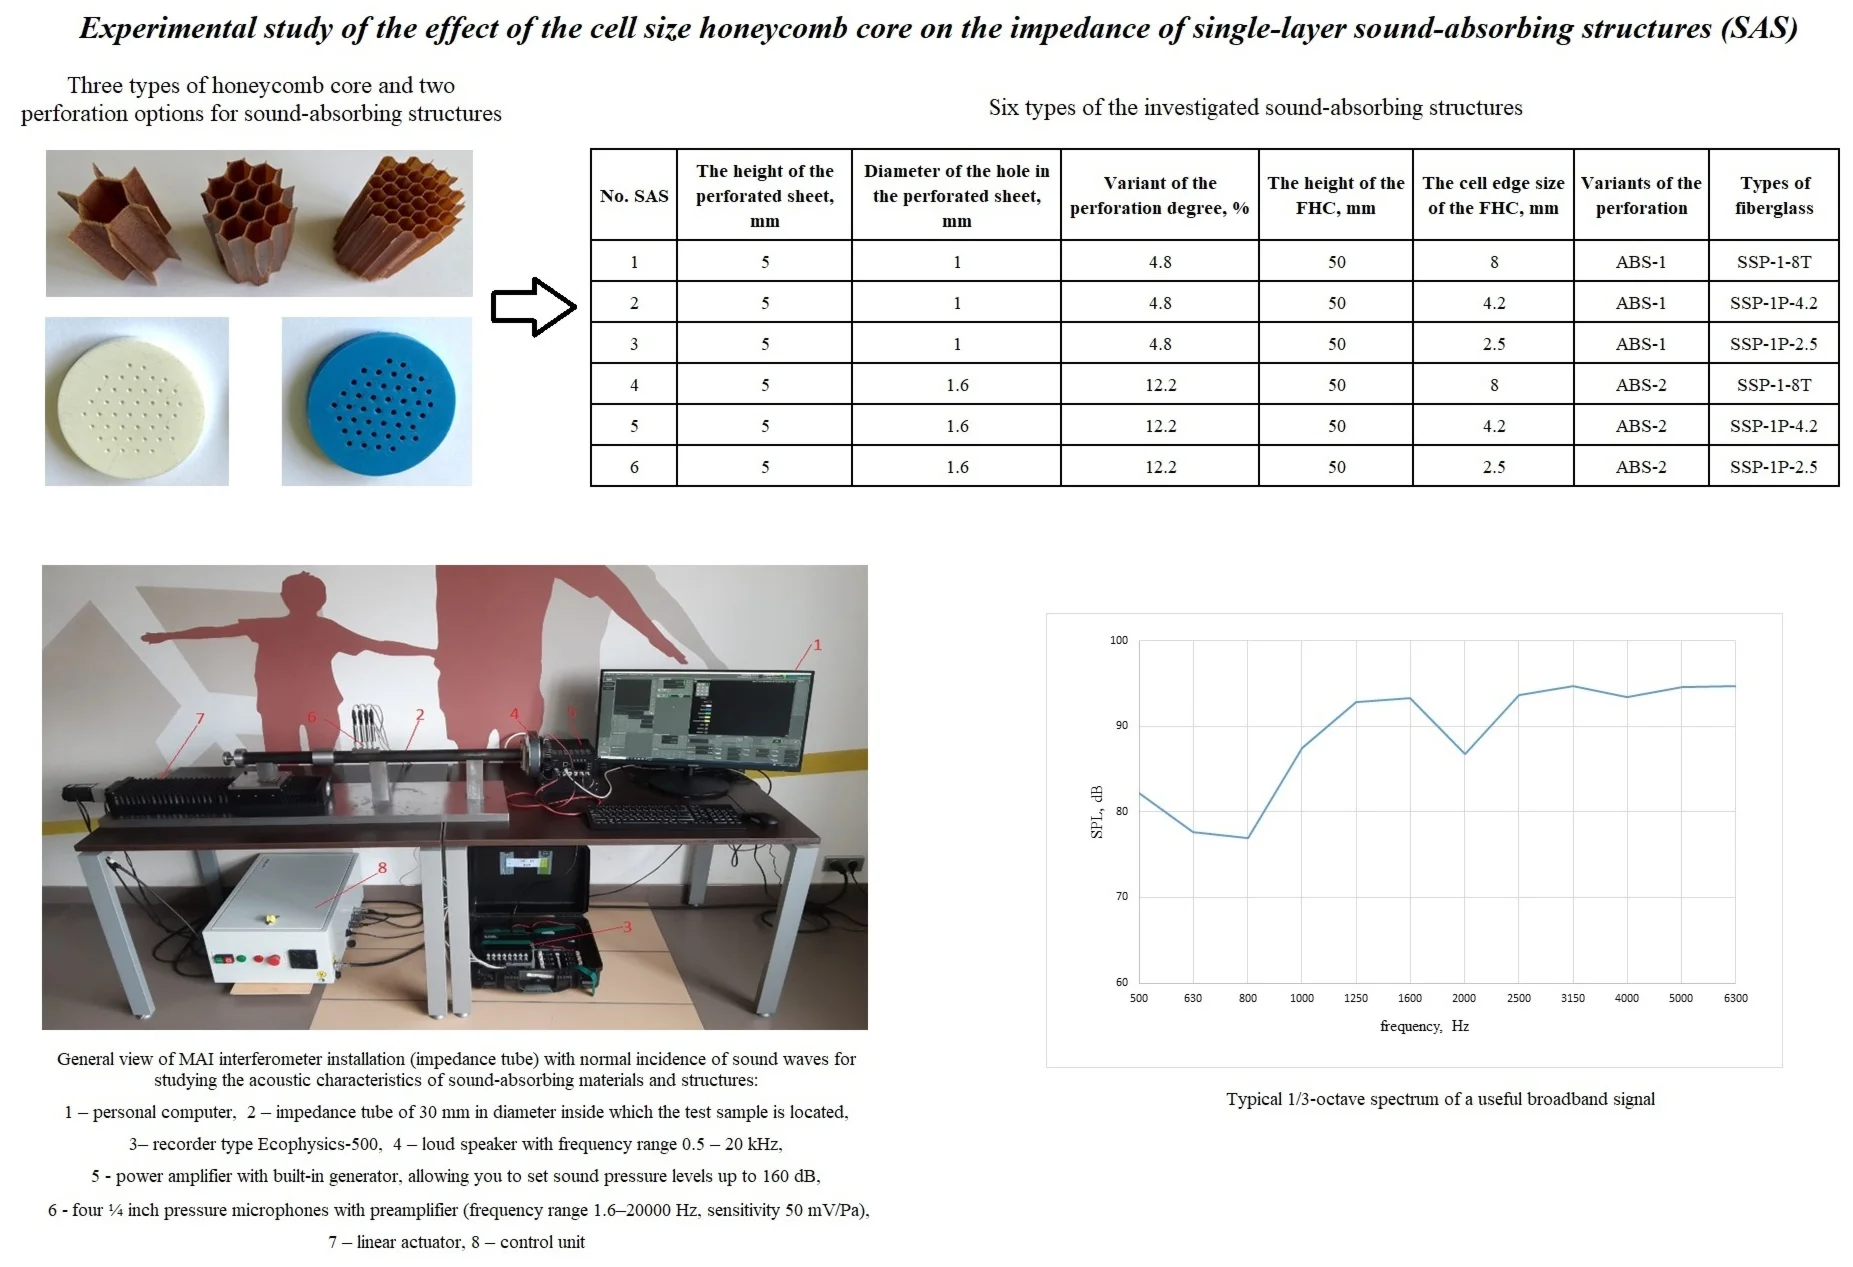
This paper presents the results of an experimental study of the effect of the size of the cell edges of a fiberglass honeycomb core (FHC) and the degree of perforation on the acoustic characteristics single-layer SAS. Tests were performed on an interferometer installation with normal incidence of sound waves of MAI.
Experimental studies in the design of effective SAS for aircraft engines usually include three main stages:
– Evaluation of the acoustic characteristics of SAS in laboratory conditions using installations such as “Interferometer” [25-29] and “Interferometer with flow” [30, 31].
– Evaluation of the effectiveness of SAS during bench tests of aircraft engines [32, 33].
– Evaluation of the effectiveness of SAS during flight tests of the aircraft [34, 35].
In the design of SAS to reduce noise levels in cabins of aircrafts and helicopters, it is necessary to test samples on an “interferometer” type installation under a load spectrum characteristic of the noise spectrum in the cabin.
The role of an interferometer installation with a normal incidence of sound waves in the selection of effective SAS for reducing aircraft noise in the cabin and aircraft engine noise is determined by the following provisions:
– Allows you to quickly and fairly reliably obtain preliminary acoustic characteristics of various versions of the designed SAS.
– Allows you to consider the influence of the sound pressure level (nonlinear effect) on the acoustic characteristics of SAS [36] installed in the engine duct.
– Allow you to give a primary evaluation of the effectiveness of the structures being designed, as well as verify semi-empirical and numerical methods for calculating the SAS, as well as determine the acoustic characteristics of sound-absorbing materials, both separately and as part of the SAS.
In general, a significant amount of research has been devoted to the study of the acoustic characteristics of samples of SAS based on the results of tests on an “interferometer” type, but the relevance of such work is beyond doubt due to the lack of other simple ways to determine the acoustic characteristics of samples of sound-absorbing materials and structures and especially take into account the various impedance parameters of the SAS and require compliance with measures to reduce noise levels of a source with known acoustic parameters.
2. Materials and methods
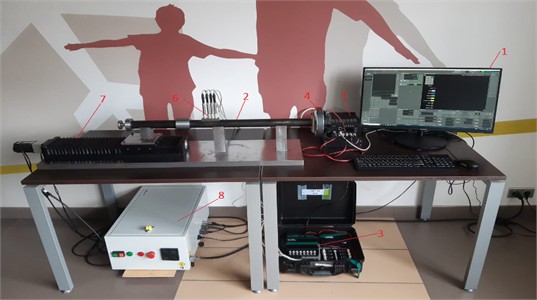
Measurements of the acoustic characteristics of the SAS samples were performed on an interferometer-type installation with a normal incidence of sound waves, created at the Moscow Aviation Institute [37]. The general view of the installation is shown in Fig. 1. To the impedance eduction at this stage of the installation development, a standardized two-microphone method has been implemented, described in detail in the standards [38, 39].
Fig. 1General view of MAI interferometer installation (impedance tube) with normal incidence of sound waves for studying the acoustic characteristics of sound-absorbing materials and structures: 1 – personal computer, 2 – impedance tube of 30 mm in diameter inside which the test sample is located, 3 – recorder type Ecophysics-500, 4 – loud speaker with frequency range 0.5-20 kHz, 5 – power amplifier with built-in generator, allowing you to set sound pressure levels up to 160 dB, 6 – four 1/4 inch pressure microphones with preamplifier (frequency range 1.6-20000 Hz, sensitivity 50 mV/Pa), 7 – linear actuator, 8 – control unit
Normalized impedance ratio is calculated by using:
where normal reflection factor.
Real part of acoustic impedance respectively:
Imaginary part of acoustic impedance respectively:
where is the real component , is the imaginary component .
The sound absorption coefficient can be found through the reflection coefficient as follows:
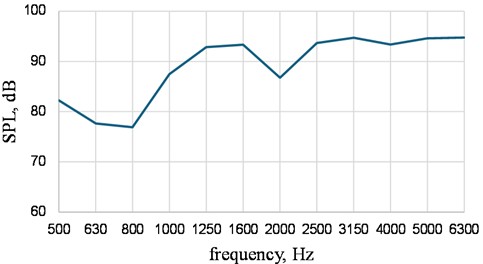
During the study on the interferometer installation with a normal sound drop, a white noise signal with overall sound pressure level of 100 dB was used. Fig. 2 shows a typical 1/3-octave spectrum of a useful broadband signal in the study of SAS samples on an interferometer-type installation. It is worth noting that the samples were tested under the same conditions in order to exclude the influence of other factors on the acoustic characteristics.
Fig. 2Typical 1/3-octave spectrum of a useful broadband signal
The device works as follows. The sample for the study is installed in the tube holder – 2. On the personal computer – 1, the necessary coordinates are set for the smooth joining of the two parts of the impedance tube into a single whole. The coordinates are transmitted to the linear actuator control unit – 8. The servo motor, receiving data from the linear actuator control unit, drives the linear displacement module – 7. The part of the impedance tube located on the linear displacement module smoothly connects to the second part of the impedance tube, ensuring sample compression. The end of the piston with the rod is manually smoothly brought to the base of the sample. The rigid connection of the two parts of the tube is provided by a coupling. After joining the two parts of the impedance tube into a single whole, further operation of the interferometer is standard: loud speaker – 4 irradiates the test sample with a given sound signal, microphones – 6 measure acoustic pressure at specified points in the channel of the impedance tube, a recorder – 3 is used to process the acoustic signal.
Table 1Six types of the investigated SAS
No. SAS | The height of the perforated sheet, mm | Diameter of the hole in the perforated sheet, mm | Variant of the perforation degree, % | The height of the FHC, mm | The cell edge size of the FHC, mm | Variants of the perforation | Types of fiberglass |
1 | 5 | 1 | 4.8 | 50 | 8 | ABS-1 | SSP-1-8T |
2 | 5 | 1 | 4.8 | 50 | 4.2 | ABS-1 | SSP-1P-4.2 |
3 | 5 | 1 | 4.8 | 50 | 2.5 | ABS-1 | SSP-1P-2.5 |
4 | 5 | 1.6 | 12.2 | 50 | 8 | ABS-2 | SSP-1-8T |
5 | 5 | 1.6 | 12.2 | 50 | 4.2 | ABS-2 | SSP-1P-4.2 |
6 | 5 | 1.6 | 12.2 | 50 | 2.5 | ABS-2 | SSP-1P-2.5 |
Six samples of SAS with constant parameters (the height of the perforated sheet is 5 mm and the height of the FHC is 50 mm) were researched (Table 1). The design of the perforated sheets shown in Fig. 3 was developed by the authors and produced by method by 3D printing. Two variants of the perforation degree of 4.8 and 12.2 % with hole diameters in the perforated sheet of 1 and 1.6 mm (Fig. 2), respectively, as well as the fiberglass of three standard types SSP-1-8T, SSP-1P-4.2 and SSP-1P-2.5, differing in the cell edge sizes of 8, 4.2 and 2.5 mm (Fig. 3), respectively, were considered. The researched honeycomb cores shown in Fig. 4 are produced by JSC “ORPE Technologiya named after A.G. Romashin”. It is worth noting that the materials used in the researched sound-absorbing structures are widespread and freely available.
Fig. 3Two variants of the perforation degree of 4.8 and 12.2 % with hole diameters in the perforated sheet of 1 and 1.6 mm, respectively
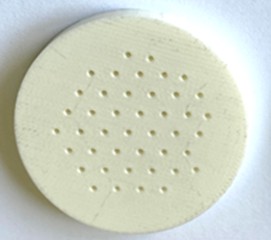
a) ABS-1
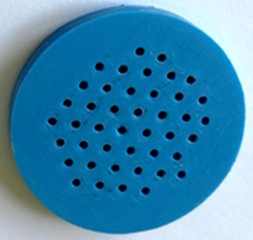
b) ABS-2
Fig. 4The studied fiberglass of three types SSP-1-8T, SSP-1P-4.2 and SSP-1P-2.5, differing in the cell edge sizes of 8, 4.2 and 2.5 mm
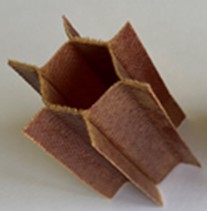
a) SSP-1-8T
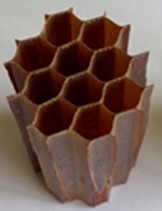
b) SSP-1P-4.2
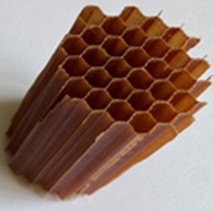
c) SSP-1P-2.5
3. Results
As a result of the research of the obtained data about real and imaginary parts of impedance and sound absorption coefficient SAS in frequency range of 500-2500 Hz with band width of 1 Hz.
The real part is the active acoustic resistance, which is determined by the energy dissipation in the acoustic system itself and the loss of sound radiation. The imaginary part is the reactive acoustic resistance, which is a consequence of the presence of elastic forces or mass inertia in the acoustic system. According to these acoustic characteristics, the sound absorption coefficient is calculated at the interferometer installation with a normal sound wave incidence, and the efficiency of the structure in terms of level reduction can also be determined, both in individual frequency bands and in total across the spectrum.
Fig. 5 and 6 show the real part of the impedance , the imaginary part of the impedance and the sound absorption coefficient of SAS No.1…6 with geometric parameters from Table 1. The effect of the size of the cell edges of a fiberglass honeycomb core on the acoustic characteristics of single-layer sound-absorbing structures at perforation degree of 4.8 % with hole diameters in the perforated sheet of 1 mm are shown in Fig. 5. The effect of the size of the cell edges of a fiberglass honeycomb core on the acoustic characteristics of single-layer sound-absorbing structures at perforation degree of 12.2 % with hole diameters in the perforated sheet of 1.6 mm are shown in Fig. 6.
Fig. 5The effect of the size of the cell edges of a fiberglass honeycomb core on the acoustic characteristics of single-layer sound-absorbing structures at perforation degree of 4.8 % with hole diameters in the perforated sheet of 1 mm
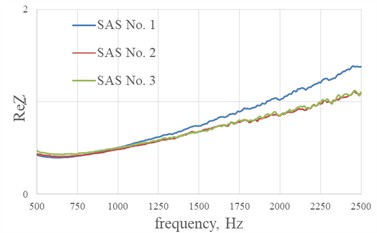
a) Real part of the impedance
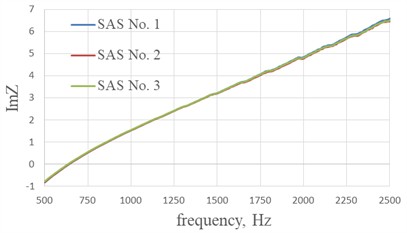
b) Imaginary part of the impedance
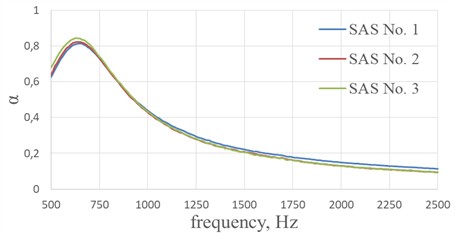
c) Sound absorption coefficient
Fig. 6The effect of the size of the cell edges of a fiberglass honeycomb core on the acoustic characteristics of single-layer sound-absorbing structures at perforation degree of 12.2 % with hole diameters in the perforated sheet of 1.6 mm
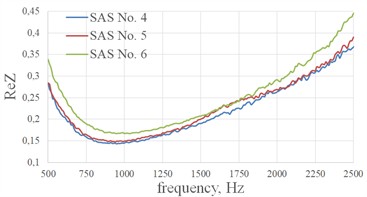
a) Real part of the impedance
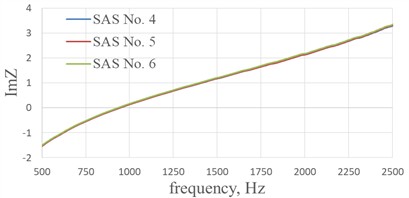
b) Imaginary part of the impedance
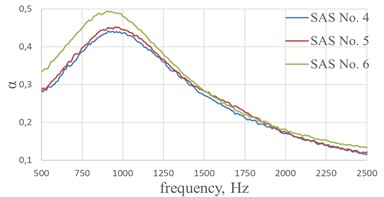
c) Sound absorption coefficient
The graphs of the imaginary part of the impedance of the studied SAS No. 1…6 in the frequency range when crossing the zero value are shown in Fig. 7.
Fig. 7Imaginary part of the impedance (ImZ) of the studied SAS in the frequency range when crossing zero value
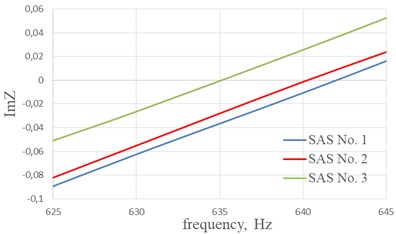
a) Frequency range is 625-645 Hz for SAS No.1…3
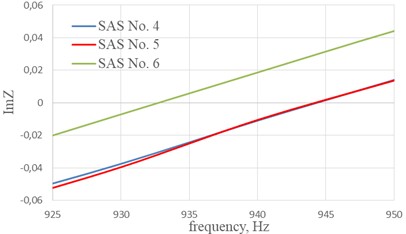
b) Frequency range is 925-950 Hz for SAS No.4…6
From the graphs of the imaginary part of the impedance shown in Fig. 7, we can conclude that reducing the length of the cell edge of the honeycomb shifts the resonant frequency of the structure to the low frequency range in the case of SAS No. 1…3 with perforation 4.8 %, the maximum shift 7 Hz (Fig. 7(a)), in the case SAS No. 4…6 with perforation 12.2 % the maximum shift 12 Hz (Fig. 7(b)). The shift in the resonant frequency of the structure is associated with a decrease in the percentage of perforation due to the overlapping of the holes with the cells edges of the honeycomb core.
The values of the real part of the impedance of the studied SAS No. 1…6 with the corresponding value of the imaginary part of the impedance 0 is shown in Table 2.
Table 2Values of the real part of the impedance corresponding to the frequency, where ImZ= 0
No. SAS | 1 | 2 | 3 | 4 | 5 | 6 |
0.396 | 0.407 | 0.431 | 0.144 | 0.147 | 0.169 |
According to the data given in Table 2, we can conclude that the values of the real part of the impedance increase with a decrease in the length of the cell edge of the honeycomb, which confirms the assumption made above about the decrease in the degree of perforation of the input sheet of the SAS due to the overlapping of the holes with the cells edges of the honeycomb core. Accordingly, the shorter the cell edge length of the honeycomb, the greater the effect on the acoustic characteristics of the structure. It is also worth noting a slight increase in the sound absorption coefficient of SAS No. 3 and SAS No. 6 (Fig. 5(c) and Fig. 6(c)) with a honeycomb core with a minimum cell edge, due to an increase in the real part of the impedance at the resonant frequency of the structure 635 and 933 Hz, respectively.
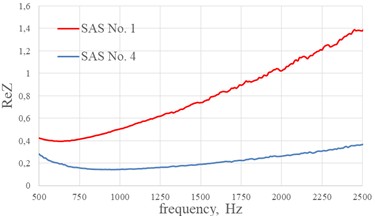
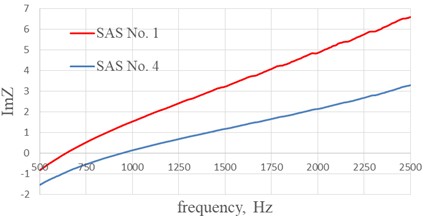
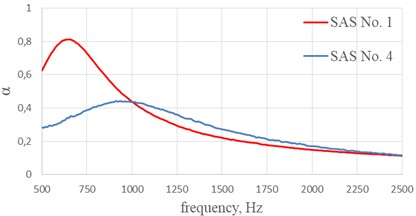
The comparisons of acoustic characteristics: the real part of the impedance , the imaginary part of the impedance and the sound absorption coefficient of SAS No. 1 and SAS No. 4. The difference between SAS No. 1 and SAS No. 4 is in the diameter of the holes of the perforated sheet 1 mm and 1.6 mm are shown in Fig. 8.
When the hole diameter of the perforated sheet increases from 1 to 1.6 mm, the resonant frequency of the structure shifts to the high frequency range by 298 Hz (Fig. 8(b)). An increase in the diameter of the holes of SAS No. 4 to 1.6 mm leads to an increase in the percentage of perforation of the structure to 12.2 %, which greatly reduces the real part of the impedance at a resonant frequency by 0.25 (Fig. 8(a)) compared with SAS No. 1, while the sound absorption coefficient of SAS No. 4 decreases by 0.3 compared with SAS No. 1 (Fig. 8(c)).
Fig. 8The effect degree of perforation on the acoustic characteristics of single-layer sound-absorbing structure with fiberglass of SSP-1-8T (edge size of 8 mm)
a) Real part of the impedance
b) Imaginary part of the impedance
c) Sound absorption coefficient
4. Conclusions
Six samples of single-layer resonant sound-absorbing structures with honeycomb rib lengths 2.5, 4.2 and 8 mm and two perforated sheets with hole diameters 1 and 1.6 mm were studied at the interferometer installation with a normal sound wave incidence. The dependence of the acoustic characteristics of SAS on the size of the edge of the honeycomb filler is shown, in connection with the overlap of the holes of the perforated sheet of SAS with the edges of the honeycomb block. The dependence of the resonant frequency and the efficiency of the structure on the diameter of the holes of the perforated sheet are shown.
To create effective sound-absorbing structures, it is necessary to take into account the influence of honeycomb filler ribs on acoustic characteristics. The result obtained in this work will serve as the basis for fine-tuning resonant-type sound-absorbing structures to a problematic frequency range from the point of view of noise reduction. It is necessary to clarify the empirical and semi-empirical models for calculating the impedance of cellular resonant structures, taking into account the overlap of holes with the edges of the cellular filler.
References
-
P. A. Moshkov and D. Y. Strelets, “Problems of a supersonic business aircraft design with regard to cabin noise requirements,” in Springer Aerospace Technology, Singapore: Springer Nature Singapore, 2023, pp. 157–170, https://doi.org/10.1007/978-981-19-9010-6_14
-
K. Kuznetsov, V. Lavrov, P. Moshkov, and V. Rubanovsky, “Designing of RRJ-95NEW-100 aircraft with regard to cabin noise requirements,” Akustika, Vol. 41, pp. 34–39, Jan. 2021, https://doi.org/10.36336/akustika20214134
-
V. Lavrov, P. Moshkov, and D. Strelets, “Analysis of the Sound field structure in the cabin of the RRJ-95NEW-100 prototype aircraft,” Aerospace, Vol. 10, No. 6, p. 559, Jun. 2023, https://doi.org/10.3390/aerospace10060559
-
P. Moshkov, “The problems of designing helicopters with regard to the requirements for cabin noise,” in E3S Web of Conferences, Vol. 549, p. 02007, Jul. 2024, https://doi.org/10.1051/e3sconf/202454902007
-
C. Li, Y. Lu, C. Lan, and Y. Wang, “Noise reduction in helicopter cabins using microperforated panel composite sound absorption structures,” Applied Sciences, Vol. 13, No. 14, p. 8153, Jul. 2023, https://doi.org/10.3390/app13148153
-
A. Y. Zverev, “Noise control mechanisms of inside aircraft,” Acoustical Physics, Vol. 62, No. 4, pp. 478–482, Jul. 2016, https://doi.org/10.1134/s1063771016040187
-
N. Gorodkova, V. Chursin, Y. Bersenev, R. Burdakov, A. Siner, and T. Viskova, “Modal analysis of an aircraft engine fan noise,” Proceedings of the 18th International Conference on the Methods of Aerophysical Research, Vol. 1770, p. 030118, Jan. 2016, https://doi.org/10.1063/1.4964060
-
V. Samokhin, P. Moshkov, and A. Yakovlev, “Analytical model of engine fan noise,” Akustika, Vol. 32, pp. 168–173, Mar. 2019, https://doi.org/10.36336/akustika201932168
-
I. Khaletskii, V. Mileshin, Y. Pochkin, and A. Rossikhin, “Impact of fan aerodynamic parameters on ducted counter rotating fan noise,” in 25th International Congress on Sound and Vibration, pp. 1399–1405, 2018.
-
E. Koromyslov, M. Usanin, L. Gomzikov, A. Siner, and T. Lyubimova, “Towards the computation of aircraft engine fan noise generation with high order methods on GPUs,” International Journal of Aeroacoustics, Vol. 15, No. 6-7, pp. 614–630, Jul. 2016, https://doi.org/10.1177/1475472x16659386
-
D. L. Sutliff, “Liner development at low technology readiness level utilizing the advanced noise control fan,” International Journal of Aeroacoustics, Vol. 20, No. 5-7, pp. 680–707, Jun. 2021, https://doi.org/10.1177/1475472x211023836
-
M. S. Ipatov, M. N. Ostroumov, and A. F. Sobolev, “Effect of the spectrum of a high-intensity sound source on the sound-absorbing properties of a resonance-type acoustic lining,” Acoustical Physics, Vol. 58, No. 4, pp. 426–433, Jul. 2012, https://doi.org/10.1134/s1063771012040082
-
A. F. Sobolev, V. G. Ushakov, and R. D. Filippova, “Homogeneous sound-absorbing structures for aircraft engine ducts,” Acoustical Physics, Vol. 55, No. 6, pp. 805–815, Nov. 2009, https://doi.org/10.1134/s1063771009060153
-
E. Gliscinska, J. Perez de Amezaga, M. Michalak, and I. Krucinska, “Green sound-absorbing composite materials of various structure and profiling,” Coatings, Vol. 11, No. 4, p. 407, Mar. 2021, https://doi.org/10.3390/coatings11040407
-
Y. I. Dosikova, “Studies of soundproofing characteristics of sandwich panels with cores of Z-crimp type,” Russian Aeronautics (Iz VUZ), Vol. 56, No. 2, pp. 194–198, Aug. 2013, https://doi.org/10.3103/s1068799813020141
-
P. V. Pisarev, A. A. Pankov, A. N. Anoshkin, and K. A. Akhunzyanova, “Modeling acoustic processes of the interaction of cells of sound-absorbing structures of aircraft engines,” Acoustical Physics, Vol. 69, No. 6, pp. 853–862, Feb. 2024, https://doi.org/10.1134/s1063771023600912
-
V. V. Bashkatov and N. N. Ostrikov, “Influence of the nonlinear operating mode of acoustic liners at high sound pressure levels on sound wave propagation in a cylindrical duct with a flow,” Acoustical Physics, Vol. 70, No. 1, pp. 9–20, May 2024, https://doi.org/10.1134/s1063771023600481
-
N. N. Ostrikov, “An asymptotic method for taking into account the influence of the boundary layer of a high-speed flow on the propagation characteristics of sound modes in a cylindrical duct with rigid walls,” Doklady Physics, Vol. 67, No. 9, pp. 348–355, Mar. 2023, https://doi.org/10.1134/s1028335822090117
-
P. V. Pisarev and K. A. Akhunzyanova, “Numerical study of the acoustic efficiency of different-height sound-absorbing structure in a channel with tangential incidence of sound wave in the presence of flow,” Russian Aeronautics, Vol. 66, No. 4, pp. 893–901, Apr. 2024, https://doi.org/10.3103/s1068799823040311
-
C. K. W. Tam, N. N. Pastouchenko, M. G. Jones, and W. R. Watson, “Experimental validation of numerical simulations for an acoustic liner in grazing flow: Self-noise and added drag,” Journal of Sound and Vibration, Vol. 333, No. 13, pp. 2831–2854, Jun. 2014, https://doi.org/10.1016/j.jsv.2014.02.019
-
I. V. Khramtsov, O. Y. Kustov, E. S. Fedotov, and A. A. Siner, “On numerical simulation of sound damping mechanisms in the cell of a sound-absorbing structure,” Acoustical Physics, Vol. 64, No. 4, pp. 511–517, Jul. 2018, https://doi.org/10.1134/s1063771018040073
-
A. F. Sobolev and M. A. Yakovets, “Application of the Wiener-Hopf method for describing the propagation of sound in cylindrical and rectangular channels with an impedance jump in the presence of a flow,” Acoustical Physics, Vol. 63, No. 6, pp. 625–636, Nov. 2017, https://doi.org/10.1134/s1063771017060148
-
A. F. Sobolev, “A semiempirical theory of a one-layer cellular sound-absorbing lining with a perforated face panel,” Acoustical Physics, Vol. 53, No. 6, pp. 762–771, Nov. 2007, https://doi.org/10.1134/s1063771007060164
-
V. Palchikovskiy, A. Kuznetsov, I. Khramtsov, and O. Kustov, “Comparison of semi-empirical impedance models for locally-reacting acoustic liners in a wide range of sound pressure levels,” Acoustics, Vol. 5, No. 3, pp. 676–692, Jul. 2023, https://doi.org/10.3390/acoustics5030041
-
S. Dogra and A. Gupta, “Acoustic material testing using impedance tube,” in Handbook of Vibroacoustics, Noise and Harshness, Singapore: Springer Nature Singapore, 2024, pp. 1–13, https://doi.org/10.1007/978-981-99-4638-9_24-1
-
M. Barzegar and C. E. Davies, “the practicality of using generic acoustical equipment in impedance tube design,” Acoustics Australia, Vol. 52, No. 3, pp. 393–400, May 2024, https://doi.org/10.1007/s40857-024-00326-y
-
I. Khramtsov, O. Kustov, V. Palchikovskiy, and V. Ershov, “Investigation of the reason for the difference in the acoustic liner impedance determined by the transfer function method and dean´s method,” Akustika, Vol. 39, p. 224, Jan. 2021, https://doi.org/10.36336/akustika202139224
-
P. V. Pisarev, A. A. Pan’Kov, and A. N. Anoshkin, “Acoustic interaction of piezo-adaptive resonance cells of the sound-absorbing honeycomb panel,” Russian Aeronautics, Vol. 65, No. 1, pp. 200–205, Feb. 2023, https://doi.org/10.3103/s1068799822010238
-
V. Palchikovskiy, I. Khramtsov, and O. Kustov, “On the influence of certain geometric characteristics of the resonator on the impedance determined by the dean’s method,” Acoustics, Vol. 4, No. 2, pp. 382–393, Apr. 2022, https://doi.org/10.3390/acoustics4020023
-
N. Ostrikov, “Investigation of impedance eduction accuracy on “interferometer with the flow” test rigs with help of exact solution problem of sound propagation in duct with impedance transition,” in 23rd AIAA/CEAS Aeroacoustics Conference, Jun. 2017, https://doi.org/10.2514/6.2017-3186
-
S. L. Denisov and N. N. Ostrikov, “Finite element method application for the impedance eduction problem on “interferometer with the flow” installations,” Mathematical Models and Computer Simulations, Vol. 15, No. 3, pp. 373–383, May 2023, https://doi.org/10.1134/s2070048223030043
-
S. Busse-Gerstengarbe, F. Bake, L. Enghardt, and M. G. Jones, “Comparative study of impedance eduction methods, part 1: DLR tests and methodology,” in 19th AIAA/CEAS Aeroacoustics Conference, May 2013, https://doi.org/10.2514/6.2013-2124
-
M. G. Jones, W. R. Watson, B. M. Howerton, and S. Busse-Gerstengarbe, “Comparative study of impedance eduction methods, part 2: NASA tests and methodology,” in 19th AIAA/CEAS Aeroacoustics Conference, May 2013, https://doi.org/10.2514/6.2013-2125
-
M. Y. Zaytsev, V. F. Kopiev, S. A. Velichko, and I. V. Belyaev, “Localization and ranking of aircraft noise sources in flight tests and comparison with acoustic measurements of a large-scale wing model,” Acoustical Physics, Vol. 69, No. 2, pp. 182–192, May 2023, https://doi.org/10.1134/s1063771023700562
-
M. Y. Zaytsev and V. Kopiev, “Fly-over noise source localization during acoustic flight tests of advanced passenger aircraft,” in 25th AIAA/CEAS Aeroacoustics Conference, May 2019, https://doi.org/10.2514/6.2019-2426
-
P. V. Pisarev and K. A. Akhunzianova, “Experimental study of the cells interaction on linear and nonlinear operating modes,” in IOP Conference Series: Materials Science and Engineering, Vol. 754, No. 1, p. 012001, Jan. 2020, https://doi.org/10.1088/1757-899x/754/1/012001
-
P. A. Moshkov, M. N. Ostroumov, and D. D. Davydov, “Creation of an “interferometer” installation at MAI to study the acoustic characteristics of sound-absorbing materials and structures,” (in Russian), in International Conference Dynamics and Vibroacoustics of Machines, pp. 137–139, 2024.
-
“Acoustics. Determination of acoustic properties in impedance tubes. Part 2: Two-microphone technique for normal sound absorption coefficient and normal surface impedance,” ISO 10534-2:2023, 2023.
-
“Standard test method for impedance and absorption of acoustical materials using a tube, two microphones and a digital frequency analysis system,” ASTM E1050-24, 2024.
About this article

The authors express their gratitude to “ORPE Technologiya named after A.G. Romashin” for providing samples of fiberglass honeycomb core for testing on an interferometer type installation of MAI.
The datasets generated during and/or analyzed during the current study are available from the corresponding author on reasonable request.
Petr Moshkov: conceptualization, writing-review and editing. Maxim Ostroumov: investigation, data curation, writing-original draft preparation. Alexey Korneychuk: formal analysis, writing-original draft preparation.
The authors declare that they have no conflict of interest.
