Abstract
The double-layer forced synchronous circular vibrating screen (DLFSCVS) is one of the most effective solutions for material screening. In this paper, a dynamic model was established to control the vibration of the screen, and the vibration characteristics of DLFSCVS are obtained by vibration experiment and parameter analysis. The classification performance of DLFSCVS was studied by EDEM, and the screening mechanism of DLFSCVS was revealed. The results show that the established dynamic model can describe the vibration of DLFSCVS well, and the maximum deviation between the experimental results and the theoretical results was within 4.78 %. The trajectory of the screen box is approximately circular. When the vibration frequency is 14 Hz, the acceleration amplitude of the screen box in the and axis directions is 34.7 and 35.2 m/s2, respectively. With the increase of vibration frequency, the displacement amplitude of the screen box is basically unchanged, and the velocity and acceleration amplitude increase gradually. The results showed that when 14 Hz, the screening efficiency of the upper and lower screen plates up to 0.87 and 0.93, respectively.
1. Introduction
Screening operation is widely used in mining, metal, coal, chemical and other industries [1-3]. Granular substances are a fundamental form in nature and are also the most common form of products in various industries [4, 5]. Granular materials are the raw materials for many industrial products, and screening is an industrial method used for classifying and grading raw materials to meet the requirements of industrial material processing [6]. At present, the classification technology based on the size, density and shape of materials is widely used [7]. There are various factors affecting the screening operation, including the amplitude, frequency of the screening equipment, the opening rate of the sieve plate, and the motion form [8, 9]. According to the movement trajectory of the screen plate, vibrating screens can be classified into linear vibrating screens, elliptical vibrating screens and circular vibrating screens.[10].
So far, many researchers have conducted extensive research on the vibration characteristics of vibrating screens. In order to improve the dehydration performance. Fang [11] studied and analyzed the dynamic characteristics of the vibrating screen. Jiang [12] showed through research that the operation of ordinary shaker in the far resonance region is conducive to the stability of the system. Baragetti [13] proposed an innovative design strategy to verify the motion performance and structural load optimization of heavy-duty shakers through full-scale experimental tests. Jiang [9] proposed a new type of double-axis excited large vibrating screen, and studied its kinematic characteristics and particle motion behavior under different working conditions. Li [14] studied the vibration of the flip-flow screen through theory and experiment, and the experimental results can be fully described by theoretical models. Jiang [15] studied the vibration characteristics of the variable amplitude vibrating screen, analyzed the influence of several operating factors on the screening performance of coal materials, and obtained the vibration characteristics when the screening performance was optimal.
Discrete Element Method (DEM) is a numerical simulation approach used to solve problems involving discontinuous media, and it is widely applied in industries such as mining, metallurgy, and chemical engineering [16, 17]. Discrete element method can simulate the separation and mixing processes of granular materials, and is widely applied in the development of screening equipment and in the screening of materials [18-20]. DEM can simulate the mechanical and kinematic characteristics exhibited by a large number of particles under complex conditions [21]. Dong simulated the particles using DEM flow on the multi-layer screen plate of banana screen, and analyzed the screening results according to the distribution curve, which helped to better understand and control the screening process [22]. Harzanagh studied the effects of various design and operating variables on screening efficiency, and conducted simulations on screens with spherical and aspherical particles, revealing the predictive ability of DEM simulation [23]. By verifying the validity of the screening process of the DEM model, Zhao found that the spherical and non-spherical particle models had the same screening performance [24]. Chen used DEM to conduct numerical simulation of the screening process of elliptical vibrating screen, investigated the screening time and screening efficiency, and evaluated the screening performance [25]. These scholars and engineers apply (DEM) technology to optimize screening equipment. By simulating the screening process of particles, they can obtain some operating parameters of the screening equipment, providing certain technical references for the use and optimization of the equipment.
However, previous studies mainly focus on single-layer vibrating screen, and the vibration characteristics of double-layer circular vibrating screen have not been effectively demonstrated. Therefore, the vibration characteristics and screening performance of double-layer circular vibrating screen should be deeply analyzed. In this paper, a dynamic model of a double-layer circular vibrating screen is established. The vibration characteristics of the double-layer circular vibrating screen are tested experimentally, and the rationality of the dynamic model is verified by comparing with the vibration characteristics based on the dynamic model. The DEM model of double-layer circular vibrating screen is established, the screening process is discussed and the influence of vibration parameters on the screening performance is studied.
This research demonstrates its uniqueness in aspects such as the focused structure of the specific device, the verification of the high-precision model, the quantitative laws of vibration characteristics, the revelation of the efficient performance of the double-layer sieve plate, and the research logic of combining multiple methods. The research results are helpful to understand the dynamic characteristics and screening performance of the double-layer circular vibrating screen, and provide reference basis for efficient operation and optimization design about this type of vibrating screen.
2. Experiment
This section introduces the vibration test and the screening test setup for the DLFSCVS.
2.1. Experimental apparatus
The DLFSCVS is composed of drive motor, synchronization belt, eccentric vibration excitation system, screen box, buffer spring, and upper and lower screen plate, as shown in Fig. 1. The drive motor drives two sets of eccentric excitation systems through the synchronous belt to generate in-phase excitation force. The screen box is supported by damping spring and vibrates periodically under the action of exciting force. The inside of the screen is equipped with two layers of screen plate, and the effective screening area is 3600×8000. The upper and lower screen holes are square holes, the aperture size of the upper screen plate is 60 mm×60 mm, and the aperture size of the lower screen plate is 30mm×30mm.
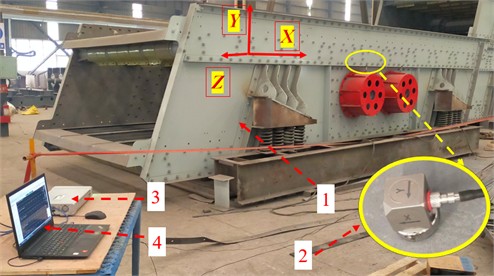
The dynamic characteristics test and analysis system, as shown in Fig. 2. The system mainly includes: 3680 vibrating screen, ICP three-way acceleration sensor, multi-channel signal acquisition instrument INV3060S, multi-channel signal real-time analysis software Coinv DASP. The ICP three-way acceleration sensor can simultaneously measure acceleration signals in three directions , and . INV3060S multi-channel signal acquisition instrument, with 16 data channels, integrated signal acquisition and amplification functions, can collect and analyze multi-channel signals in real time. Coinv DASP-V10 multi-channel signal real-time analysis software, which is installed on the computer with multi-module integration, can be used for real-time testing and analysis of acceleration signals collected by the INV3060S multi-channel signal acquisition instrument. The velocity and displacement signals can be obtained through the transformation of the acceleration signal waveform by the first integral and the second integral. By filtering the signal, time domain analysis, self-spectrum analysis and Lissajou analysis, the kinematics characteristics of displacement, velocity, acceleration amplitude, vibration frequency and space trajectory can be obtained.
Fig. 1Schematic illustration of the DLFSCVS: 1 – driving motor; 2 – synchronous belt; 3 – eccentric excitation systems; 4 – screen box; 5 – damping spring; 6 – upper screen plate; 7 – down screen plate. Photo by the authors, vibrating screen of Henan Zhenyuan Technology Co., Ltd., Xinxiang, Henan Province
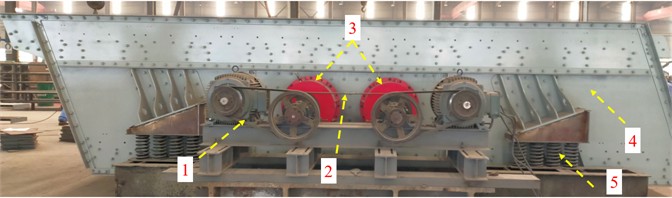
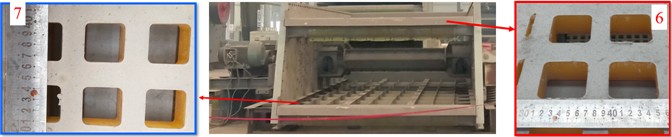
Fig. 2Dynamic experiment and analysis system of the DLFSCVS: 1 – 3680 vibrating screen (DLFSCVS), 2 – ICP acceleration sensor, 3 – INV3060S, 4. Coinv DASP. Photo by the authors, vibrating screen of Henan Zhenyuan Technology Co., Ltd., Xinxiang, Henan Province
2.2. Materials
The actual process of screening is relatively complex. In order to facilitate the collection of particle data and realize the similar function of simulation and real screening, a simplified three-dimensional prototype of the vibrating screen was established, and the DEM simulation of the screening process was carried out, as shown in Fig. 3. The simplified 3D prototype model of the vibrating screen is composed of feed end, upper screen plate and lower screen plate. After the feed particles are screened, three kinds of products are formed. The coarse particles are discharged from the tail of the upper screen plate, the medium particles are discharged from the tail of the lower screen plate, and the fine particles are discharged from the bottom of the lower screen plate.
Fig. 3Screening process simulation diagram
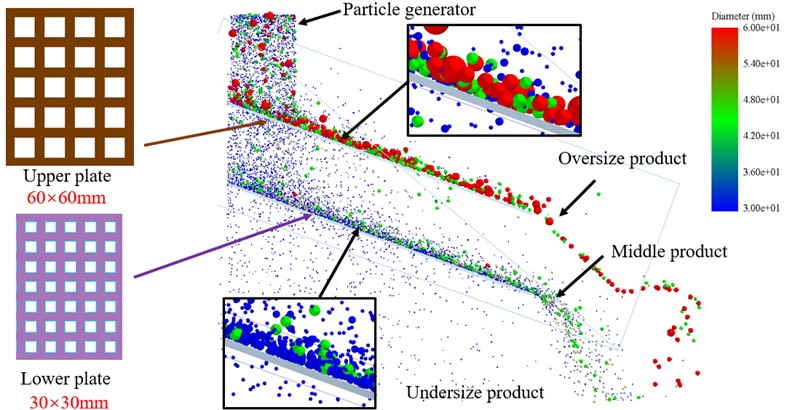
Table 1Geometric parameters and vibration conditions
Parameter | Value | |
Name of plate | Upper screen plates | Lower screen plates |
Length of screen deck (mm) | 4000 | 4000 |
Width of screen deck (mm) | 1800 | 1800 |
Aperture size (mm) | 60×60 | 30×30 |
Vibrational frequency (Hz) | 14 | |
Inclination angle of the screen (°) | 20 | |
Feed rate (kg/s) | 48 | |
Poisson’s ratio | 0.2 | |
Particle density (kg/m3) | 1100 | |
Particle size (mm) | 15, 30, 45, 60, 100 | |
Particle composition (%) | 30, 15, 18, 19, 18 | |
Table 2Collision coefficient parameters [26]
Parameters | Coefficient of restitution | Coefficient of static friction | Coefficient of rolling friction |
Particle-screen plate | 0.5 | 0.35 | 0.01 |
Particle-steel | 0.5 | 0.154 | 0.01 |
Particle-Particle | 0.5 | 0.35 | 0.01 |
The relevant parameters of the geometric model and granular materials of coal are shown in Table 1. In order to effectively simulate the screening condition of D-FSCVS3680 double-layer forced synchronous circular vibrating screen, the screen plate was reduced in equal proportion, and the width and length of the screen plate were set to 1800 and 4000 mm respectively. Set the hole of the upper screen plate to 60 mm×60 mm, and the hole of the lower screen plate to 30 mm×30 mm. As mentioned above, the screening performance of the vibrating screen mainly depends on the motion characteristics of the sieve plate and the feed amount, so the vibration frequency and feed amount parameters of the sieve plate can be adjusted, and the other factors remain unchanged in the subsequent test. Table 2 details the collision coefficients between particles, between particles and screen plates, and between particles and screen box walls, parameters which are of vital importance for ensuring that the model results are as close as possible to the actual situation.
2.3. Evaluation
Screening efficiency refers to the ratio of the mass of particles produced after screening that is smaller than the size of the sieve (actual screening mass) to the mass of particles in the feed particles that is smaller than the size of the sieve (theoretical screening mass). In this work, the percentage of particles smaller than the size of the screen in the feed end, coarse particle discharge end and fine particle discharge end is measured during the screening process. The sieving efficiency is calculated under the formula [9, 27]:
where represents the screening efficiency; indicates the proportion of particles in the feed material whose size is smaller than the sieve aperture size; represents the proportion of fine-grained particles whose size is smaller than the sieve aperture size; indicates the proportion of coarse-grained particles whose size is smaller than the sieve aperture size.
3. Results and discussion
This section will present the mathematical model of the DLFSCVS, followed by the description of the vibration experiment results, and finally the presentation of the screening experiment results.
3.1. Theoretical mechanics model
The dynamics model of the DLFSCVS is shown in Fig. 4. The direction is parallel to the upper and lower screen plates, and direction is perpendicular [28].
Fig. 4Dynamics model of the DLFSCVS
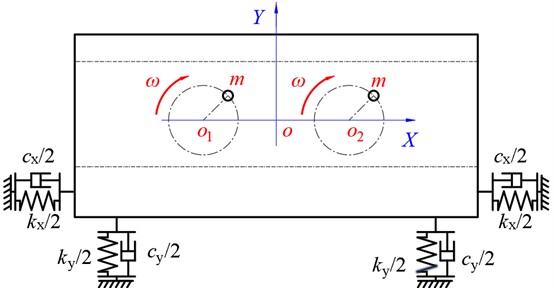
The rectangular box in the figure represents the vibrating screen. A Cartesian coordinate system - is established, with point being the reference point of the vibrating screen’s mass center. This system is used to describe the vibration displacement of the vibrating screen in the plane (along the horizontal direction and vertical direction). Two small circles marked as m are eccentric mass blocks, which move in circular motion around their respective centers (the red arrows indicate the rotation direction). When the eccentric blocks rotate, they generate centrifugal inertial forces, and the horizontal and vertical components of these forces are the excitation sources that drive the vibrating screen to vibrate.
When the eccentric blocks rotate, the exciting force is directional harmonic force. The exciting force in horizontal and vertical directions (, ) can be obtained through Eq. (2):
where, is the rotational speed of the vibration exciter; is the total excitation force. The total excitation force can be obtained as:
where, is the mass of the eccentric block and is the eccentricity.
The differential equations for the two degrees of freedom vibrating system are:
where, is the mass of the screen body; , , and are the displacement, velocity, acceleration of the screen body along -direction, respectively; , , and are the displacement, velocity, acceleration along -direction, respectively; , are the equivalent stiffness and damping coefficients of the springs along -direction, respectively; , are the equivalent stiffness and damping coefficients of the springs along -direction, respectively.
Assuming that the displacement has the following forms:
Taking derivative of to time , the velocity and acceleration can be calculated as:
Substituting Eqs. (5-7) into Eq. (4), the displacement amplitude (, ) and phase angle (, ) can be obtained:
The specific parameters and calculation results are presented in Table 3.
Table 3Parameter table
Symbol | Item | Value |
The total mass of screen body (kg) | 17430 | |
Total excitation force (N) | 600000 | |
Width of screen plate (mm) | 3600 | |
Length of screen plate (mm) | 8000 | |
Motor power (kW) | 2×55 | |
Rated motor speed (rpm) | 1450 | |
Reduction ratio of belt wheels | 1.726 | |
Angular velocity of the exciter (rad/s) | 88 | |
Springs stiffness along -direction (N/m) | 2,139,000 | |
Springs stiffness along -direction (N/m) | 3,056,000 | |
Damping coefficients along -direction (N∙s/m) | 21,390 | |
Damping coefficients along -direction (N∙s/m) | 30,560 |
3.2. Vibration test and kinematic characteristics
Displacement determines motion space, velocity determines energy transfer efficiency, and acceleration determines separation driving force. Together, these three factors constitute the complete physical picture of the operation of a vibrating screen: without displacement, the basic space for screening cannot be guaranteed; without velocity, the efficient flow of materials cannot be achieved; without acceleration, the separation of materials cannot be driven. Only by studying these three parameters simultaneously can the working mechanism of the vibrating screen be comprehensively understood, providing a scientific basis for equipment design, parameter optimization, and industrial application.
Fig. 5Time-domain characteristic curves of displacement signals
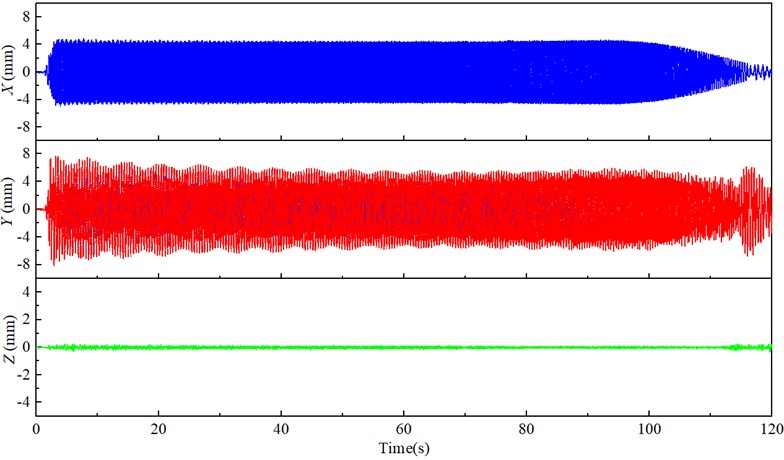
The time domain response curve of displacement obtained by dynamic experiment is shown in Fig. 5. The time domain response process of displacement can be divided into three different stages: starting stage, steady state operation stage and stopping stage, and the difference of displacement signals in each stage is obvious. It can be seen from the figure that the main vibration direction of the vibration system is axis and axis. The vibration in the -axis direction is relatively regular, and the displacement amplitude changes little. The vibration in the -axis direction is more complicated, and the displacement amplitude is obviously higher in the start and stop stage than in the steady-state operation stage. Compared with the vibrations along the -axis and -axis, the amplitude of the vibration along the -axis is very small and can be disregarded.
Fig. 6Time-domain characteristic curves of displacement signals in steady state
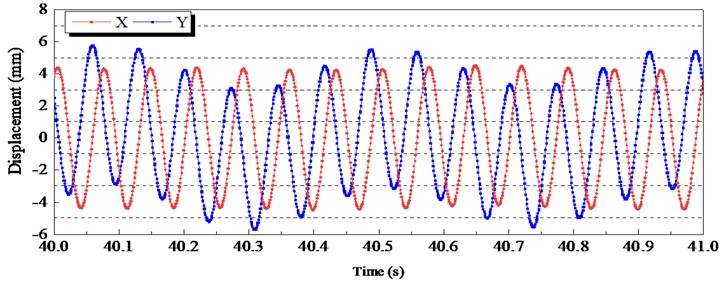
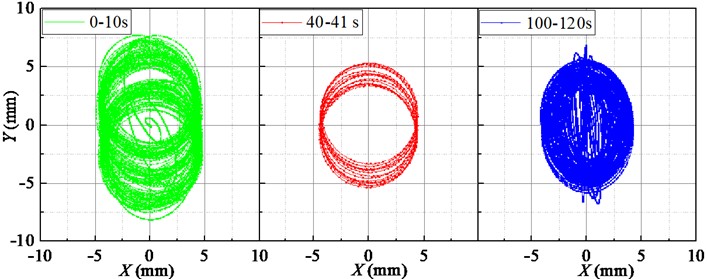
The time-domain response curve of displacement in the steady-state operation stage is shown in Fig. 6. In the steady-state operation stage, the displacement amplitude in the -axis direction is set at about 4.34 mm. The displacement amplitude in the -axis direction fluctuates greatly periodically, and the average displacement amplitude is about 4.38 mm. As can be seen from the Lissajous diagram of displacement in Fig. 7, the displacement trajectory of the screen body is relatively chaotic in the beginning and end stages, and roughly circular during the stable stage.
Fig. 7Lissajous diagram of displacement
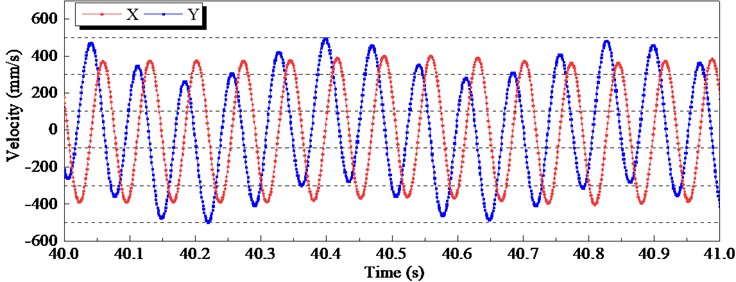
The time domain response of velocity is shown in Fig. 8. In the starting stage, the speed of the drive motor is gradually increased from 0 to 1450 r/min, and the vibration frequency of the screen body is gradually increased from 0 to 14 Hz. In this process, when the speed of the drive motor passes near the natural frequency of the screen body, the velocity amplitude increases significantly. The maximum velocity amplitude in the direction reaches 431 mm/s, and the maximum velocity amplitude in the direction reaches 630 mm/s, which is significantly greater than the working velocity amplitude. In the shutdown phase, the velocity amplitude in the direction slowly decreases, and the velocity amplitude in the Y direction slowly decreases first, and there will be a drastic change in the velocity amplitude before the complete stop. In the steady-state operation stage, the velocity time-domain response curve is shown in Fig. 9. In the steady-state operation stage, the average velocity amplitude in the -axis direction is stable at about 383.5 mm/s. The velocity amplitude in the -axis direction changes periodically, and the average velocity amplitude is about 387.2 mm/s.
In addition, due to the relatively high vibration frequency of the sieve body, acceleration is considered to be an important index of the vibration intensity. Fig. 10 shows the time domain response curve of acceleration along and directions. In the start-up stage, the acceleration amplitudes in and directions quickly reached stable values, with almost no abrupt change. During the shutdown phase, the acceleration amplitude in the and directions gradually decreases.
Fig. 8Time domain response curves of velocity about the screen body
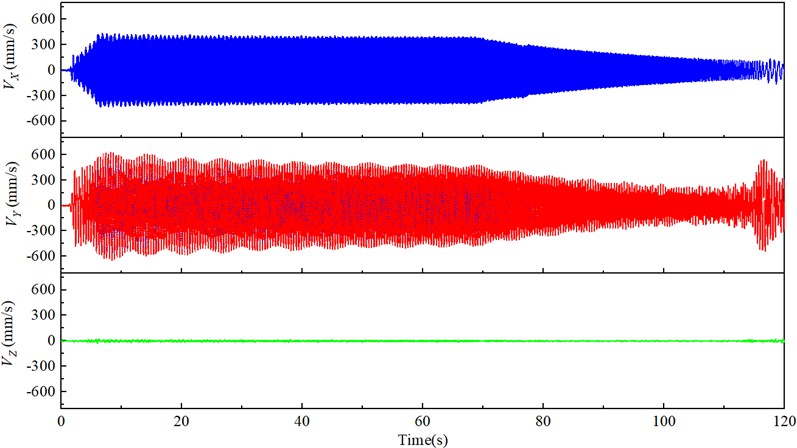
Fig. 9Time-domain characteristic curves of velocity signals
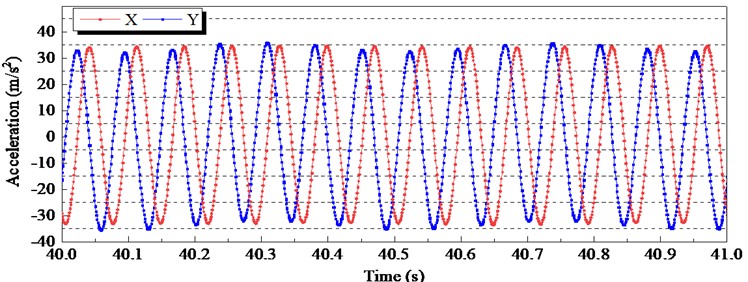
In the steady-state operation stage, the time-domain response curve of acceleration is shown in Fig. 11. In the stable working stage, the average acceleration amplitude of the screen body in the direction is close to 34.37 m/s2, and the average acceleration amplitude in the direction is close to 33.89 m/s2. The acceleration signal is stable on the whole.
Table 4Comparison between theoretical and experimental results
Parameters | Theoretical results | Experimental results | Error (%) |
(mm) | 4.48 | 4.34 | 3.56 |
(mm) | 4.55 | 4.38 | 4.78 |
(mm/s) | 394.2 | 383.5 | 2.71 |
(mm/s) | 400.5 | 387.2 | 3.32 |
(m/s2) | 34.7 | 34.37 | 0.84 |
(m/s2) | 35.2 | 33.89 | 3.76 |
Table 4 shows the comparison between the motion characteristics based on theoretical calculation and dynamic experiment test, including the average value of displacement amplitude, velocity amplitude and acceleration amplitude during the stable operation period. It can be seen that the theoretical calculation agrees well with the experimental results. The maximum relative error is only 4.78 %. The results show that the theoretical model has high reliability and accuracy.
Fig. 10Time domain response curves of acceleration about the screen body
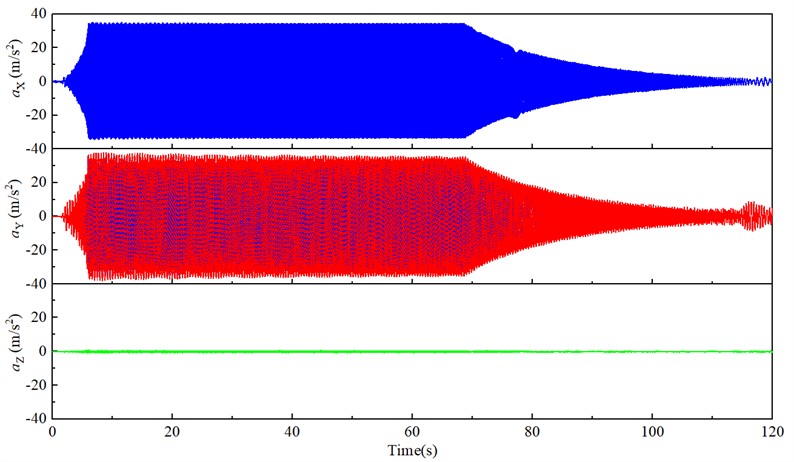
Fig. 11Time-domain characteristic curves of acceleration signals
3.3. Sieving process
The parameters for the particle setting in the sieving experiment are shown in Table 2. The vibration parameters of the sieve body are set according to the calculation results in Table 4. The amplitude is set at 14 Hz, and the displacement amplitudes in the / directions are both set at 4.5 mm, corresponding to a velocity amplitude and acceleration amplitude of 394.2 mm/s and 34.7 m/s2 respectively.
Fig. 12 is a snapshot of spherical coal particles in the EDEM simulation screening process, as shown in Fig. 12(a), at the beginning of screening, spherical coal particles are continuously generated in the “particle factory” at the feed end. The particle is set at the initial speed of 1 m/s, and the particle falls under the action of the initial speed and gravity, falls on the feeding baffle, then sent to the screen plate. With the screening process, the combination of the vibration of the screen plate and the tilt angle of the screen plate causes the particles to move along the length of the screen plate. As shown in Fig. 12(b), at 2 s of sieving, particles fill the entire screen plate. As shown in Fig. 12(c), when the screening is carried out to 4s, the large particles and some remaining small particles are transported to the discharge end to form the material on the screen. As shown in Fig. 12(d), when the screening is carried out for 8s, the particle mass in each region begins to be stable, and the screening reaches a stable stage, and stable screening efficiency can be obtained in a stable screening stage.
Fig. 12Sieving process
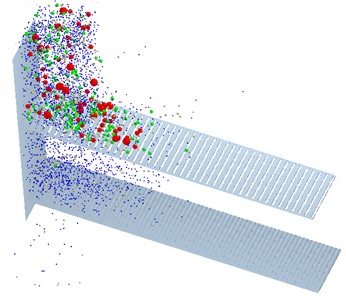
a)1 s
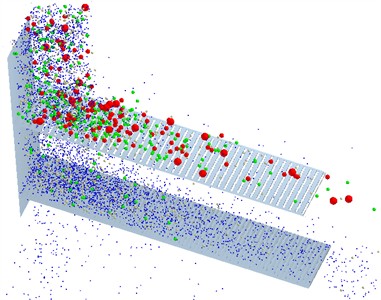
b) 2 s
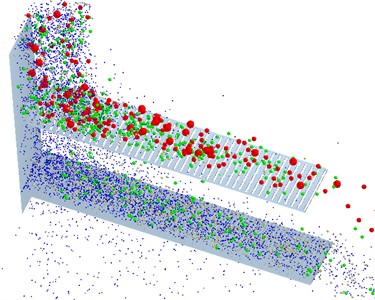
c) 4 s
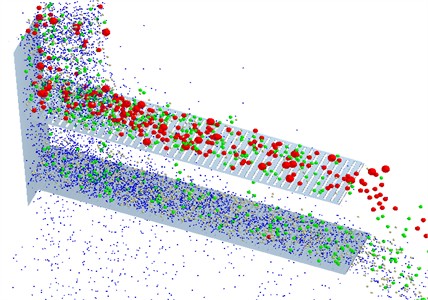
d)8 s
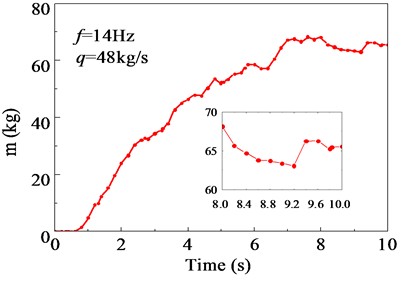
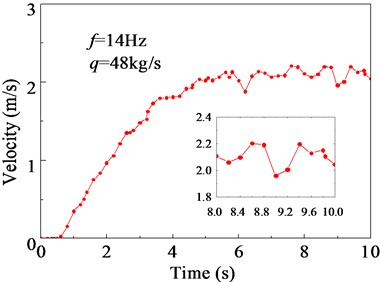
In the screening process, the material quality and average speed of the material area on the screen are shown in Fig. 13. As can be seen from Fig. 13(a), the quality of the material in this area gradually increases as the screening proceeds. When the screening is carried out to 7 s, the material quality in this area fluctuates up and down in a straight line, and the average value remains basically stable, indicating that the screening has reached a stable stage. As can be seen from Fig. 13(b), with the progress of screening, the average velocity of materials in this region gradually increased, and after 7 s, the average velocity of materials in this region basically remained stable at 2.2-2.3 m/s.
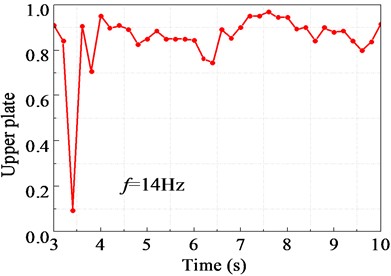
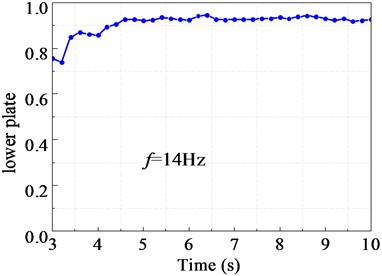
In the screening operation, feeding, sifting, conveying and discharging is a continuous dynamic process, and the screening efficiency changes dynamically with time. In the simulation process, dynamic statistical analysis was carried out on the content of fine particles under the sieve and on the sieve, so as to obtain the change rule of the screening efficiency over time, and the results were shown in Fig. 14.
Fig. 14(a) shows the change of screening efficiency of the upper screen plate. It can be seen that when the screening process does not reach a stable state, the screening efficiency changes greatly. With the progress of the screening process, the output of the material on the screen gradually increased, and the screening efficiency gradually reached a stable state. The overall screening efficiency of the upper screen plate is stable at about 0.87. Fig. 14(b) shows the change of screening efficiency of the lower screen plate. The overall screening efficiency of the lower screen plate is less than that of the upper screen plate after the screening efficiency of the upper screen plate is stabilized, and the overall screening efficiency of the upper screen plate is stable at about 0.93. The results showed that the screening performance of the DLFSCVS was good and efficient.
Fig. 13The mass and velocity of particles on the upper surface versus time
a)
b)
Fig. 14Screening efficiency curve
a)
b)
4. Conclusions
1) The mechanical structure of a double-layer forced synchronous circular vibrating screen (DLFSCVS) was described and the dynamic theoretical model was established. The vibration law of the screen body was obtained, and the motion trajectory of the screen body was obtained as well. The motion trajectory was approximately circular.
2) The experimental test dynamic characteristics of the DLFSCVS screen body including displacement, velocity and acceleration were compared with the theoretical results. The maximum error between the experimental results and the theoretical results is very small, only 4.78 %.
3) The screening performance of DLFSCVS was studied by using EDEM, and the screening mechanism of DLFSCVS was revealed. The screening results show that the screening efficiency of the upper and lower screen plates are as high as 0.87 and 0.93 respectively, and the screening effect is superior.
References
-
H. Li, Y. Li, F. Gao, Z. Zhao, and L. Xu, “CFD-DEM simulation of material motion in air-and-screen cleaning device,” Computers and Electronics in Agriculture, Vol. 88, pp. 111–119, Oct. 2012, https://doi.org/10.1016/j.compag.2012.07.006
-
V. Gursky, I. Kuzio, P. Krot, and R. Zimroz, “Energy-saving inertial drive for dual-frequency excitation of vibrating machines,” Energies, Vol. 14, No. 1, p. 71, Dec. 2020, https://doi.org/10.3390/en14010071
-
B. K. Shanmugam, H. Vardhan, M. G. Raj, M. Kaza, R. Sah, and H. Hanumanthappa, “Experimentation and statistical prediction of screening performance of coal with different moisture content in the vibrating screen,” International Journal of Coal Preparation and Utilization, Vol. 42, No. 6, pp. 1804–1817, Jun. 2022, https://doi.org/10.1080/19392699.2020.1767606
-
L.-L. Zhao, Y.-W. Li, X.-D. Yang, Y. Jiao, and Q.-F. Hou, “DEM study of size segregation of wet particles under vertical vibration,” Advanced Powder Technology, Vol. 30, No. 7, pp. 1386–1399, Jul. 2019, https://doi.org/10.1016/j.apt.2019.04.019
-
R. Maione, S. Kiesgen de Richter, G. Mauviel, and G. Wild, “DEM investigation of granular flow and binary mixture segregation in a rotating tumbler: Influence of particle shape and internal baffles,” Powder Technology, Vol. 286, pp. 732–739, Dec. 2015, https://doi.org/10.1016/j.powtec.2015.09.011
-
O. Ogunmodimu, I. Govender, A. N. Mainza, and J.-P. Franzidis, “Development of a mechanistic model of granular flow on vibrating screens,” Minerals Engineering, Vol. 163, p. 106771, Mar. 2021, https://doi.org/10.1016/j.mineng.2020.106771
-
K. Dong, A. H. Esfandiary, and A. B. Yu, “Discrete particle simulation of particle flow and separation on a vibrating screen: Effect of aperture shape,” (in English), Powder Technology, Vol. 314, pp. 195–202, Jun. 2017, https://doi.org/10.1016/j.powtec.2016.11.004
-
L. Huang et al., “Kinematic characteristics of banana screen surface and operational parameter optimization for coal classification,” International Journal of Coal Preparation and Utilization, Vol. 42, No. 5, pp. 1373–1392, May 2022, https://doi.org/10.1080/19392699.2020.1713767
-
H. Jiang et al., “Kinematics of variable-amplitude screen and analysis of particle behavior during the process of coal screening,” Powder Technology, Vol. 306, pp. 88–95, Jan. 2017, https://doi.org/10.1016/j.powtec.2016.10.076
-
H. Dong, C. Liu, Y. Zhao, and L. Zhao, “Influence of vibration mode on the screening process,” International Journal of Mining Science and Technology, Vol. 23, No. 1, pp. 95–98, 2013, https://doi.org/10.1016/j.ijmst.2013.01.014
-
P. Fang et al., “Synchronous state of unbalanced rotors in a three-dimensional space and far-resonance system,” (in English), Proceedings of the Institution of Mechanical Engineers, Part E: Journal of Process Mechanical Engineering, Vol. 234, No. 1, pp. 108–122, Nov. 2019, https://doi.org/10.1177/0954408919889416
-
Y.-Z. Jiang, K.-F. He, Y.-L. Dong, D.-L. Yang, and W. Sun, “Influence of load weight on dynamic response of vibrating screen,” (in English), Shock and Vibration, Vol. 2019, No. 1, Apr. 2019, https://doi.org/10.1155/2019/4232730
-
S. Baragetti and F. Villa, “A dynamic optimization theoretical method for heavy loaded vibrating screens,” (in English), Nonlinear Dynamics, Vol. 78, No. 1, pp. 609–627, Jun. 2014, https://doi.org/10.1007/s11071-014-1464-4
-
H. Li, C. Liu, L. Shen, L. Zhao, and S. Li, “Kinematics characteristics of the flip-flow screen with a crankshaft-link structure and screening analysis for moist coal,” Powder Technology, Vol. 394, pp. 326–335, Dec. 2021, https://doi.org/10.1016/j.powtec.2021.08.042
-
H. Jiang et al., “Process analysis and operational parameter optimization of a variable amplitude screen for coal classification,” Fuel, Vol. 194, pp. 329–338, Apr. 2017, https://doi.org/10.1016/j.fuel.2016.12.091
-
J. Horabik and M. Molenda, “Parameters and contact models for DEM simulations of agricultural granular materials: A review,” Biosystems Engineering, Vol. 147, pp. 206–225, Jul. 2016, https://doi.org/10.1016/j.biosystemseng.2016.02.017
-
N. G. Deen, M. van Sint Annaland, M. A. van der Hoef, and J. A. M. Kuipers, “Review of discrete particle modeling of fluidized beds,” Chemical Engineering Science, Vol. 62, No. 1-2, pp. 28–44, Jan. 2007, https://doi.org/10.1016/j.ces.2006.08.014
-
C. G. Sales and R. Galery, “Comparative evaluation of three classical sizing methods of vibrating screens,” REM – International Engineering Journal, Vol. 75, No. 1, pp. 37–44, Mar. 2022, https://doi.org/10.1590/0370-44672019750169
-
X.-D. Yang et al., “DEM study of particles flow on an industrial-scale roller screen,” Advanced Powder Technology, Vol. 31, No. 11, pp. 4445–4456, Nov. 2020, https://doi.org/10.1016/j.apt.2020.09.020
-
H. Khoshdast, H. Khoshdast, and S. Jalilifard, “Dynamic analysis of a dashpots equipped vibrating screen using finite element method,” Physicochemical Problems of Mineral Processing, Vol. 57, No. 1, pp. 112–126, Nov. 2020, https://doi.org/10.37190/ppmp/130001
-
V. Vivacqua, A. López, R. Hammond, and M. Ghadiri, “DEM analysis of the effect of particle shape, cohesion and strain rate on powder rheometry,” Powder Technology, Vol. 342, pp. 653–663, Jan. 2019, https://doi.org/10.1016/j.powtec.2018.10.034
-
K. J. Dong, A. B. Yu, and I. Brake, “DEM simulation of particle flow on a multi-deck banana screen,” Minerals Engineering, Vol. 22, No. 11, pp. 910–920, Oct. 2009, https://doi.org/10.1016/j.mineng.2009.03.021
-
A. Aghlmandi Harzanagh, E. C. Orhan, and S. L. Ergun, “Discrete element modelling of vibrating screens,” Minerals Engineering, Vol. 121, pp. 107–121, Jun. 2018, https://doi.org/10.1016/j.mineng.2018.03.010
-
L. Zhao, Y. Zhao, C. Bao, Q. Hou, and A. Yu, “Laboratory-scale validation of a DEM model of screening processes with circular vibration,” Powder Technology, Vol. 303, pp. 269–277, Dec. 2016, https://doi.org/10.1016/j.powtec.2016.09.034
-
Z. Chen, X. Tong, and Z. Li, “Numerical investigation on the sieving performance of elliptical vibrating screen,” Processes, Vol. 8, No. 9, p. 1151, Sep. 2020, https://doi.org/10.3390/pr8091151
-
G. Zhao, K. Pu, N. Xu, S. Gong, and X. Wang, “Simulation of particles motion on a double vibrating flip-flow screen surface based on FEM and DEM coupling,” Powder Technology, Vol. 421, p. 118422, May 2023, https://doi.org/10.1016/j.powtec.2023.118422
-
H. Jiang et al., “Kinematics characteristics of the vibrating screen with rigid-flexible screen rod and the behavior of moist coal particles during the dry deep screening process,” (in English), Powder Technology, Vol. 319, pp. 92–101, Sep. 2017, https://doi.org/10.1016/j.powtec.2017.06.036
-
Z. Yin, H. Zhang, and T. Han, “Simulation of particle flow on an elliptical vibrating screen using the discrete element method,” in Powder Technology, Vol. 302, pp. 443–454, Nov. 2016, https://doi.org/10.1016/j.powtec.2016.08.061.
About this article

This work is financially supported by the Doctoral Scientific Research Foundation of Suzhou University (2023BSK009, 2023BSK016), Key Research and Development Program Projects in Anhui Province (grant number 2023t070200), Key Project of Natural Science Research in Universities of Anhui Province (grant number 2022AH051380).
The datasets generated during and/or analyzed during the current study are available from the corresponding author on reasonable request.
Hongxi Li: conceptualization, methodology, writing-original draft, writing-review and editing, investigation. Enhui Zhou: resources, formal analysis, supervision. Haishen Jiang: validation, investigation. Ling Shen: writing-review and editing. Zixin Yin: software, funding.
The authors declare that they have no conflict of interest.

