Abstract
The existing quantitative (such as fractal dimension) methods for the dynamic performance of magnetorheological (MR) damping systems have problems in predicting damping efficiency due to the small sample size, overfitting risk, poor generalization and robustness, and difficulty in meeting industrial reliability requirements. In order to improve the prediction accuracy of damping efficiency in MR damping systems, ensure the reliability of prediction results for small sample datasets, this study first calculates five entropy indices – Approximate Entropy (ApEn), Sample Entropy (SampEn), Permutation Entropy (PermEn), Fuzzy Entropy (FuzzyEn), and Shannon Entropy (ShannonEn) – of the system’s time series under different operating states. These indicators are used to accurately evaluate the dynamic performance of the system and determine parameters that quantify its dynamic quality. Taking damping efficiency as the prediction objective, each entropy index is treated as a single input parameter, and a cross validation generalized regression neural network (GRNN) model is adopted to select the optimal entropy calculation parameter from the comprehensive score evaluation prediction results. On this basis, the entropy feature vector was reconstructed, and a reconstruction entropy feature prediction algorithm based on GRNN and balance criterion was established. The performance of the model was compared with existing prediction algorithms, and the performance of the optimal combination was verified. The industrial environment was simulated, and the industrial application prospects of the model were evaluated. Key findings indicate that: The preferred single entropy parameter using GRNN can achieve a prediction accuracy of 99 %, which is suitable for quantifying the dynamic quality of the system. Among all single entropy parameters, approximate entropy(ApEn) exhibits the highest prediction accuracy; The comprehensive scoring method based on GRNN Gaussian kernel selects the optimal parameter scheme for single entropy calculation; The reconstructed entropy feature vector was used to select the optimal entropy feature combination scheme for damping efficiency prediction based on GRNN inverse multiple quadratic (IMQ)-kernel and balance criterion; The combination of “ApEn+FuzzyEn” GRNN IMQ-kernel and balance criterion not only achieves better prediction accuracy than existing VMD-box dimension-GRNN, Long Short-Term Memory (LSTM), Random Forest (RF), and Support Vector Machine (SVM), but also demonstrates good generalization, robustness and reliability, as well as stable performance under different SNR noises. The relevant algorithms have also achieved good prediction accuracy and generalization in other datasets. This research model algorithm breaks through the accuracy bottleneck of traditional fractal dimension methods and provides an efficient, stable, and reliable prediction solution for small sample datasets. Its industrial application prospects are broad.
Highlights
- A cross-validated GRNN G-kernel model optimizes single entropy parameters (ApEn/FuzzyEn/SampEn/PermEn/ShannonEn) via a comprehensive score.
- The "ApEn+FuzzyEn" feature combination with GRNN IMQ-kernel and balance criterion outperforms VMD-box dimension-GRNN, LSTM, RF, and SVM, delivering superior accuracy (min MAPE=0.264%) and generalization.
- The proposed algorithm exhibits strong anti-interference (accuracy reduction <6% at SNR=20dB) and real-time performance, demonstrating broad industrial application prospects for small-sample vibration system state prediction.
- Validated on a probability screen vibration dataset, the entropy reconstruction-GRNN method maintains high accuracy (98.98%) and generalization, confirming its versatility across vibration-related industrial scenarios.
1. Introduction
The damper is developed using magnetorheological (MR) fluid with controllable and variable properties. This MR damping system is widely used in key fields such as anti vibration of building structures (such as wind vibration control of high-rise buildings), vibration reduction of rail transit (such as damping adjustment of train bogies), and protection of military equipment (such as impact buffering of armored vehicles). Accurate damping efficiency prediction is crucial to ensure the reliability of equipment in these fields [1]. The beginning of MR materials is dating back to 1970’s, mainly for vibration damping. Researchers started early in the theoretical research of MR dampers, proposing various mechanical models such as Bingham and Herschel Bulkley, as well as algorithms such as ceiling damping, sliding mode variable structure, and intelligent control based on neural networks and fuzzy logic. Experimentally testing the performance of MR dampers under various operating conditions provides a basis for verifying and improving theoretical models [2-4]. An MR damping system was developed according to the working principle of the MR fluid. Xiaomei et al. [5, 6] conducted many studies on the dynamic model construction, calculation method of dynamic performance parameters, high-order spectrum characteristics of vibration testing time series, and fractal dimension of time series. For the damping system, they developed an accurate dynamic model, determined dynamic characteristic parameters, and analyzed dynamic performance, high-order spectrum characteristics and their corresponding relationship with the working state. By calculating the correlation and fractal dimensions of the vibration signal, the complexity of the system and its relationship with the working state are quantitatively analyzed, and the most suitable working conditions of the system is then determined [7]. Qingtang et al. [8] also used the damping efficiency as the prediction value, and adopted many signal processing methods, including the Fast Fourier Transform (FFT), Empirical Mode Decomposition (EMD), and Variational Mode Decomposition (VMD), as well as direct time series analysis, extracted AR model coefficients, and box dimensions. They considered the latter as the state feature parameters, and applied machine learning and classification methods, such as support vector machine (SVM), to predict the state, which allowed them to reach a high prediction accuracy. The generalized regression neural network (GRNN) is based on mathematical statistics, and it adopts a radial basis function as the activation function. It is widely used in many fields, such as engineering intelligent monitoring, fault diagnosis, state identification and prediction, parameter estimation, and decision analysis, yielding satisfactory results [9, 10]. The authors of [9] established four prediction algorithms to predict the damping efficiency of a the MR damping system: time series-GRNN, time series AR model coefficient-GRNN, time series box dimension-GRNN, and VMD-box dimension-GRNN. All these algorithms achieved satisfactory prediction results. The minimum prediction error of the VMD-box dimension-GRNN prediction algorithm reached 1.905 % [9].However, these methods only select optimal model parameters based on the sole criterion of minimizing prediction errors, lacking effective model evaluation standards. They fail to ensure robustness, generalization, and stability, resulting in unverified reliability of the outcomes. Additionally, these methods lack strong evidence regarding their practical industrial application prospects and feasibility. Entropy is a physical quantity of the degree of heat dissipation, which quantifies the degree of chaos of things or reflects the irregularity of system signals. It is widely used in the identification and prediction of system states [10, 11]. To the best of our knowledge, studies on the entropy characteristics of the damping system, and the state prediction of the MR damping system through the combination of entropy characteristics and GRNN, have not been reported yet.
To better evaluate the dynamic performance of MR damping systems and determine the parameters that quantify the dynamic quality of the system, the time series signals tested by the MR damping system under different states, the sample entropy (SampEn), approximate entropy(ApEn), permutation entropy (PermEn), fuzzy entropy (FuzzyEn), Shannon entropy (ShannonEn), box dimension, and correlation dimension of the time series are calculated for measuring the complexity of the time series. Considering the damping efficiency of the damping system as the prediction goal, these parameters are then used as a single input feature, and different combinations are formed as the state eigenvectors. In addition, a GRNN classification method is used to perform state prediction. Afterwards, the extraction method and prediction algorithm of the state parameters applicable to the system are studied to find the optimal combination scheme of prediction feature vectors. Finally, the prediction results are compared with those of the VMD-box dimension-GRNN prediction algorithm, Long Short-Term Memory (LSTM), Random Forest (RF), and SVM, the optimal parameters of the model were selected by evaluating its predictive performance and industrial application prospects.
2. Basic theory
2.1. Time series entropy
Entropy is a physical statistic used to measure the state of a material system. More precisely, it is the degree to which the system state may occur. It reflects the complexity of the time series [11, 12]. In general, the entropy of the time series includes SampEn, ApEn, PermEn, FuzzyEn, and ShannonEn. They can reflect the complexity or the irregularity of time series to varying degrees [13-15].
ApEn can describe the irregularity of time series. The larger its value, the more the time series is irregular [15, 16]. In general, the mode dimension () and similarity tolerance threshold () are the parameters that affect the ApEn of the time series, and is usually set to 2 or 3, while the value of is related to the standard deviation (std) of the time series. The literature [14] published by Pincus S. M. et al. suggests that when calculating ApEn, the value of is generally 2, and the range of is (0.1–0.2) std. SampEn is an improved method of ApEn. However, its value is less affected by the length of the time series, and the changes of the mode dimension () and similarity tolerance threshold () show high consistency [16]. The mode dimension() of SampEn can be 1 or 2, and the value range of is (0.1-0.25) std [16, 17]. The value of FuzzyEn is closely related to , , and the step (). In reference [19], it is mentioned that the embedding dimension of the FuzzyEn algorithm can be taken as 2 or 3, (0.1-0.25) std. In general, is set to 2 or 3.Similar to ApEn, SampEn, and FuzzyEn, PermEn is a parameter that quantifies the complexity of time series signals [18]. It also measures their random variation and reflects the regularity of their permutation [19]. ShannonEn of the time series is the change trend information that represents the state parameters in the time dimension [20].
2.2. GRNN
GRNN is a neural network based on mathematical statistics, using a radial basis function as the activation function. Its network structure comprises four layers: input, mode, summation, and output layers. It has a satisfactory prediction effect, especially when dealing with small samples. The main kernel functions of GRNN include the Gaussian kernel (G-kernel), the multiquadratic kernel (IMQ-kernel) and inverse multiple quadratic kernel (IMQ-kernel). The smoothness factor () or scale parameter () of the radial basis function is the main parameter affecting the prediction accuracy of the GRNN [9, 10].
3. Prediction algorithm
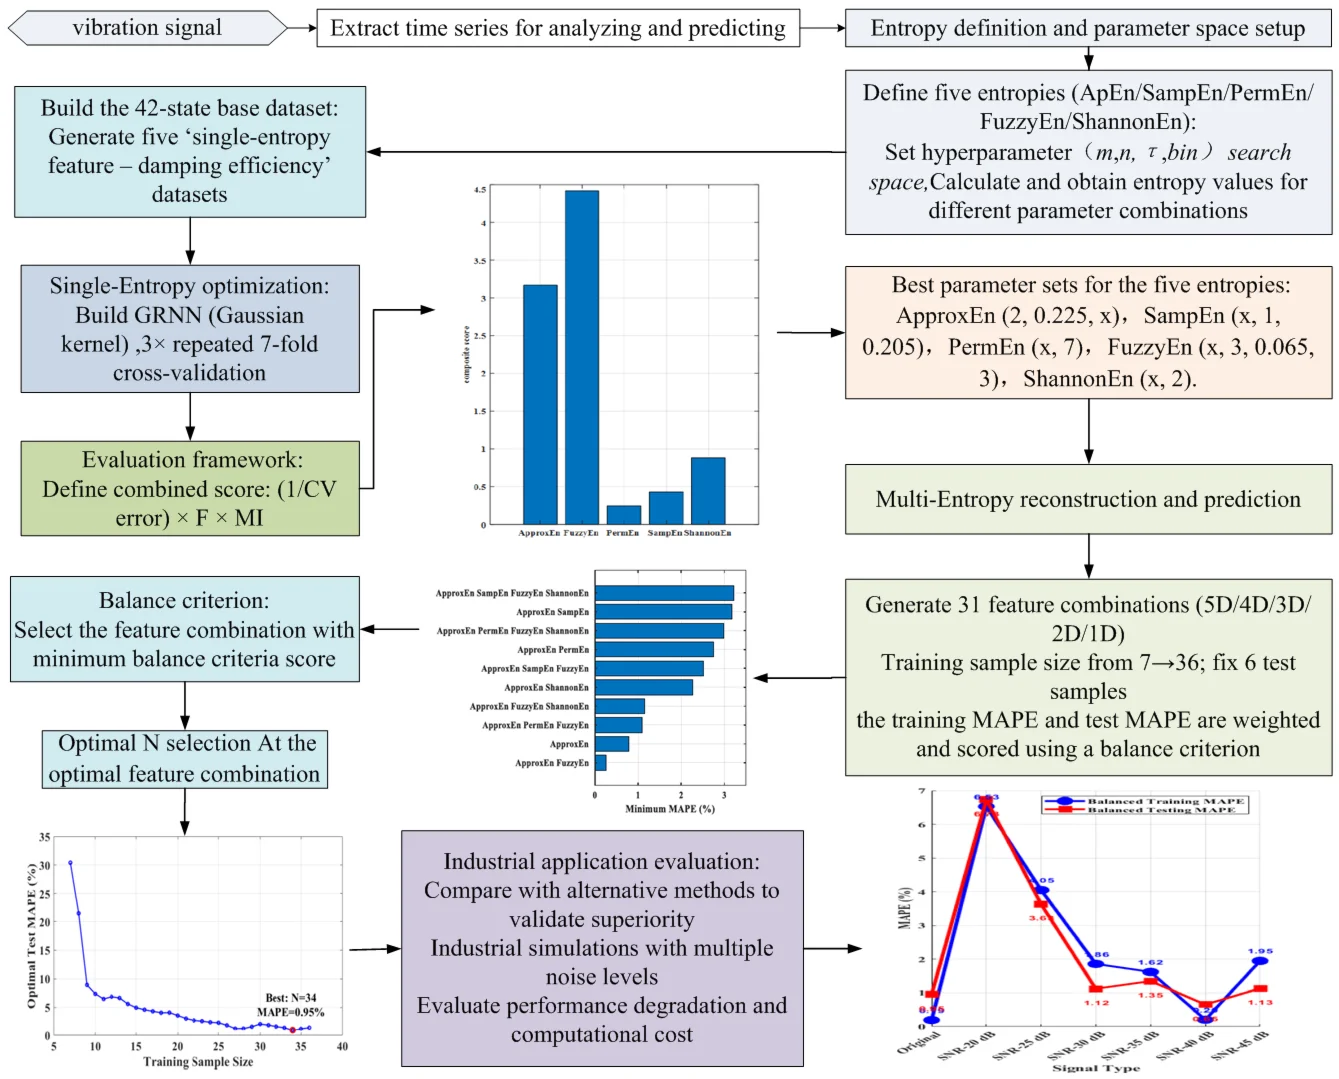
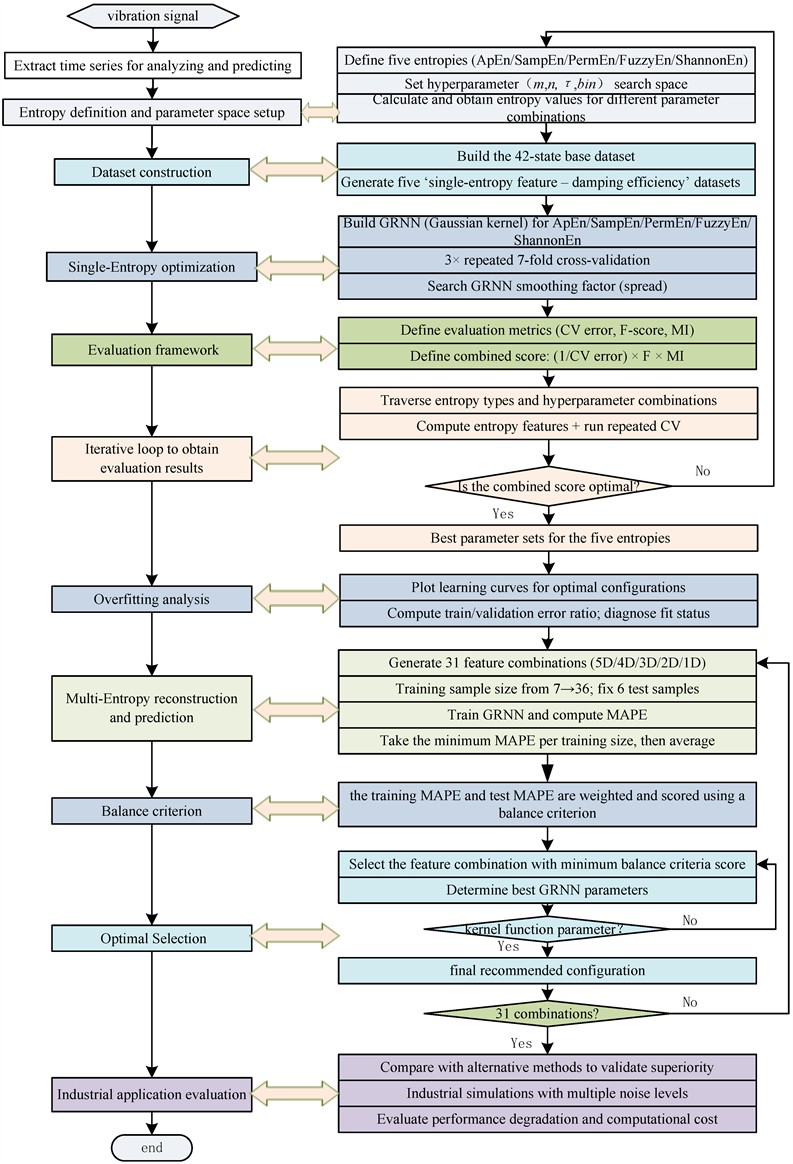
Based on the complexity characteristics reflected by each entropy value of the time series, the SampEn, ApEn, PermEn, FuzzyEn, and ShannonEn of the time series are proposed to represent the state. By looking for the entropy value of the best identification state, and using the GRNN model, the entropy feature reconstruction-GRNN prediction algorithm is developed. The main steps are summarized as follows:
(1) Entropy types and parameter space.
Define five candidate entropy features for time series: ApEn, SampEn, PermEn, FuzzyEn, and ShannonEn. For each entropy feature, specify parameter search spaces that match their characteristics: set the embedding dimension and tolerance ranges within reasonable intervals for ApEn, SampEn and FuzzyEn, define the fuzzy membership function parameter for FuzzyEn, and set the permutation order and delay for PermEn, as well as the number of bins for ShannonEn, ensuring the search spaces cover mainstream and reasonable value ranges.
(2) Dataset construction.
Construct a dataset containing 42 states by obtaining time series signals from vibration systems under different conditions. The entropy values calculated under different parameter combinations for the time series were used as single-feature predictors, taking vibration damping efficiency as the prediction target, and yielding in five datasets of single entropy features.
(3) Optimization of single Entropy parameters.
A GRNN with Gaussian kernel is used for a single entropy feature input dataset based on different parameter settings. Apply 7-fold cross-validation repeated three times and search for the smoothing factor (or scale parameter) of the GRNN kernel function within a specific range.
(4) Evaluation framework.
To alleviate overfitting and ensure the robustness of model parameter selection, three criteria were selected to evaluate each configuration: cross validation (CV) error, F-value, and mutual information (MI). The performance of the model is comprehensively evaluated through a comprehensive score defined as .
(5) Iterative loop to obtain evaluation results.
Traverse entropy types and their parameter combinations, calculate corresponding entropy features, run repeated 7-fold cross validation, collect performance indicators and learning curve data, and select the optimal parameter combination for each entropy based on the comprehensive score.
(6) Overfitting analysis.
Draw the learning curve for each optimal entropy configuration. By comparing the ratio of training error percentage to validation error percentage, the fitting status can be determined to prevent overfitting or underfitting.
(7) Multi-entropy reconstruction and prediction.
Reconstruct feature vectors from five optimized entropies to form 31 different combinations (including combinations of sizes 5, 4, 3, 2 and 1). For each combination, adjust the number of training samples from 7 to 36, fix the last 6 samples as the test set, and train the GRNN model within a reasonable spread range. Calculate the average absolute error percentage (MAPE) for predicting damping efficiency and the training damping efficiency.
(8) Balance criterion.
In order to comprehensively consider the stability and generalization of predictions, the training MAPE and test MAPE are weighted and scored using a balance criterion to obtain prediction results and balance criterion scores for different smoothing factor (or scale parameter) under different training sample sizes.
(9) Optimal combination and model parameter selection.
Select the optimal feature combination and GRNN parameters based on the balance criteria scores and prediction results and use them as the final recommended configuration.
(10) Performance and industrial evaluation.
Compare the GRNN prediction model with LSTM, RF, and SVM based on the optimal entropy feature combination and parameters to demonstrate its superiority. Simulate industrial application scenarios by incorporating multiple different noise levels to evaluate performance degradation and computational costs. Use these results to evaluate the feasibility and prospects of deploying entropy based reconstruction prediction frameworks in industrial environments.
The flowchart of the algorithm is shown in Fig. 1.
4. Sources of the experimental data
The experimental data are derived from those measured by the MR vibration and testing system developed by Yijian et al. [5, 6]. The test system is composed of MR damper, vibration test bench, sensor, excitation control module, and virtual instrument signal detection module. The magnetic field strength of the MR damper is changed by controlling the current.
Fig. 1Flowchart of the time series entropy feature reconstruction-GRNN prediction algorithm
In the test, the control current () values are set to 0, 0.5, 1, 1.5, 2, and 2.5 A, and the displacement and acceleration signals are detected for all these values. The eccentric wheel device is installed under the vibration test bench. The eccentric wheel is driven by the motor to generate resonance excitation. Under the control of the frequency converter, the drive motor generates different excitation drives by setting different input frequencies () of 20, 25, 30, 35, 40, 45, and 50 Hz. Six control currents and seven input frequencies constitute 42 test states. A total of 42 state time series signals are then detected [5, 6]. For the detected time series, the stable data segment is selected, and the SampEn, ApEn, PermEn, FuzzyEn, ShannonEn, box dimension, and correlation dimension of the time series signals are calculated for different working conditions.
5. Analysis of the prediction results
5.1. Single entropy feature prediction and computational parameter optimization
To find the optimal parameter combination scheme for calculating time series entropy and effectively capture the characteristics of time series, the scope is expanded to cover the complete interval of “low similarity threshold (capturing fine particle features) - high similarity threshold (capturing overall trend)” by 0.1-2.5 times the standard deviation of the coverage signal. Due to the standard deviation of the data for each sample in this experiment being 0.05-0.12, (0,…, 14) was selected for this study. The calculation parameters for five types of entropy are set as shown in Table 1.
Table 1Parameters range for entropy calculation and state prediction
Entropy | ApEn | SampEn | PermEn | FuzzyEn | ShannonEn |
1:1:3* | 1:1:3 | 3:1:7 | 1:1:3 | – | |
0.005:0.02:0.3 | 0.005:0.02:0.3 | – | 0.005:0.02:0.3 | – | |
– | – | – | 2:1:3 | – | |
Bin | – | – | – | – | 2:2:20 |
Spread | 0.0001:0.015:1.5 | 0.0001:0.015:1.5 | 0.0001:0.01:3 | 0.0001:0.01:1 | 0.0001:0.01:1 |
0.0001:0.015:1.5 | 0.0001:0.015:1.5 | 0.0001:0.01:3 | 0.0001:0.01:1 | 0.0001:0.01:1 | |
*“1:1:3”in Table 1 indicates a maximum of 3 from 1, with intervals of 1. And so on for others | |||||
The above entropy calculation parameters are combined to form 195 different combination schemes. Under different combination schemes, the entropy values of 42 state time series are obtained, and the individual entropy values of the 42 states under each combination scheme are combined with the damping efficiency to form a dataset. Using a 7-fold cross validation method, two different kernel functions, GRNN G-kernel and IMQ-kernel, were selected. The smoothing factor or scale parameter interval of the GRNN model kernel function was set for different entropy feature types (the final selected interval is listed in Table 2) to ensure the selection of parameter optimization schemes under good fitting conditions. Calculate three metrics: CV error, F-value, and MI between predicted and true values, to evaluate the prediction stability, robustness, and generalization of the model. A comprehensive score is obtained by weighted combination of these three metrics, which serves as the basis for assessing the superiority of parameter schemes. The fitting curves of cross-validation predictions using single entropy values, the highest comprehensive score, and the degree of fit are plotted in Fig. 2 and 3.
From the data analysis in Table 2, it can be seen that:
When using the GRNN G-kernel function, the highest comprehensive scores for the five entropy feature predictions are as follows: FuzzyEn (4.419) > ApproxEn (3.173) > ShannonEn (0.881) > SampEn (0.430) > PermEn (0.243). Among them, FuzzyEn performs the best and can obtain the highest comprehensive score; ApproxEn comes second, while PermEn has the lowest performance. When using GRNN IMQ-kernel function, the highest comprehensive score ranking of the five entropy feature predictions are as follows: SampEn (3.397) > ApproxEn (3.261) > FuzzyEn (1.206) > ShannonEn (0.707) > PermEn (0.229). Under IMQ-kernel function, the comprehensive score of SampEn is the highest, ApproxEn still ranks second, and PermEn remains the worst performing entropy feature.
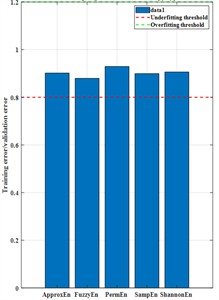
By adjusting the parameter range, the ratio of training error to validation error for both kernel functions remains stable within the range of 0.88-0.95 under the optimal parameter combination of entropy features. This result indicates that both kernel function configurations can achieve good model fitting performance and demonstrate excellent generalization ability, effectively avoiding overfitting or underfitting problems.
Comparison of the two kernels’ core metrics: in terms of mean CV error, the G-kernel is significantly lower than the IMQ-kernel; in terms of the overall composite score, the G-kernel likewise outperforms the IMQ-kernel. In summary, the GRNN with a G-kernel shows superior comprehensive performance on the single-entropy feature prediction task and is therefore chosen as the final hyperparameter selection scheme. The optimal parameter combinations for the single-entropy GRNN prediction model are as follows: ApproxEn (2, 0.225, x), SampEn (x, 1, 0.205), PermEn (x, 7), FuzzyEn (x, 3, 0.065, 3), ShannonEn (x, 2).
Fig. 2Learning curves of five entropies under the G-kernel at the optimal parameter combination
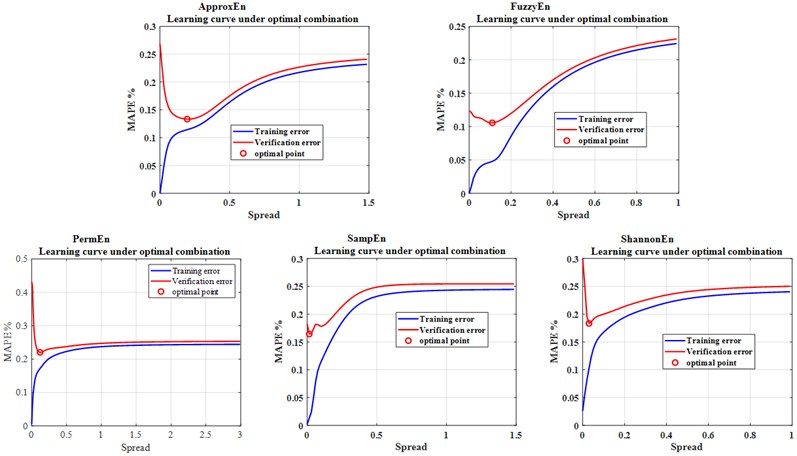
Fig. 3Single entropy value cross-validation predicts the optimal comprehensive score and its fitting coefficient
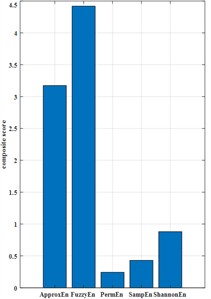
a) The optimal comprehensive score
b) Fitting coefficient
Table 2Comparison of prediction performance for the best parameter schemes of five entropies via cross-validation
Kernel function | Entropy | Parameter range spread or | F | MI | Comprehensive score | Training error / validation error | |
G-kernel | ApproxEn | 0.0001:0.015:1.5 | 0.1397 | 1.0000 | 0.4432 | 3.173 | 0.902 |
SampEn | 0.0001:0.015:1.5 | 0.1565 | 0.1597 | 0.4217 | 0.430 | 0.899 | |
PermEn | 0.0001:0.01:3 | 0.2329 | 0.2040 | 0.2775 | 0.243 | 0.929 | |
FuzzyEn | 0.0001:0.01:1 | 0.1171 | 1.0000 | 0.5176 | 4.419 | 0.879 | |
ShannonEn | 0.0001:0.01:1 | 0.1925 | 0.6250 | 0.2714 | 0.881 | 0.906 | |
IMQ-kernel | ApproxEn | 0.0001:0.015:1.5 | 0.1338 | 1.0000 | 0.4364 | 3.261 | 0.940 |
SampEn | 0.0001:0.015:1.5 | 0.1364 | 1.0000 | 0.4632 | 3.397 | 0.940 | |
PermEn | 0.0001:0.01:3 | 0.2590 | 0.2026 | 0.2924 | 0.229 | 0.950 | |
FuzzyEn | 0.0001:0.01:1 | 0.2143 | 0.7744 | 0.3338 | 1.206 | 0.931 | |
ShannonEn | 0.0001:0.01:1 | 0.2400 | 0.6250 | 0.2714 | 0.707 | 0.933 |
5.2. Prediction results after entropy feature vector reconstruction
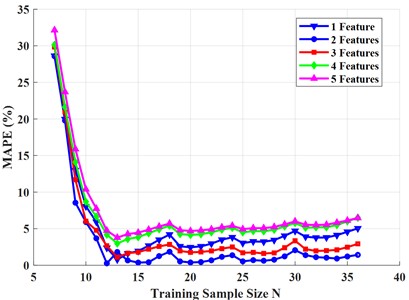
To determine the optimal feature combination scheme, based on the parameter optimization results of the five types of entropy values under different states mentioned above, under the optimal parameter conditions corresponding to each entropy value, the five types of entropy features were combined in different numbers – 1 (5 combinations in total), 2 (10 in total), 3 (10 in total), 4 (5 in total), and 5 (1 in total) – resulting in a total of 31 feature vector combinations. Each combination was then paired with the vibration reduction efficiency reconstruction dataset. To evaluate the predictive performance of each feature combination in the system, the last 6 samples of the dataset were fixed as the test set, and the number of training set samples gradually increased from 7 to 36. When predicting in the GRNN model, G-kernel and IMQ-kernel are also used to set the search range of parameters from 0.0001 to 3, with a step size of 0.001, in order to obtain the optimal model parameters for different feature combinations. Finally, the top 10 feature combination schemes with the best prediction performance were selected, and the optimal prediction results were analyzed. Fig. 4 shows the top 10 combination schemes and their corresponding minimum prediction errors under two kernel functions. Fig. 5 shows the trend of prediction error with the number of training samples under the optimal prediction scheme for different combinations.
Fig. 4The MAPEmin of the top 10 combinations
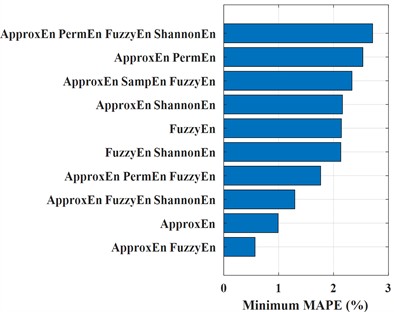
a) G-kernel
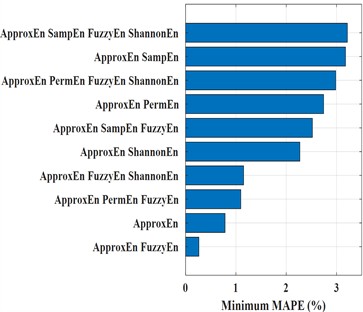
b) IMQ-kernel
Comparing and analyzing the prediction results of two GRNN kernel functions, it can be seen that the minimum MAPE of the top 10 different entropy feature combinations is less than 3.5 %, indicating that the entropy feature combination can achieve high prediction accuracy. The first two optimal entropy feature combinations with smaller prediction errors selected using different kernel functions are“ApEn+FuzzyEn”and“ApEn”, which are the two entropy combinations with higher comprehensive scores for single features. This indicates that the feature combination scheme can prioritize selecting the entropy with better single entropy prediction for combination, further verifying that the comprehensive scoring method of single entropy prediction is an effective method for evaluating prediction results and can serve as the main basis for selecting optimal entropy feature parameter combinations. However, the optimal results of the entropy feature combination of the two kernel functions are different, and the corresponding MAPE ranking of 3-10 combinations varies. The minimum MAPE of the top 10 combinations predicted by G-kernel is slightly lower than that predicted by IMQ-kernel, while the minimum prediction error of the “ApEn+FuzzyEn” combination (0.571 %) is higher than that predicted by IMQ-kernel (0.264 %). From the perspective of minimum MAPE, using IMQ-kernels can achieve higher prediction accuracy. Therefore, a combination of entropy features and model parameter optimization scheme have been preliminarily selected for the prediction model.
Fig. 5The trend of MAPEmin with different combinations of feature numbers changing with N
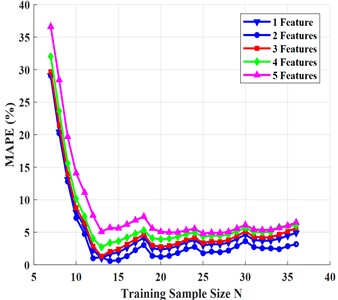
a) G-kernel
b) IMQ-kernel
5.3. Evaluation of model performance and industrial application prospects
To evaluate the performance of the entropy feature reconstruction prediction model for the system, firstly, the prediction performance of different GRNN kernel functions was compared under the optimal feature combination conditions to determine the most suitable kernel function; Subsequently, by extracting the prediction MAPE and training MAPE, the generalization and overfitting of the model are judged, and the optimal prediction results and model parameters suitable for the model are selected through the balance criterion; Finally, under the same conditions, the proposed GRNN model was compared with mainstream prediction methods such as LSTM, RF, SVM, and the VMD-box dimension-GRNN model proposed in reference [9], in order to verify the superiority of the entropy feature combination GRNN model in prediction accuracy and stability. The relevant prediction results (Fig. 6) and model parameters are summarized in Table 3.
From Table 3, it can be seen that when using the same GRNN model for prediction, the same feature combination (such as “ApEn+FuzzyEn”) has different minimum MAPE values corresponding to different kernel functions, and the generalization gap also varies greatly. This indicates that there are significant differences in predictive performance under different kernel functions.
The “ApEn+FuzzyEn” GRNN model proposed in this article has a minimum MAPE (0.264 % –0.715 %) lower than the minimum MAPE (1.905 %) of the VMD-box dimension-GRNN combination in reference [9] under three kernel functions, demonstrating its significant advantage in prediction accuracy. However, their corresponding generalization gaps (34 %-45 %) are generally large, indicating that the“ApEn+FuzzyEn”- GRNN model has a certain risk of overfitting and weak generalization ability. Therefore, it cannot be concluded from the perspective of minimum error that the combination of “ApEn+FuzzyEn” is superior to the VMD-box dimension feature combination in predicting vibration reduction efficiency.
Fig. 6GRNN-IMQ model prediction results
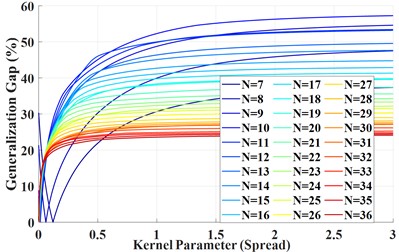
a) Curves of generalization gap with kernel parameters under different
b) Curve of testing MAPE -N based on balance criterion
Table 3Prediction results and model parameters of different prediction models
Feature parameter | Prediction model | Prediction results based on minimal error | Prediction results based on balance criteria | ||||||
(%) | Training samples number | Spread or | Generalization gap (%) | MAPE (%) | Spread or | Training samples number | Generalization gap (%) | ||
VMD-box dimension [9] | GRNN G-kernel | 1.905 | 33 | 0.601 | 18.56 | 3.04 | 0.243 | 34 | 13.46 |
VMD-box dimension | GRNN IMQ-kernel | 5.186 | 31 | 0.003 | 4.01 | 5.19 | 0.0001 | 31 | 0.49 |
ApEn +FuzzyEn | GRNN G-kernel | 0.497 | 14 | 0.882 | 40.11 | 0.798 | 0.812 | 15 | 36.96 |
GRNN IMQ-kernel | 0.264 | 12 | 0.474 | 45.21 | 0.95 | 0.0001 | 34 | 0.76 | |
GRNN MH-kernel | 0.715 | 14 | 1.435 | 34.79 | 4.26 | 0.0001 | 34 | 12.72 | |
LSTM | 3.581 | 34 | – | 11.36 | 3.71 | – | 34 | 3.81 | |
RF | 5.913 | 10 | – | 31.19 | 7.51 | – | 34 | 2.88 | |
SVM | 0.571 | 19 | – | 34.96 | 2.49 | – | 8 | 7.42 | |
To further evaluate the performance of the model, a balance criterion with a weight of 0.3 is introduced for re evaluation, in order to select the balanced optimal prediction result. The results showed that the prediction errors of each model increased under the balance criterion, but the generalization gap decreased to varying degrees with different kernel functions, reflecting that weakening the prediction accuracy to a certain extent contributes to the overall improvement of the model’s generalization ability. Among them, the GRNN-IMQ kernel function performs particularly well under the balance criterion, with its minimum error (0.95 %) and generalization gap (0.76 %) lower than other kernel functions, demonstrating excellent predictive stability and reliability. In summary, after optimizing the balance criterion, the combination of “ApEn+FuzzyEn” features not only has higher prediction accuracy than VMD-box dimension in most cases, but also has stronger generalization performance, making it more suitable for reliable prediction of vibration reduction efficiency.
By comparing our research model with three mainstream prediction methods, including LSTM, RF, SVM, etc., the minimum error, balanced optimal prediction error, and generalization gap of GRNN-IMQ prediction based on the “ApEn+FuzzyEn” entropy feature combination were found to be optimal. This validates the significant advantages of the model in terms of prediction accuracy and stability, making it suitable for high-precision and high stability prediction tasks and having strong practical application value.
To evaluate the industrial application potential of the proposed model, this study simulates common random interference in industrial environments by superimposing Gaussian white noise with different Signal to Noise Ratio (SNR) levels of 20-45 dB on the original input signal. On this basis, the optimal parameter combination determined by previous optimization is adopted, and the GRNN-IMQ model is used for prediction. The system characterizes its environmental adaptability under different levels of noise interference by quantifying the percentage decrease in model prediction accuracy after adding noise (as shown in Fig. 7). At the same time, in order to further match the core demand for real-time performance in industrial scenarios, this study introduces the model operating efficiency index - by accurately calculating entropy parameters and the actual machine time consumption of GRNN prediction algorithm, analyzing the model’s satisfaction with real-time response requirements in industrial applications from the perspective of computational efficiency, and ultimately providing multi-dimensional (anti-interference, real-time) application references for the feasibility of industrial implementation of the model.
Fig. 7Changes in the prediction performance of balance criteria under different SNR noises
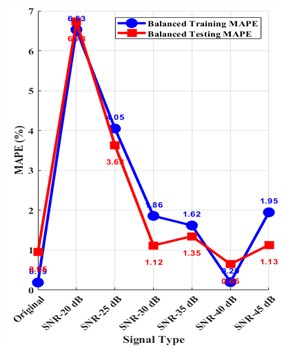
a) Training and testing MAPE performance summary
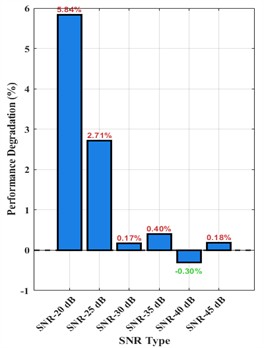
b) Performance degradation summary
From Fig. 7, it can be seen that as the noise intensity increases, the overall decrease in accuracy shows a decreasing trend, with a decrease of about 5.84 % at SNR = 20 dB, and a decrease of less than 0.5 % at SNR = 30, 35, and 45dB, Higher SNR levels yield prediction performance closer to original signal, the prediction accuracy slightly increases when SNR = 40 dB. At the same time, in ordinary industrial control computers, the model feature extraction takes 0.07 s, the prediction time is 0.08 s, and the average time for a single prediction of the model is less than 0.15 s, which meets the real-time response requirements of industrial scenarios. This indicates that the model has strong anti-interference ability and efficient computing performance, and has good industrial application potential.
To further explore the industrial application feasibility of the algorithm proposed in this paper, we selected the probability screen vibration test dataset [21]. This dataset records vibration signals and corresponding screening efficiency under 30 different states, forming 30 samples. Among them, 25 samples were used as the training set, while the remaining 5 served as the test set. Based on the algorithm, parameters are chosen from 0 to 50 with an interval of 0.5, as listed in Table 1. The optimal selection results for single entropy values using the GRNN G-kernel as follows: ApproxEn (3, 24.01, x), SampEn (x, 1, 2.51), PermEn (x, 6), FuzzyEn (x, 3, 0.01, 3), and ShannonEn (x, 4). By combining these entropy values in different configurations, the best combination scheme of “FuzzyEn + ShannonEn” was obtained. Under this optimal combination, the balanced criterion was applied to achieve a best prediction accuracy of 98.98 % under the G-kernel, with a generalization error of 2.27 %, demonstrating excellent prediction and generalization performance. This further highlights the industrial application value of the proposed method.
6. Conclusions
In this paper, the damping efficiency of the system is predicted and analyzed by calculating the entropy values of the time series for different states of the MR damping system, and by establishing the entropy and reconstruction entropy characteristic-GRNN prediction algorithm. The following conclusions are drawn:
1) The GRNN G-kernel prediction model based on cross-validation can obtain a good fitting state of the prediction model by setting personalized kernel parameter intervals. The method established by the comprehensive score of “CV error, F-value, and MI”provides an ideal parameter optimization scheme for the calculation of single entropy features of vibration system time series.
2) Reconstructing a multi-entropy feature combination scheme, adopting the GRNN IMQ-kernel prediction model, and establishing a weight based balance criterion to optimize the entropy feature reconstruction combination scheme, not only achieved better prediction accuracy than existing VMD-box dimension-GRNN, entropy feature combination LSTM, RF, SVM and other prediction models, but also ensured the generalization and reliability of the model.
3) Under the optimal combination of “ApEn+FuzzyEn”, using the constructed GRNN-IMQ kernel prediction model, the prediction accuracy decreases by no more than 6 % after incorporating Gaussian white noise with different SNR of 20-45dB, and most of them only decrease by less than 0.4 %, demonstrating good anti-interference performance. In addition, the prediction model has low machine time consumption and overall shows good robustness and industrial application prospects.
4) The balance criterion optimization model based on GRNN-IMQ provides a new method for predicting the damping efficiency of small sample vibration systems, selecting the optimal entropy calculation, entropy feature reconstruction, and model parameter scheme for the system.
5) The entropy feature reconstruction-GRNN prediction algorithm, when applied to the probability screen vibration test dataset, still achieves high prediction accuracy and generalization performance, demonstrating strong potential for industrial application and promotion.
In addition, the multi-source signal detection and fusion algorithm model can be a focus of research on MR damping systems in the feature, and the reliability and further promotion value of the model algorithm can be verified by applying it to industrial practice through more sample acquisition.
References
-
Z. Wang, Z. Chen, H. Gao, and H. Wang, “Development of a self-powered magnetorheological damper system for cable vibration control,” Applied Sciences, Vol. 8, No. 1, p. 118, Jan. 2018, https://doi.org/10.3390/app8010118
-
X. Zhu, X. Jing, and L. Cheng, “Magnetorheological fluid dampers: a review on structure design and analysis,” Journal of Intelligent Material Systems and Structures, Vol. 23, No. 8, pp. 839–873, Mar. 2012, https://doi.org/10.1177/1045389x12436735
-
B. F. Spencer, S. J. Dyke, M. K. Sain, and J. D. Carlson, “Phenomenological model for magnetorheological dampers,” Journal of Engineering Mechanics, Vol. 123, No. 3, pp. 230–238, Mar. 1997, https://doi.org/10.1061/(asce)0733-9399(1997)123:3(230)
-
H. D. Chae and S.-B. Choi, “A new vibration isolation bed stage with magnetorheological dampers for ambulance vehicles,” Smart Materials and Structures, Vol. 24, No. 1, p. 017001, Jan. 2015, https://doi.org/10.1088/0964-1726/24/1/017001
-
X. M. Liu, “Application of higher order spectrum in analysis of magneto-rheological damper control,” Journal of Central South University of Technology, No. S1, 2008, https://doi.org/conferencearticle/5aa0a0cbc095d7222079fc89
-
Q. T. Chen, Y. R. Song, and Y. J. Huang, “Accurate modeling and performance study of MR vibration system based on ARMA model,” (in Chinese), Chinese Journal of Scientific Instrument, Vol. 36, No. 5, pp. 1014–1022, 2015, https://doi.org/10.19650/j.cnki.cjsi.2015.05.007
-
Q. T. Chen, Y. R. Song, and Y. J. Huang, “Characteristics research of MR damper based on AR model-fractal dimension,” (in Chinese), Chinese Journal of Scientific Instrument, Vol. 37, No. 12, pp. 2774–2781, 2016, https://doi.org/10.19650/j.cnki.cjsi.2016.12.017
-
Q. T. Chen and Y. J. Huang, “esearch of time series autoregressive modeling based on VMD filtering reconstruction,” (in Chinese), Journal of Electronic Measurement and Instrumentation, Vol. 34, No. 3, pp. 155–162, 2020, https://doi.org/10.13382/j.jemi.b1902638
-
C. Yi-Ze and C. Qing-Tang, “State prediction of MR system by VMD-GRNN based on fractal dimension,” Advances in Mechanical Engineering, Vol. 14, No. 12, p. 168781322211458, Dec. 2022, https://doi.org/10.1177/16878132221145899
-
W. Li, X. Yang, H. Li, and L. Su, “Hybrid forecasting approach based on GRNN neural network and SVR machine for electricity demand forecasting,” Energies, Vol. 10, No. 1, p. 44, Jan. 2017, https://doi.org/10.3390/en10010044
-
Y. Zhang, B. Chen, X. Liu, Z. Yuan, and J. Principe, “Convergence of a fixed-point minimum error entropy algorithm,” Entropy, Vol. 17, No. 8, pp. 5549–5560, Aug. 2015, https://doi.org/10.3390/e17085549
-
K. Peng and P. Shang, “Characterizing ordinal network of time series based on complexity-entropy curve,” Pattern Recognition, Vol. 124, p. 108464, Apr. 2022, https://doi.org/10.1016/j.patcog.2021.108464
-
K. Gao et al., “Anomaly detection for time series with difference rate sample entropy and generative adversarial networks,” Complexity, Vol. 2021, p. 5854096, Nov. 2021, https://doi.org/10.1155/2021/5854096
-
S. M. Pincus, “Approximate entropy as a measure of system complexity.,” Proceedings of the National Academy of Sciences, Vol. 88, No. 6, pp. 2297–2301, Mar. 1991, https://doi.org/10.1073/pnas.88.6.2297
-
Z. Wang et al., “Few-shot fault diagnosis for machinery using multi-scale perception multi-level feature fusion image quadrant entropy,” Advanced Engineering Informatics, Vol. 63, p. 102972, Jan. 2025, https://doi.org/10.1016/j.aei.2024.102972
-
D. Zhang, X. Ren, and H. Zuo, “Compound fault diagnosis for gearbox based using of Euclidean matrix sample entropy and one‐dimensional convolutional neural network,” Shock and Vibration, Vol. 2021, p. 6669006, Apr. 2021, https://doi.org/10.1155/2021/6669006
-
R. Alcaraz, D. Abásolo, R. Hornero, and J. J. Rieta, “Optimal parameters study for sample entropy-based atrial fibrillation organization analysis,” Computer Methods and Programs in Biomedicine, Vol. 99, No. 1, pp. 124–132, Jul. 2010, https://doi.org/10.1016/j.cmpb.2010.02.009
-
S. Zhou, S. Qian, W. Chang, Y. Xiao, and Y. Cheng, “A novel bearing multi-fault diagnosis approach based on weighted permutation entropy and an improved SVM ensemble classifier,” Sensors, Vol. 18, No. 6, p. 1934, Jun. 2018, https://doi.org/10.3390/s18061934
-
W. Zhao et al., “X-ray image enhancement with multi-scale local edge preserving filter based on fuzzy entropy,” Journal of X-Ray Science and Technology: Clinical Applications of Diagnosis and Therapeutics, Vol. 32, No. 4, pp. 1061–1077, Jul. 2024, https://doi.org/10.3233/xst-240045
-
A. Shternshis, P. Mazzarisi, and S. Marmi, “Measuring market efficiency: The Shannon entropy of high-frequency financial time series,” Chaos, Solitons and Fractals, Vol. 162, p. 112403, Sep. 2022, https://doi.org/10.1016/j.chaos.2022.112403
-
Q. Tang, “Study on time frequency characteristics of Wigner higher order spectrum and its application in screening operation,” Huaqiao University, 2011.
About this article

Funded projects: Guiding science project of Fujian Province(2024H0022, 2021H0059); Team Construction Funds for advanced materials and laser processing of Putian University. Postgraduate research project of Putian University (yjs2024051); Thanks for the strong support, guidance and help of Yijian Huang’s team from Huaqiao University, which provided an experimental platform and detection data for this article.
The datasets generated during and/or analyzed during the current study are available from the corresponding author on reasonable request.
Qingtang Chen is responsible for the construction of the overall framework of the paper, algorithm design, calculation and result analysis, and the writing of the paper. Zilong Yang is responsible for auxiliary experimental data organization.
The authors declare that they have no conflict of interest.
