Abstract
Mining sensors work in harsh environments and are subject to complex vibrations. Its internal structure is prone to strength failure or fatigue damage. This paper focuses on the structural design of the front discharge and receiver housing inside the electromagnetic imaging sensor for coal-rock demarcation detection. Static analysis, modal analysis, and random vibration simulation were performed using ANSYS Workbench software to verify its reliability and strength in mining. In the static analysis, the thickness of the designed housing is 2 mm. The maximum equivalent elastic strain after applying a pressure of 0.5 MPa to the housing is 0.133 %, much less than the criterion of material fracture strain. This proves that it has excellent strength properties and will not experience strength failure. Modal analysis shows that the first-order intrinsic frequency of the housing is 3298.7 Hz. It is much higher than the vibration frequency in the actual working environment, which can effectively avoid resonance and improve the reliability of the structure. Random vibration simulation results show that the housing's maximum equivalent force and displacement are within the safe range, and the impact on the structural performance is negligible. These results provide a theoretical basis for the optimal design of the sensor housing and its application in complex vibration environments.
Highlights
- 2 mm copper housing withstands 0.5 MPa pressure with minimal strain (0.133%) and 50g shock, proving robust for harsh mining conditions.
- High first-order natural frequency (3298.7 Hz) avoids resonance with mining vibrations, ensuring structural reliability.
- Random vibration analysis confirms stress and displacement are within safe limits, with excellent fatigue life for long-term stability.
1. Introduction
In recent years, with economic growth, the demand for mineral resources has increased dramatically. Therefore, it is crucial to monitor the operation of mining equipment to quickly recognize fault information and take effective countermeasures [1]. Under the general trend of intelligent development of coal mines, mining sensor technology has been rapidly promoted and improved. Among the many sensor types, coal-rock demarcation electromagnetic imaging sensors can provide high-precision imaging detection of coal-rock interfaces. This is crucial for the intelligent control of equipment operation and environmental safety warning during coal mining. Electromagnetic imaging technology can effectively recognize the coal-rock interface. It can enhance the safety and efficiency of coal mining. However, mining sensors operate in generally harsh environments. It is significantly affected by mechanical vibration. The structural design and performance analysis of sensors are still the focus of current research. Wang et al. [2] proposed a design process to obtain a highly rigid structure quickly and efficiently. The process simulates the optimal structural design of a CNC grinding machine based on the finite element method and sensor technology. The Taguchi experimental method and displacement sensor experiment verified the process. Li et al. [3] investigated the influence of the cavity morphology on the performance of vibration sensing. They compared the frequency response of microbubble cavity structures with different parameters. The sensor is designed based on the microbubble method F-P structure. It is suitable for real-time monitoring of static pressure and dynamic vibration in complex environments such as narrow spaces. Guanqiang Cao et al. [4] explored the method of coal gangue identification based on vibration signal acquisition. They designed a corresponding vibration sensor. The sensor can accurately collect vibration signals in a vibration environment. Li et al. [5] introduced a new type of non-contact friction electric vibration sensor. It has a helical floating electrode structure. The sensor can work effectively in a wide frequency range of 1-1000 Hz. Its non-contact design and integrated structure enable it to maintain stable performance after 300,000 cycles. This shows excellent durability. Xiaodong Wang [6] found that the frequency response performance of vibration sensor housings made of metallic materials is better than that of non-metallic materials. The finding was based on comparative frequency response simulation using ANSYS Workbench. For the same outer diameter and total weight, the higher the height of the housing, the lower the frequency response performance. Wu et al. [7] proposed a fiber-optic invasion and vibration detection system. It can work stably and efficiently, and perform security monitoring tasks even in severe working environments.
In this paper, we use ANSYS Workbench software to perform static and modal analyses on the internal front discharge and receiver housing of an electromagnetic imaging sensor. This ensures the strength and reliability of the structural design. Additionally, we carry out spectral analysis under random vibration. This helps us study the stress and displacement responses in the frequency domain when the housing is under vibration excitation.
2. Finite element analysis
2.1. Theory of finite element analysis
Finite Element Analysis (FEA) is a numerical computational method used to analyze complex structures or objects. It works by dividing complex geometries into simple units and then analyzing these units. It is usually used to predict the behavioral pattern of the whole structure under different loading conditions [8]. The core equation of finite element analysis is as follows:
Among them, is the overall stiffness matrix, is the node displacement vector, and is the node force vector. Solving this equation can obtain the node displacement, and then other physical quantities such as strain and stress can be calculated [9]. The first step in finite element analysis is pre-processing. Pre-processing consists of the following steps:
1) Problem definition. Before analyzing using FEA methods, the object of analysis needs to be clarified to identify the specific characteristics.
2) Modeling. After clarifying the characteristics of the analytical object, it is necessary to establish a geometric model of the object. Within a certain margin of error, the object can be simplified.
3) Unit selection and meshing. Select the appropriate unit to model, and determine the number, quality, type, etc., of the grid.
4) Boundary condition definition. Boundary conditions are the interaction relationship between the model and the actual environment, and it is important to define the boundary conditions correctly.
Solving and post-processing are carried out after the completion of pre-processing. Solving refers to the corresponding numerical calculations by computer and outputting the calculation results. Post-processing is the process of processing the output of a computer to get the presentation you need [10].
2.2. Pre-processing
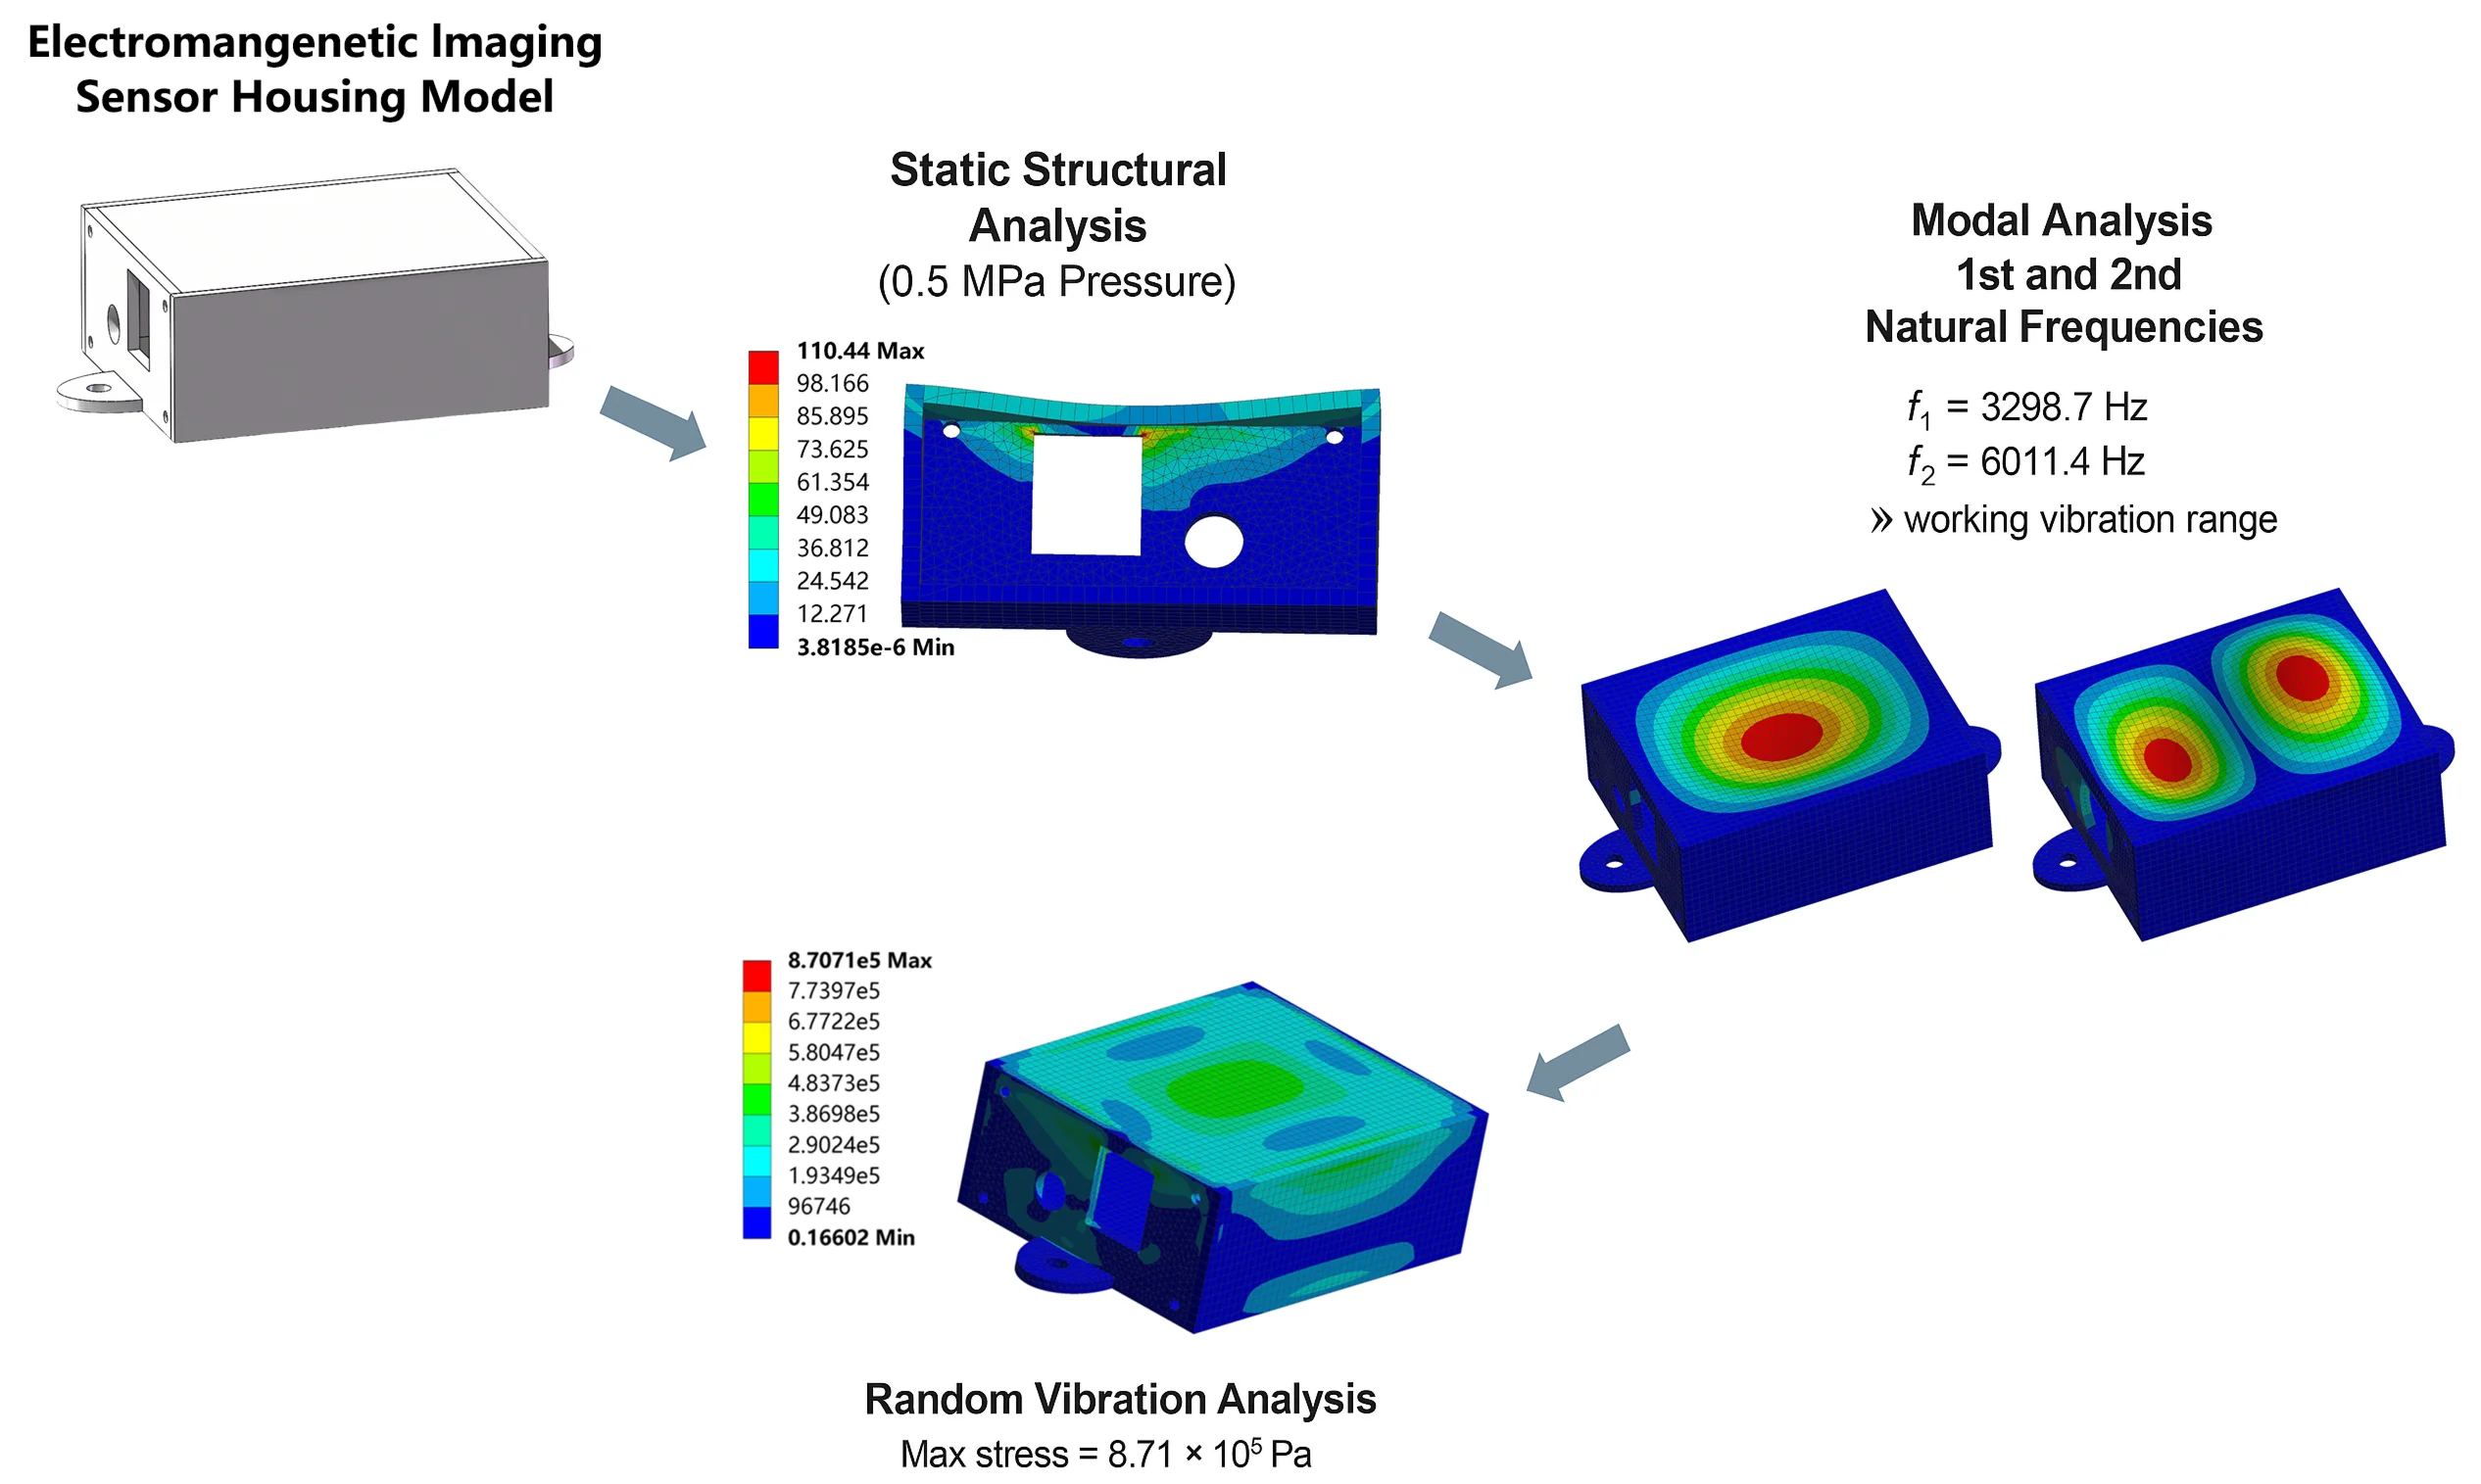
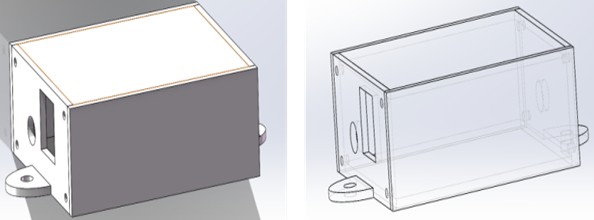
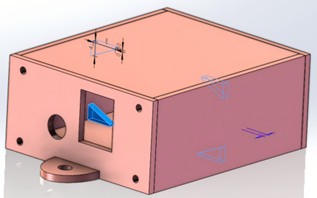
An electromagnetic imaging sensor front discharge and receiver housing was designed. When modeling with SolidWorks software, the finite element model needs to match the purpose of the analysis and the performance of the computer. To ensure the quality of meshing and improve the efficiency of subsequent analysis, the actual model should be moderately simplified. In this model, the threaded hole is simplified to a round hole. Its finite element model is shown in Fig. 1, including the left side plate, right side plate, and shell. According to the constructed model, its length is 60 mm, its width is 48 mm, and its height is 25 mm.
Fig. 1Physical model
To meet the stringent requirements of sensor structural performance in the harsh underground mining environment, the material selection for this housing was the result of comprehensive consideration from multiple perspectives. Copper was ultimately selected. This decision was based on a comprehensive evaluation of its mechanical properties, environmental adaptability, and functional performance. Compared to aluminum alloys (such as 6061), copper may not have advantages in terms of density and cost, but its exceptional electromagnetic shielding performance is crucial for ensuring the signal quality and interference resistance of the internal electromagnetic imaging unit. This characteristic is not present in aluminum alloys. Compared to stainless steel (such as 304), copper has lower yield strength. However, its superior ductility facilitates the processing and forming of complex cavity structures, and its corrosion resistance is sufficient to withstand the humid and corrosive conditions underground. Additionally, copper’s excellent thermal conductivity aids in dissipating heat generated during prolonged sensor operation, enhancing thermal stability. Therefore, while ensuring structural strength meets design requirements, copper offers the optimal balance of electrical compatibility, environmental durability, and manufacturability. The parameters of copper materials are shown in Table 1.
Table 1Material physical parameter
Material | Young’s modulus / GPa | Poisson’s ratio / μ | Yield strength / MPa |
Copper | 115 | 0.34 | 120 |
Finite element static analysis is carried out using ANSYS Workbench software. After the material properties are set, meshing is performed. Mesh delineation techniques include a variety of techniques, this paper selects the multi-area mesh delineation. From the principle of operation, it is clear that in practical applications, the bottom plate of the housing is fixed with other mechanisms, so the bottom plate in the model should be set up with fixed constraints.
2.3. Design and optimization of housing thickness
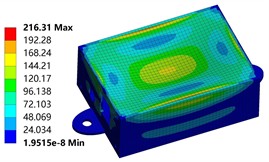
The working environment under the mine is complicated and changeable. The housing will be affected by various shocks and vibrations in such an environment. This puts severe requirements on its structural performance. For the analysis of the overall stress strength, the stresses and strains due to the application of loads need to be considered. When analyzing the mechanical properties of the housing, we first focus on the influence of the key factor of housing thickness on its stress distribution. Choosing the proper thickness plays a significant role in enhancing the performance of the structure. In this section, three types of housing with different thicknesses of 1.2 mm, 2 mm, and 2.5 mm are designed.
Long et al. [11] designed a composite material sensor housing for mining applications. During static analysis, a pressure of 0.5 MPa was applied to the shell and its inner wall. Results indicate that this housing meets the operational requirements for harsh underground environments in both metallic and non-metallic mines. Similarly, we applied a 0.5 MPa pressure load perpendicular to the inner wall and employed static calculations to determine the resulting equivalent stress.
As shown in Fig. 2(a), when the thickness of the housing is 1.2 mm, the maximum equivalent force generated by applying a load of 0.5 MPa is 216.31 MPa. This value far exceeds the yield strength of the material itself, which is 120 MPa. It indicates that under this thickness condition, the housing is extremely prone to plastic deformation or even destruction during use. From the specific location of stress distribution, the maximum stress is mainly concentrated at the upper surface edge of the housing. It is the weak link of the whole structure. At the same time, the center area of the housing also shows a more obvious stress concentration phenomenon. And this stress concentration state will gradually transition to the surrounding region, forming a gradient of stress distribution. However, unlike the upper surface and the center region, the stress gradient in the side region of the chassis is relatively gentle, and the stress change is smooth. This may be related to the geometry of the sides and the way the stresses are applied.
Fig. 2The equivalent stress distribution of housing with different thicknesses
a) 1.2 mm
b) 2 mm
c) 2.5 mm
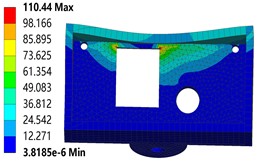
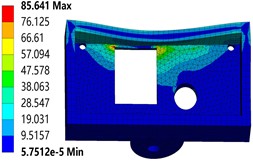
As shown in Fig. 2(b), when the thickness of the chassis increases to 2 mm, the stress distribution changes significantly. At this time, the location of the maximum stress shifted to the prongs of the openings on the left side of the housing. This indicates that the geometry at the corners has a dominant effect on the stress distribution under the new thickness condition. Compared with the case of 1.2 mm thickness in Fig. 2(a), the peak stress has been significantly reduced. It is only 110.44 MPa, a value that is already below the yield strength of the material. This indicates that the load-carrying capacity of the housing has been significantly improved in the 2 mm thickness condition. It can maintain a better structural stability under a load of 0.5 MPa. As shown in Fig. 2(c), when the thickness reaches 2.5 mm, the maximum stress of the chassis is further reduced to 85.641 MPa. At this point, the stress distribution is approximately the same as that in Fig. 2(b), but the overall stress level is lower. This indicates that the mechanical properties of the housing are further optimized under the 2.5 mm thickness condition. It can better withstand external loads and has higher structural stability.
Combining the results of the above analysis with the gradual increase in the thickness of the housing, the maximum equivalent force generated by the housing under the load of 0.5 MPa shows a trend of gradual decrease. This trend is of great significance for the design of the housing. Considering that the yield strength of the material is 120 MPa, to ensure that the housing can work safely and reliably in the actual use process, the thickness of the housing should be designed not less than 2 mm. Therefore, in the subsequent analysis and research, we all take the 2 mm thickness of the housing as the benchmark. Next, the mechanical properties and structural stability under different working conditions will be discussed in depth. In this way, we can provide a more scientific and accurate basis for the optimized design and practical application of the housing.
2.4. Static analysis
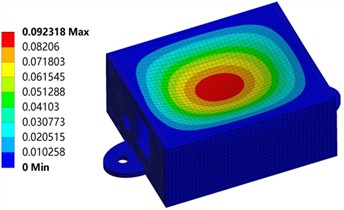
Fig. 3 shows the deformation and strain cloud diagrams of the chassis under a 0.5 MPa load. The maximum deformation is about 0.0923 mm. The deformation is mainly concentrated in the center region of the upper surface. This may be due to the fact that the load transfer path makes the center region subject to a larger load. The minimum deformation occurs in the side and bottom plate sections. This is because the bottom surface and the circular holes at the ends are fixed in the working condition. This deformation data is small compared to the model data, and the effect is negligible. The maximum equivalent elastic strain of the housing is only 0.133 % at a pressure of 0.5 MPa. It is much smaller than the fracture strain criterion of the material. Therefore, this housing meets the strength requirements at 0.5 MPa pressure and will not experience strength failure.
Fig. 3Deformation and strain of the housing under 0.5 MPa load
2.5. Impact load and thermal stress analysis
Actual mining environments are complex and variable, with sensor housings potentially subjected to impact loads and thermal stresses. Impact loads primarily refer to mechanical shocks experienced during sensor transportation, installation, and operation. In accordance with GB/T 2423.5-2019, a 50 g/11 ms half-sine impact condition is added. Thermal stress primarily refers to internal stresses caused by uneven expansion and contraction of the housing due to environmental temperature changes or heat generated by the sensor itself. In accordance with GB/T 2423.22-2012, a cyclic thermal stress analysis at –20 to 40 °C is added.
Fig. 4 shows the actual response of the sensor housing under a 50 g/11 ms half-sine shock load. The maximum deformation was only 0.187 millimeters. The housing maintains structural integrity during sudden high-intensity impacts, preventing interference or collision with internal components. This effectively avoids sensor malfunction caused by deformation. The maximum equivalent stress reached 6.13 MPa, well below the yield strength of the copper material. The housing remains entirely within the elastic deformation range during sudden acceleration impacts, fully recovering its original shape after unloading without permanent deformation or damage. Stress concentration zones occur at mounting holes and structural transitions. These areas warrant particular attention in practical applications. However, current stress levels remain entirely within safe limits. This impact resistance fully ensures sensor reliability during sudden shocks encountered in transportation, installation, or operation, making it particularly suitable for industrial vibration environments.
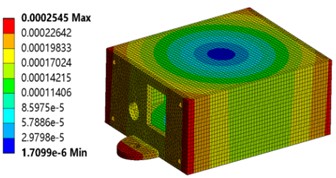
Fig. 5 illustrates the thermal response of the sensor housing under temperature cycling conditions ranging from –20 °C to 40 °C. The maximum thermal deformation measured was 0.254 mm. The housing maintains dimensional stability throughout temperature variations. No seal failure or loosening of fasteners occurs due to thermal expansion and contraction, ensuring the protective performance of the housing. The maximum thermal stress reached 5.78 MPa, significantly below the yield strength of the copper material. The housing exhibits no plastic deformation or cumulative damage during thermal cycling, maintaining long-term structural integrity. Thermal stress distribution remains relatively uniform with no significant localized stress concentrations. This indicates a well-designed thermal structure that prevents cracking or seal failure caused by excessive temperature gradients. Such thermal performance ensures reliable sensor operation under varying temperatures, providing a stable protective environment for internal sensitive components.
Fig. 4Deformation and strain under impact loading
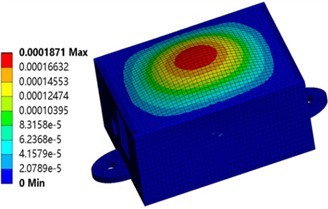
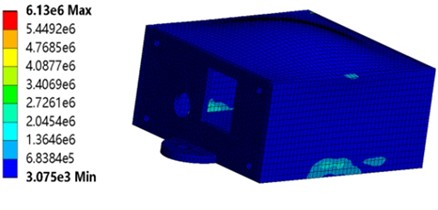
Fig. 5Deformation and strain under thermal stress
2.6. Modal analysis
Modal analysis is a basic method of dynamics analysis that determines the vibration pattern and the intrinsic frequency of a device in a constrained state. In a vibration environment, mechanical devices vibrating at a resonant frequency can cause serious damage. This can be avoided by modal analysis. At the same time, the response of the structure to different sizes of loads can also be derived from modal analysis. In practical engineering applications, modal analysis provides critical data support for the optimal design of mechanical structures. It helps engineers to build more reliable and efficient equipment. In addition, modal analysis has a wide range of applications in vibration analysis. Usually, before random vibration analysis, modal analysis is performed first to ensure the accuracy and effectiveness of the subsequent analysis [12-13]. The first ten orders of modal analysis of the intrinsic frequency are shown in Table 2, and the first four orders of the vibration pattern cloud diagram are shown in Fig. 6.
The model explored in this paper has a small size and compact structure. Its inherent frequency is relatively large. The first-order intrinsic frequency reaches 3298.7 Hz. In the actual working environment, the vibration frequency is much smaller than the intrinsic frequency of this structure. So this structure can be used in the actual vibration working condition [14].
As in Fig. 6(a), the vibration frequency is the first-order intrinsic frequency. The extrusion deformation occurs along the -axis direction. When the vibration frequency is the second-order intrinsic frequency, the deformation direction is still mainly in the -axis direction. However, the left side is a concave deformation, and the right side is a convex deformation. In Fig. 6(b), the vibration frequency is the third-order intrinsic frequency. The structure is bent along the plane at about 15° and has an extension in all directions. When the vibration frequency is the fourth-order intrinsic frequency, the upper surface deformation is not much different from the second-order. However, the deformation position was changed. It was extruded inward along the plane. According to the vibration pattern cloud diagram, the upper surface of the housing is a high-risk area where rupture may occur. From the perspective of structural optimization, this part can be strengthened.
Table 2Modal order and natural frequency
Mode order | Natural frequency (Hz) |
1 | 3298.7 |
2 | 6011.4 |
3 | 6807.5 |
4 | 7530.8 |
5 | 9436.2 |
6 | 10051 |
7 | 10299 |
8 | 11608 |
9 | 12982 |
10 | 13567 |
Fig. 6The first four natural frequency modes of the front receiver housing of the electromagnetic imaging sensor
a) First-order and second-order
b) Third-order and fourth-order
The modal analysis results presented in this paper are derived from numerical simulations. The accuracy of these results must be validated through experimental modal analysis. Future validation may involve constructing a physical prototype consistent with the simulation model. Testing can employ single-point excitation and multi-point pickup methods, utilizing hammering or sine sweep frequency techniques to obtain the structure's frequency response function. This approach identifies the first few experimental modal parameters. Comparing experimental and simulation results, followed by model refinement, can significantly enhance the simulation model's credibility.
Additionally, this study does not account for structural damping. Damping is a critical factor in suppressing resonance responses. For such welded/bolted metal structures, the damping ratio typically ranges between 0.5 % and 2 %. According to vibration theory, the dynamic response of a structure at resonance points is amplified by approximately 1/(2). With 1 %, the amplification factor can reach 50 times. This implies that if excitation frequency drifts toward 3298.7 Hz due to equipment wear or operational changes, this minimal damping value cannot effectively suppress the substantial resonance response. Consequently, structural fatigue or functional failure of internal components remains possible. In future optimizations, damping will be treated as a critical variable. More advanced analysis methods, such as harmonic response analysis based on modal superposition theory and transient dynamics analysis, can be employed. The Rayleigh damping model should also be incorporated. By setting mass damping coefficients and stiffness damping coefficients, the dynamic characteristics of the structure in the resonance zone can be predicted more accurately. Additionally, adding constraint layer damping materials or optimizing connection methods can actively enhance the structural damping level.
3. Random vibration analysis and fatigue calculation
From the point of view of the way the excitation is applied, excitations can be divided into two categories: regular excitations and random excitations. Regularized excitation can be described in terms of a deterministic function of time or time and space. This excitation is known and predictable. Vibrations under such excitation are regular vibrations. Random excitation cannot be described by a deterministic function of time or time and space, and the instantaneous value of the excitation cannot be predicted in advance [15-16]. The mode of vibration that is given a random excitation is called Random vibration. The dynamic equation of a multi-degree-of-freedom system under random loads is as follows [17]:
where , , and are respectively the mass matrix, damping matrix, and stiffness matrix of the system; , , represent the acceleration, velocity, and displacement of the unit nodes respectively; is the incentive.
Fig. 7PSD spectrum curve of machine vibration
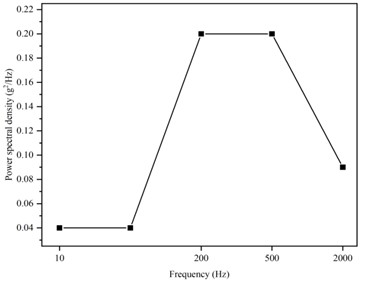
Random vibration is caused by the uncertainty and irregularity of the excitation applied from outside, which results in a random vibration response of the system or structure. In general engineering problems, vibration has such characteristics. Due to the long excitation time of random vibration, the time-domain random loads are generally transformed [18]. Random vibration is used to simulate the environmental stresses so that the life and reliability of the structure can be checked. The excitation applied by random vibration is named as power spectral density, which is a statistical method. In this section, random vibration tests are performed on the internal housing of an electromagnetic imaging sensor based on the random vibration module in ANSYS Workbench. The stress and displacement responses generated under frequency domain excitation signals are investigated.
The power spectral density (PSD) magnitude is shown in Fig. 7.
Fig. 8Housing equivalent stress distribution
a) Horizontal direction
b) Vertical direction
As in Fig. 8, random vibration excitation is applied to the housing along the horizontal and vertical directions. The equivalent stress distribution of the housing can be obtained.
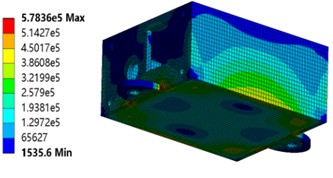
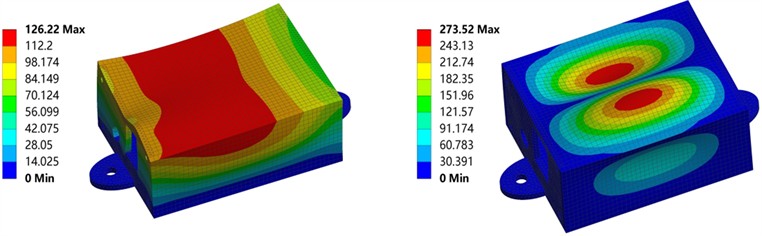
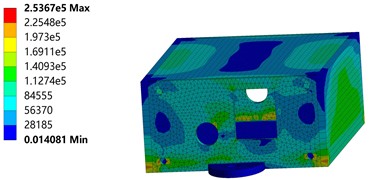
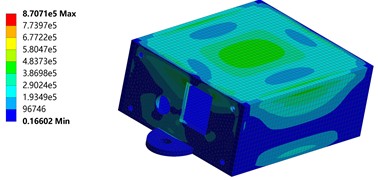
According to Fig. 8(a), the maximum equivalent force value is 2.537×10⁵ N/m2 after applying excitation to the housing along the horizontal direction. It is much less than the yield strength of the material. The maximum stress value occurs at the bottom corners and side round holes due to the geometrical discontinuities at these places. Usually, abrupt changes in geometry lead to a significant increase in stresses in localized areas. These areas are prone to stress peaks even when the overall stress is not extreme. Fig. 8(b) shows that the maximum equivalent stress value of the chassis after being excited by random vibration in the vertical direction is 8.707×10⁵ N/m2. This stress peak occurs inside the left side plate of the housing. However, from the figure, we can see the stress distribution on the outer surface. According to the basic principle of stress propagation, the stress propagation path should run from the high stress point to the low stress point. In this model, it is reflected as the propagation from the center and edge of the top surface to the surroundings. This propagation trend reflects the redistribution of stresses within the stressed structure. The high stress region will gradually propagate the stress to the surrounding low stress region by deforming the material. Comparing the two figures, it can be seen that the total stress distribution in the horizontal direction under vibration excitation is smaller than the total stress distribution in the vertical direction. This is because in the horizontal direction, the overall degree of freedom of the housing is lower, the deformation that occurs is smaller, so the overall stress distribution is also smaller [19-20].
Fig. 9Housing equivalent displacement distribution
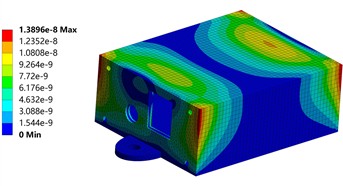
a) Horizontal direction
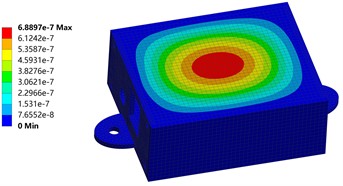
b) Vertical direction
As in Fig. 9, random vibration excitation is applied to the housing along the horizontal and vertical directions, respectively. The equivalent displacement results in the horizontal and vertical directions are obtained.
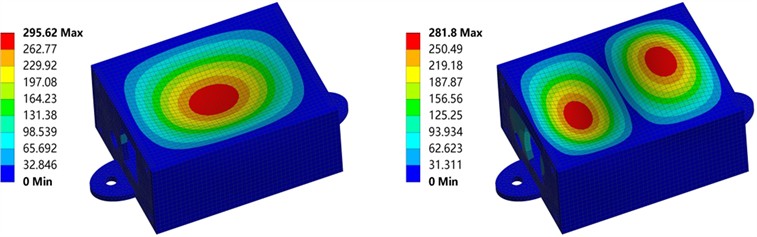
As shown in Fig. 9(a), after applying vibration excitation in the horizontal direction, the gradient distribution of the equivalent displacement of the housing has a symmetric trend about the center point. The main displacements occurred at the four corners of the upper surface. It decreases and then increases along the loading direction of horizontal excitation. The maximum displacement response of the structure is 13.896 nm. According to Fig. 9(b), after applying the vibration excitation in the vertical direction, the center region of the housing becomes the sensitive part of the displacement. The maximum displacement is 688.97 nm. Considering the displacement response generated by random vibration in the horizontal and vertical directions at the same time, they are all within the safe range compared to the overall size of the structure. From the point of view of practical engineering applications, these displacement responses are completely negligible. This means that the housing can maintain good stability and reliability. Its normal function and performance will not be significantly affected by these displacements.
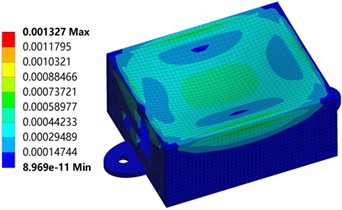
Fig. 10Life and damage estimation
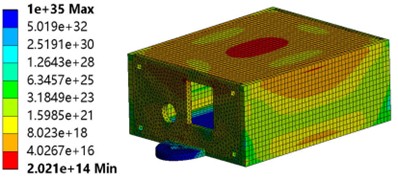
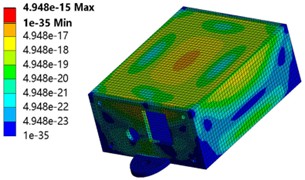
Fig. 10(a) shows the fatigue life distribution of the housing under random vibration loading. The life values span over 20 orders of magnitude, indicating significant variation in vibration fatigue resistance across different structural regions. Areas with long fatigue life are widely distributed across the main walls and base sections of the housing. In these regions, the stress levels remain well below the fatigue limit. Therefore, vibration-induced failure is highly unlikely throughout the entire product service life. These results fully validate the robustness and reliability of the main shell design. Even under stringent random vibration testing, the minimum life value far exceeds the required cycle count for most practical applications. In summary, the fatigue life distribution demonstrates the outstanding vibration fatigue resistance of the shell design. Fig. 10(b) presents the damage distribution based on the Miner linear cumulative damage rule. All damage values are significantly less than 1. This outcome provides key insight into the structural safety prediction. According to Miner’s rule, fatigue failure occurs when the cumulative damage reaches 1. The very low damage values observed across the housing confirm its structural integrity and strong adaptability to random vibration conditions. This ensures long-term stability and measurement accuracy for the internal precision components under dynamic loading. The damage contour plot supports the conclusions drawn from the life distribution, offering a more intuitive visualization of the design safety margin.
4. Discussions
4.1. Multi-parameter optimization of the housing
We optimized the shell thickness in Section 2.3. Beyond that, other geometric parameters such as fillets and ribs also significantly impact structural performance. Therefore, this section provides a detailed discussion of these two factors, offering valuable insights for sensor housing design. The housing was modified with fillets and rib reinforcement, with the results shown in Fig. 11. Subsequently, stress and strain analysis were performed on the optimized housing, yielding the results depicted in Figs. 12 and 13.
Fig. 12 shows the deformation and strain contours of the housing with fillets. Compared to Fig. 3, the maximum deformation of the housing decreases from 0.092318 mm to 0.08617 mm under identical loading conditions, representing a reduction of approximately 6.7 %. This improvement is primarily attributed to the influence of geometry on stress distribution. Sharp-edged geometries are prone to significant stress concentration at corners, which increases local strain and leads to greater overall deformation. In contrast, the use of fillets provides a smooth geometric transition that effectively disperses stress, thereby enhancing the overall stiffness and deformation resistance of the structure. Furthermore, the maximum equivalent stress of the housing decreases markedly from 110.44 MPa to 82.127 MPa, a reduction of about 25.6 %. Meanwhile, the stress distribution becomes more uniform, with a noticeable reduction in the size of high-stress regions. The smooth transition introduced by the fillet alters the force flow path, allowing stress to be distributed more evenly over a broader area. This results in a significant decrease in peak stress, thereby improving the load-bearing efficiency and fatigue life of the structure.
Fig. 11Methods for optimizing the housing

a) Fillet
b) Rib reinforcements
Fig. 12Deformation and strain after fillet
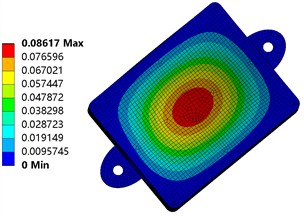
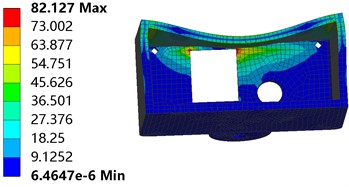
Fig. 13Deformation and strain after adding ribs
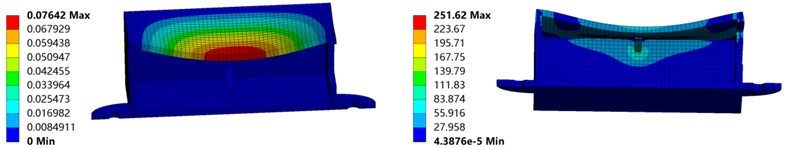
Fig. 13 presents the deformation and strain contours of the housing after the addition of four ribs. Compared with Fig. 3, the maximum total deformation decreases from 0.092318 mm to 0.07642 mm, a reduction of about 17.2 %. The ribs act as internal reinforcement elements that enhance the bending and compressive stiffness of the structure. This strengthening effect helps to suppress overall deformation under pressure and leads to a more uniform deformation distribution. Furthermore, the ribs improve the transfer and distribution of localized concentrated loads over a larger area of the structure, which increases structural stability and load-bearing efficiency. In comparison with Fig. 2, the stress distribution becomes more uniform in general. However, pronounced stress concentrations occur at the junction points where the ribs connect to the inner wall of the housing. At the same time, stress levels in most other regions are reduced relative to the design without ribs. This redistribution of stress is characteristic of stiffened structures. The design improves overall structural stiffness and reduces average stress across large areas, though it increases stress locally. In conclusion, while the addition of ribs improves global mechanical performance and reduces stress across much of the housing, it also introduces localized stress concentrations. Future research could explore the use of fillet transitions to mitigate stress peaks, thereby achieving a better balance between overall reinforcement and local durability.
4.2. Structural optimization and practical application recommendations
Based on the previous simulation results, the sensor housing shows areas of high stress and potential vibration risks under extreme working conditions. To further improve its reliability in practical applications, several optimizations can be implemented. First, high-risk regions on the top surface identified through modal analysis can be reinforced with local stiffening ribs or thickened to enhance stiffness and resistance to deformation. Second, sharp corners and the circular holes on the side edges, where stress concentration occurs, should be redesigned with smoother geometric transitions. Using larger fillet radii can help prevent fatigue cracks caused by stress concentration. Considering the complex downhole vibration environment and possible frequency drift, a layer of damping material can be applied to the inner wall or connection interfaces to improve the overall structural damping performance. Furthermore, based on earlier analysis of fillet and rib optimization, it is recommended to combine both larger fillets and reinforcing ribs in the actual design. However, while enhancing stiffness, care must be taken to mitigate local stress concentrations at the rib roots. Through these improvements, the long-term stability and measurement accuracy of the electromagnetic imaging sensor housing under intense vibration and impact conditions will be significantly enhanced. This will allow the device to better meet the rigorous demands of intelligent mining operations.
5. Conclusions
In this paper, the static analysis, modal analysis, and random vibration simulation of the front discharge and receiver housing inside the coal-rock demarcation electromagnetic imaging sensor were carried out by ANSYS Workbench software. The thickness of the housing is designed to be 2 mm through static analysis. A pressure of 0.5 MPa is applied to the housing, and the result shows that the maximum equivalent elastic strain is only 0.133 %. This figure is much less than the material strain-at-break criterion, indicating that the housing has good strength properties under mine service conditions. There will be no strength failure phenomenon. Modal analysis results show that the first-order intrinsic frequency of the housing is 3298.7 Hz. It is much higher than the vibration frequency in the actual working environment. It shows that the structure can effectively avoid resonance in the actual vibration conditions and has high reliability. Meanwhile, based on the results of modal analysis, the upper surface of the housing can be strengthened from the perspective of structural optimization. After applying random vibration excitation, the maximum equivalent force and displacement of the housing are within the safe range, and the effect on the structure is negligible.
References
-
Z. Shang, “Research on fiber optic sensor for vibration of oil equipment for mining,” (in Chinese), North China Institute of Science and Technology, 2023.
-
K.-C. Wang, C.-H. Yang, L. Wu, and H. Gao, “Optimal structure of computer numerical control grinding machine based on finite element method simulation and sensor technology,” Sensors and Materials, Vol. 32, No. 5, p. 1633, May 2020, https://doi.org/10.18494/sam.2020.2681
-
Y.-N. Wang, J. Li, and F. Meng, “Design and performance of fiber vibration sensor based on Fabry-Perot structures with microbubble,” IEEE Sensors Journal, Vol. 23, No. 15, pp. 16930–16937, Aug. 2023, https://doi.org/10.1109/jsen.2023.3288084
-
G. Cao, R. Wei, X. Meng, W. Zhao, and Q. Liu, “Design of vibration sensor for coal gangue identification,” (in Chinese), Industry and Mine Automation, Vol. 47, No. 1, pp. 118–122, 2021, https://doi.org/10.13272/j.issn.1671-251x.2020070097
-
Y. Li, Q. Li, X. Ma, X. Li, and Y. Guo, “A non-contact triboelectric vibration sensor with a spiral floating electrode structure for low-frequency vibration monitoring,” Nano Energy, Vol. 133, p. 110437, Jan. 2025, https://doi.org/10.1016/j.nanoen.2024.110437
-
X. Wang, “Research on the frequency response of the vibration sensor housing based on ANSYS Workbench,” (in Chinese), Manufacture and Upgrading Today, No. 5, pp. 105–107, 2023.
-
H. Wu et al., “Field test of a fully distributed fiber optic intrusion detection system for long-distance security monitoring of national borderline,” in OFS2014 23rd International Conference on Optical Fiber Sensors, Vol. 9157, p. 915790, Jun. 2014, https://doi.org/10.1117/12.2058504
-
P. Cheng, “Finite element analysis and structural optimization of shearer rotary seat based on SolidWorks simulation,” (in Chinese), Coal Mine Machinery, Vol. 44, No. 4, pp. 134–136, 2023, https://doi.org/10.13436/j.mkjx.202304039
-
Z. Xue, Y. Xu, M. Hu, and X. Zhu, “Study on the nonlinear interaction characteristics between rail cracks and ultrasonic based on finite element-spectral element coupling method,” Applied Acoustics, Vol. 236, p. 110703, Jun. 2025, https://doi.org/10.1016/j.apacoust.2025.110703
-
X. Zhang, S. Shi, H. Yang, W. Yang, C. Zhang, and T. Wang, “Boom-type road header autonomous speed regulation cutting control system,” (in Chinese), Industry and Mine Automation, Vol. 49, No. 1, pp. 80–89, 2023, https://doi.org/10.13272/j.issn.1671-251x.2022110066
-
B. Long and D. Yang, “Design of NO2 sensor shell for mine based on SMC composite material,” (in Chinese), Coal Mine Machinery, Vol. 44, No. 8, pp. 22–24, 2023, https://doi.org/10.13436/j.mkjx.202308007
-
H. Jia, “Momode analysis method of coal mine vehicle suspension system based on SSI,” (in Chinese), Industry and Mine Automation, Vol. 50, No. S1, pp. 151–155, 2024.
-
X. Cheng, B. Rao, and Y. Gu, “ANSYS Workbench modal analysis and random vibration simulation analysis of a geometric rail inspection instrument testing equipment,” (in Chinese), Metrology and Measurement Technique, Vol. 51, No. 10, pp. 4–6, 2024, https://doi.org/10.15988/j.cnki.1004-6941.2024.10.002
-
Z. Wang, R. Pei, H. Yuan, K. Chen, T. Zhang, and W. Yuan, “Analysis and simulation of downhole vibration environment,” (in Chinese), Chinese Journal of Geophysics, Vol. 66, No. 1, pp. 153–161, 2023.
-
S. A. Hosseini, R. Wu, and S. Peyghami, “Simulation-based assessment of vibration effects on IGBT module lifetime in wind turbines through modal and random vibration analysis,” Applied Sciences, Vol. 15, No. 6, p. 3324, Mar. 2025, https://doi.org/10.3390/app15063324
-
Y. Zhao, Y. Zhang, and J. Lin, “Closed solution for non-stationary random vibration analysis of long-span bridge based on pseudo excitation method,” (in Chinese), Chinese Journal of Computational Mechanics, Vol. 41, No. 1, pp. 202–208, 2024.
-
Z. Guo, H. Chen, and S. Ren, “Random vibration simulation design of connector and component fixture,” (in Chinese), Mechanical and Electrical Information, No. 19, pp. 39–43, 2024, https://doi.org/10.19514/j.cnki.cn32-1628/tm.2024.19.009
-
H. Yu, J. Zhou, B. Wang, and Y. Li, “Spectral decomposition-based explicit time-domain method for non-stationary random vibration analysis of train-bridge system,” Engineering Structures, Vol. 326, p. 119496, Mar. 2025, https://doi.org/10.1016/j.engstruct.2024.119496
-
R. Mahinroosta and V. Oshtaghi, “The effect of particle shape on the deformation and stress reduction of a gravel soil due to wetting,” Scientific Reports, Vol. 11, No. 1, Aug. 2021, https://doi.org/10.1038/s41598-021-95731-y
-
X. Deng, “Performance analysis and mechanisms study of Sic high temperature pressure sensor under vibration environment,” (in Chinese), University of Electronic Science and Technology of China, 2019.
About this article

The General Project of the National Natural Science Foundation of China (52474191).
The datasets generated during and/or analyzed during the current study are available from the corresponding author on reasonable request.
Xiaoxu Zou: conceptualization, investigation, writing-original draft preparation. Long Ma: data curation, formal analysis, writing-review and editing.
The authors declare that they have no conflict of interest.
