Abstract
This paper proposes a novel method for gearbox fault diagnosis, which is capable of identifying both single faults (either in gears or bearings) and various types of compound faults. Vibration signals collected from a test platform were employed to validate the proposed method, where five operating states were configured, including: (1) healthy state; (2) single-tooth breakage of the fixed-axis gear; (3) single-tooth breakage of the planetary gear combined with bearing rolling element damage; (4) planetary gear wear coupled with rolling bearing outer ring damage; and (5) fixed-axis gear root crack, planetary gear wear, and bearing outer ring damage. The proposed method Wilcoxon rank- sum tests and maximum amplitude selection (WTMAS) was used as feature extraction method for vibration signals of different states and to establish the training samples and test samples. The K-Nearest Neighbor (KNN) algorithm was utilized as the classifier for fault type classification and identification. Experimental results demonstrate that the average recognition rate of the proposed method for the five states reaches 95.753 %, indicating that the method exhibits high recognition accuracy for different types of faults and is thus an effective approach for gearbox fault diagnosis.
Highlights
- A novel feature extraction method (WTMAS) based on Wilcoxon rank‑sum test and maximum amplitude selection is proposed, which innovatively introduces the non‑parametric Wilcoxon rank‑sum test into gearbox compound fault diagnosis.
- The WTMAS method can effectively characterize fault features of gearboxes under both single fault and compound fault conditions.
- Five gearbox states are constructed, and a complete diagnosis framework combining WTMAS with KNN realizes accurate fault identification for fixed‑axis gears, planetary gears and bearings, offering a practical solution for gearbox compound fault diagnosis.
1. Introduction
1.1. Research background and significance
Gear transmission is a widely used transmission method in the field of mechanical power transmission. It has advantages such as high space utilization, high power density and stable transmission ratio. Therefore, it holds a dominant position in key areas such as the powertrain of modern transportation vehicles, the speed-increasing mechanism of renewable energy equipment and the feed system of precision processing equipment. However, in actual working conditions, such devices often endure extreme environmental challenges, which makes the core moving components, such as gear pairs and bearings, highly prone to failure, thereby causing the entire system to fail and resulting in significant losses. To address this challenge, current research focuses on reliable and effective diagnostic methods for gear and bearing faults. Advanced detection techniques, such as three-dimensional vibration spectrum analysis, acoustic emission signal analysis, and intelligent predictive systems integrating multi-source information perception, are employed to detect faults at an early stage, thereby preventing accidents [1-3].
1.2. Research status of mainstream fault diagnosis technologies
In the field of gear transmission system fault diagnosis, vibration analysis stands as an established mainstream diagnostic method, with its primary advantages manifesting in signal acquisition. The dynamic response signals captured by the highly sensitive acceleration sensor can fully present the fault characteristics of the equipment. However, in practical engineering applications, this technology faces several key challenges: Firstly, constrained by the equipment structure, the optimal selection of measurement points directly affects the signal-to-noise ratio of the signal; Secondly, the propagation of vibration waves in complex structures will cause modal aliasing phenomena, resulting in difficulties in feature extraction [4-6].
In the field of rotating machinery condition monitoring, feature extraction techniques based on current signals demonstrate unique advantages [7-9]. Compared to vibration monitoring solutions requiring additional sensors, this approach directly leverages the phase current signals from drive motors to capture gear meshing frequency modulation phenomena through Fast Fourier Transform (FFT) [10]. However, the applicability of this method is constrained by system architecture. Currently, it is primarily applicable to transmission systems with direct electromagnetic coupling and remains inapplicable to systems driven by mechanical couplings.
Acoustic emission (AE) detection technology offers an innovative fault identification solution for gear transmission systems [11, 12]. This technique employs broadband acoustic sensors to achieve non-intrusive monitoring, reducing installation costs by more than 80 % compared to traditional vibration detection. Through combined time-frequency domain analysis, it can effectively capture characteristic acoustic fingerprints generated during gear meshing processes. However, practical field applications face significant acoustic interference challenges: environmental noise and multipath reflection effects degrade signal coherence.
In the field of mechanical fault diagnosis, infrared thermal imaging technology [13, 14] offers an innovative solution for gearbox condition monitoring. This technique utilizes high-resolution infrared detectors to achieve non-contact thermal field measurement. Through dynamic thermal signature analysis, it can accurately identify abnormal heating zones in gears. However, this technology faces two primary constraints: the procurement costs of high-end infrared thermal imagers are significant, and it requires the gearbox under inspection to reach a stable operational temperature.
The most common fault of gearbox is single fault of the gear or bearing. The research on single fault of the gearbox was carried out early and made substantial achievement.
In the study of single fault of gear, Zhang [15] applied continuous vibration separation (CVS) to separate the dynamic response of the sun gear by restraining noises and asynchronous signal components, and minimum entropy deconvolution (MED) was used to amplify the fault impact response of the sun gear to realize the diagnosis of sun gear tooth damage. Wang [16] measured the ratio of fault-related modulation components to fault-unrelated modulation components in envelope spectrum by defining a new demodulation sub band evaluation index called ratio of harmonics of defect component-to-residual component (rHDR). And the index was employed to find the optimal demodulation sub band of envelope spectrum in the entire frequency range based on genetic algorithm to obtain the fault diagnosis results.
In the study of single fault of bearing, Zhang [17] proposed an adaptive Kurtogram method. The order statistics filter (OSF) was used to estimate and divide the effective modal components from the spectrum. The empirical wavelet transform (EWT) was used to reconstruct the signal components. And the Kurtogram of the reconstructed signal was formed and sued to find the fault information. Cheng [18] proposed a complementary complete ensemble empirical mode decomposition (EEMD) with adaptive noise (CCEEMDAN) method, which combined the advantages of improved EEMD with adaptive noise and complementary EEMD. The method improves decomposition performance by reducing reconstruction error and mitigating the effect of mode mixing. The method was successfully applied in the diagnosis of high-speed train axle-box bearing.
In gearbox transmission systems, initial minor defects in gears and bearings may trigger multi-component coordinated failure phenomena [19]. Compared with environmental noise interference, the signals generated by such early faults often exhibit significant low signal-to-noise ratio characteristics, and their key characteristic frequency bands are often completely submerged by random noise. What is more complicated is that when the system experiences multiple faults, the vibration signals generated by each fault source will produce nonlinear coupling effects, resulting in a highly aliased spectral structure, which poses a huge challenge to the accurate extraction of fault features. In recent years, in response to this technical challenge, scholars at home and abroad have developed a variety of diagnostic methods with engineering application value. Some innovative technical solutions have demonstrated excellent fault identification performance in actual industrial scenarios, such as maximum correlated kurtosis deconvolution (MCKD) [20], empirical wavelet transform(EWT) [21], morphological component analysis (MCA) [22] and its effect-enhancing approach [23], blind source separation(BSS) [24], ensemble empirical mode decomposition (EEMD) [25], resonance based signal sparse decomposition (RSSD) [26].
1.3. Research progress of gearbox intelligent fault diagnosis
Extracting valid feature information from complex signals is the key to fault diagnosis. The fault diagnosis of gearbox has experienced a long process from manual diagnosis to intelligent diagnosis. The classic intelligent fault diagnosis methods include data acquisition, feature extraction and selection, and feature classification and fault identification. Chen [27] proposed a convolution neural network and discrete wavelet transformation (CNN+DWT) method, which used DWT for feature extraction to generat a time-frequency feature matrix. A forward transmission rule of greedy training was used to train the CNN deep hierarchy of samples, and a classifier was added on the top layer of CNN to classify features and identify faults. For the fault diagnosis of pneumatic systems in material handling systems, M. Demetgul et al. [28] adopted Diffusion Map (DM), Local Linear Embedding (LLE) and AutoEncoder (AE) for feature extraction, and combined the Gustafson-Kessel (GK) and k-medoids clustering algorithms for fault classification, verifying that the combination of LLE and GK can achieve a fault diagnosis accuracy of over 90 %. GK Durbhaka 29] proposed a Swarm LSTM method, which classified faults according to vibration signal data obtained from gearbox by optimizing the traditional Long short-term memory (LSTM) model. Zhou [30] proposed a convolutional sparse coding (MCRCSC) separation diagnosis algorithm based on multi-scale convolution kernel matching compound regularization, which used alternating direction multiplier (ADMM) optimization architecture and alternately solved method to obtain the corresponding fault frequency distribution. Li [31] proposed a LTSS-BoW-CapsNet method, which used local temporal self-similarity coupled with bag-of-words models (LTSS-BoW) to extract fault feature vectors from raw signals, and used multi-label classifier based on a capsule network (CapsNet) to classify the types of faults.
Existing studies have laid a solid theoretical and experimental foundation for gearbox intelligent fault diagnosis, and verified the superiority of data-driven methods in overcoming the limitations of traditional manual feature extraction. Current mainstream intelligent diagnosis methods can be divided into three technical routes: (1) End-to-end deep learning methods (CNN, LSTM, CapsNet, etc.) for automatic feature learning directly from raw vibration signals; (2) Manifold learning and sparse coding-based methods for low-dimensional sensitive feature mining and enhancement; (3) Hybrid methods combining classical signal processing (e.g., DWT) and deep learning to improve feature learning efficiency.
Nevertheless, existing methods still face three core technical bottlenecks in industrial gearbox compound fault diagnosis under complex service conditions:
First, most methods rely on the ideal assumption of consistent distribution between training and test data, which fails in practical variable-speed and variable-load conditions, causing severe domain shift, negative transfer, and diagnostic accuracy degradation.
Second, multi-fault coupling in compound faults causes modulation and aliasing of fault characteristic frequencies, while early weak fault features are easily submerged in strong noise and gear meshing components. Most existing deep models focus on global time-domain feature learning, lacking targeted enhancement for fault-sensitive frequency bands and with insufficient physical interpretability of extracted features, limiting their industrial application in strong noise scenarios.
Third, industrial fault data is generally imbalanced and scarce, and most existing methods require massive labeled samples for model training.
To address the above limitations, future research will focus on the continuous improvement of intelligent fault diagnosis methods, with emphasis on the development of the following three approaches: Adaptive Fusion Domain Cyclic Variational Generative Adversarial Network (AFDC-VGAN), Wavelet Integrated Residual Frequency Attention Regularization Network (WIR-FARN) and Theil Index-based Meta-Learning Network (TI-MLN), to provide novel technical solutions for high-precision compound fault diagnosis of gearboxes under complex service environments.
1.4. Scope of this study
A new method for gear and bearing single fault and compound fault diagnosis is proposed in this paper. Five states set on the test platform were analyzed: healthy state (state I); one tooth breakage of fixed-axle gear (state II); one tooth breakage of planetary gear and bearing rolling element damage (state III); planetary gear wear and rolling bearing outer ring damage (state IV); fixed-axle gear crack on root of tooth, planetary gear wear and bearing outer ring damage (state V).
The proposed method consists of the following parts: signal acquisition, signal preprocessing, fast Fourier transform (FFT) of the signal, feature extraction, and feature classification. The proposed method Wilcoxon rank-sum tests and maximum amplitude selection (WTMAS) is used as the feature extraction method. Feature classification is performed using KNN [32] (K-Nearest Neighbor). The experimental results show that the method has high accuracy in different types of fault identification and is a practical gearbox fault diagnosis method.
The core novelty of this work is that the non-parametric Wilcoxon rank-sum test is introduced into the field of gearbox compound fault diagnosis for the first time, which can accurately locate the frequency points with significant differences between healthy and fault state spectra, extract the unique frequency components of faults, and realize high-precision diagnosis of multiple single and compound gearbox faults combined with the KNN classifier.
1.5. Main contributions of this study
1. A novel vibration signal feature extraction method based on Wilcoxon rank-sum test and maximum amplitude selection is proposed, which can effectively characterize the fault features of gearboxes under both single and compound faults.
2. Five kinds of gearbox health states are constructed, including healthy condition, single fault and multiple compound faults, realizing the accurate classification and identification of faults involving parallel gears, planetary gears and bearings.
3. Combined with the KNN classifier, the proposed feature extraction method forms a complete fault diagnosis framework. The average recognition rate reaches 95.6 % on the experimental dataset, providing an effective solution for gearbox compound fault diagnosis.
2. Proposed fault diagnosis method
2.1. Method overview
In this paper, a novel feature extraction method named Wilcoxon rank-sum Test combined with Maximum Amplitude Selection (WTMAS) is proposed. As a non-parametric statistical approach, the Wilcoxon rank-sum test is applicable to scenarios with arbitrary population distribution, and is used to test whether there is a statistically significant difference in the distribution location between the populations corresponding to two groups of comparative experimental data. The detailed calculation procedure of the Wilcoxon rank-sum test is as follows:
(1) The two groups of data to be tested (or the absolute values of the data) are mixed and sorted in ascending order. The sorted data are numbered sequentially, and the serial number of each data point is defined as its rank.
(2) The ranks of the two groups of observed data are summed separately to obtain the rank sum of each group.
(3) The significance level (P-value threshold) is pre-set, and the relationship between the two groups of observed data is determined via the critical value table of the rank sum. If the calculated P-value meets the pre-set significance criterion, a statistically significant difference exists between the two groups of observed data; otherwise, no significant difference is confirmed.
Vibration signals generated during equipment operation contain abundant state information of the mechanical system. Specifically, vibration signals from the same equipment under different operating conditions present unique morphological characteristics, which can be used as the basis for distinguishing different operating states. Therefore, the operating condition of the equipment can be identified through morphological analysis of vibration signals.
The power spectra of vibration signals collected from the same equipment under the same operating condition (healthy or fault condition) share similar frequency components, while significant differences exist between the power spectra of signals under different operating conditions. Since the vibration signals acquired by sensors are discrete signals, their power spectra are composed of a finite number of data points. Thus, different data points can be used to characterize the differences between signals, describe the unique frequency components corresponding to different operating conditions, and further represent the operating state of the equipment. In the feature extraction process, the power spectrum of vibration signals under the healthy condition is taken as the baseline. The unique frequency components corresponding to each fault mode can be selected according to the significant differences between the power spectra of fault and healthy conditions. Accordingly, the Wilcoxon rank-sum test is adopted to analyze the spectral differences of vibration signals.
The implementation steps of the WTMAS method for feature extraction are described as follows:
(1) The power spectrum of signals under the healthy condition is set as the non-target sample, while the power spectrum of signals under other operating conditions is set as the target sample. The data points corresponding to the same frequency in each sample are regarded as the same feature, and the data points corresponding to the same feature form a group of feature vectors.
(2) The reference P-value (significance threshold) is pre-set, and the rank-sum test is performed on each group of feature vectors separately to calculate the P-value of each feature vector.
(3) The P-value of each group of feature vectors is compared with the reference P-value. If the P-value of the feature vector is lower than the reference P-value, it indicates that the group of feature vectors has a statistically significant difference, and this group of vectors is retained for the subsequent operation. Otherwise, the group of feature vectors with no significant difference is nullified by setting the corresponding values to zero.
(4) The entire frequency points obtained from the previous step are equally partitioned into 100 non-overlapping frequency bands. Specifically, each frequency band consists of a fixed and equal number of consecutive adjacent frequency points, with the number of points per band equals the total number of frequency points divided by 100. The amplitude of each frequency band is defined as the sum of the amplitudes of all frequency points within the corresponding band, and the 100 generated frequency bands are taken as the final result of the feature selection.
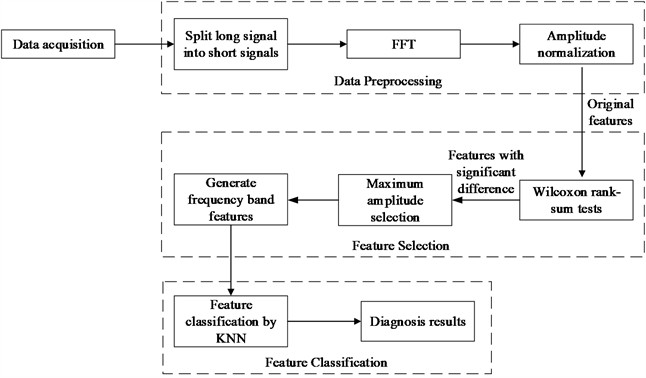
2.2. System architecture
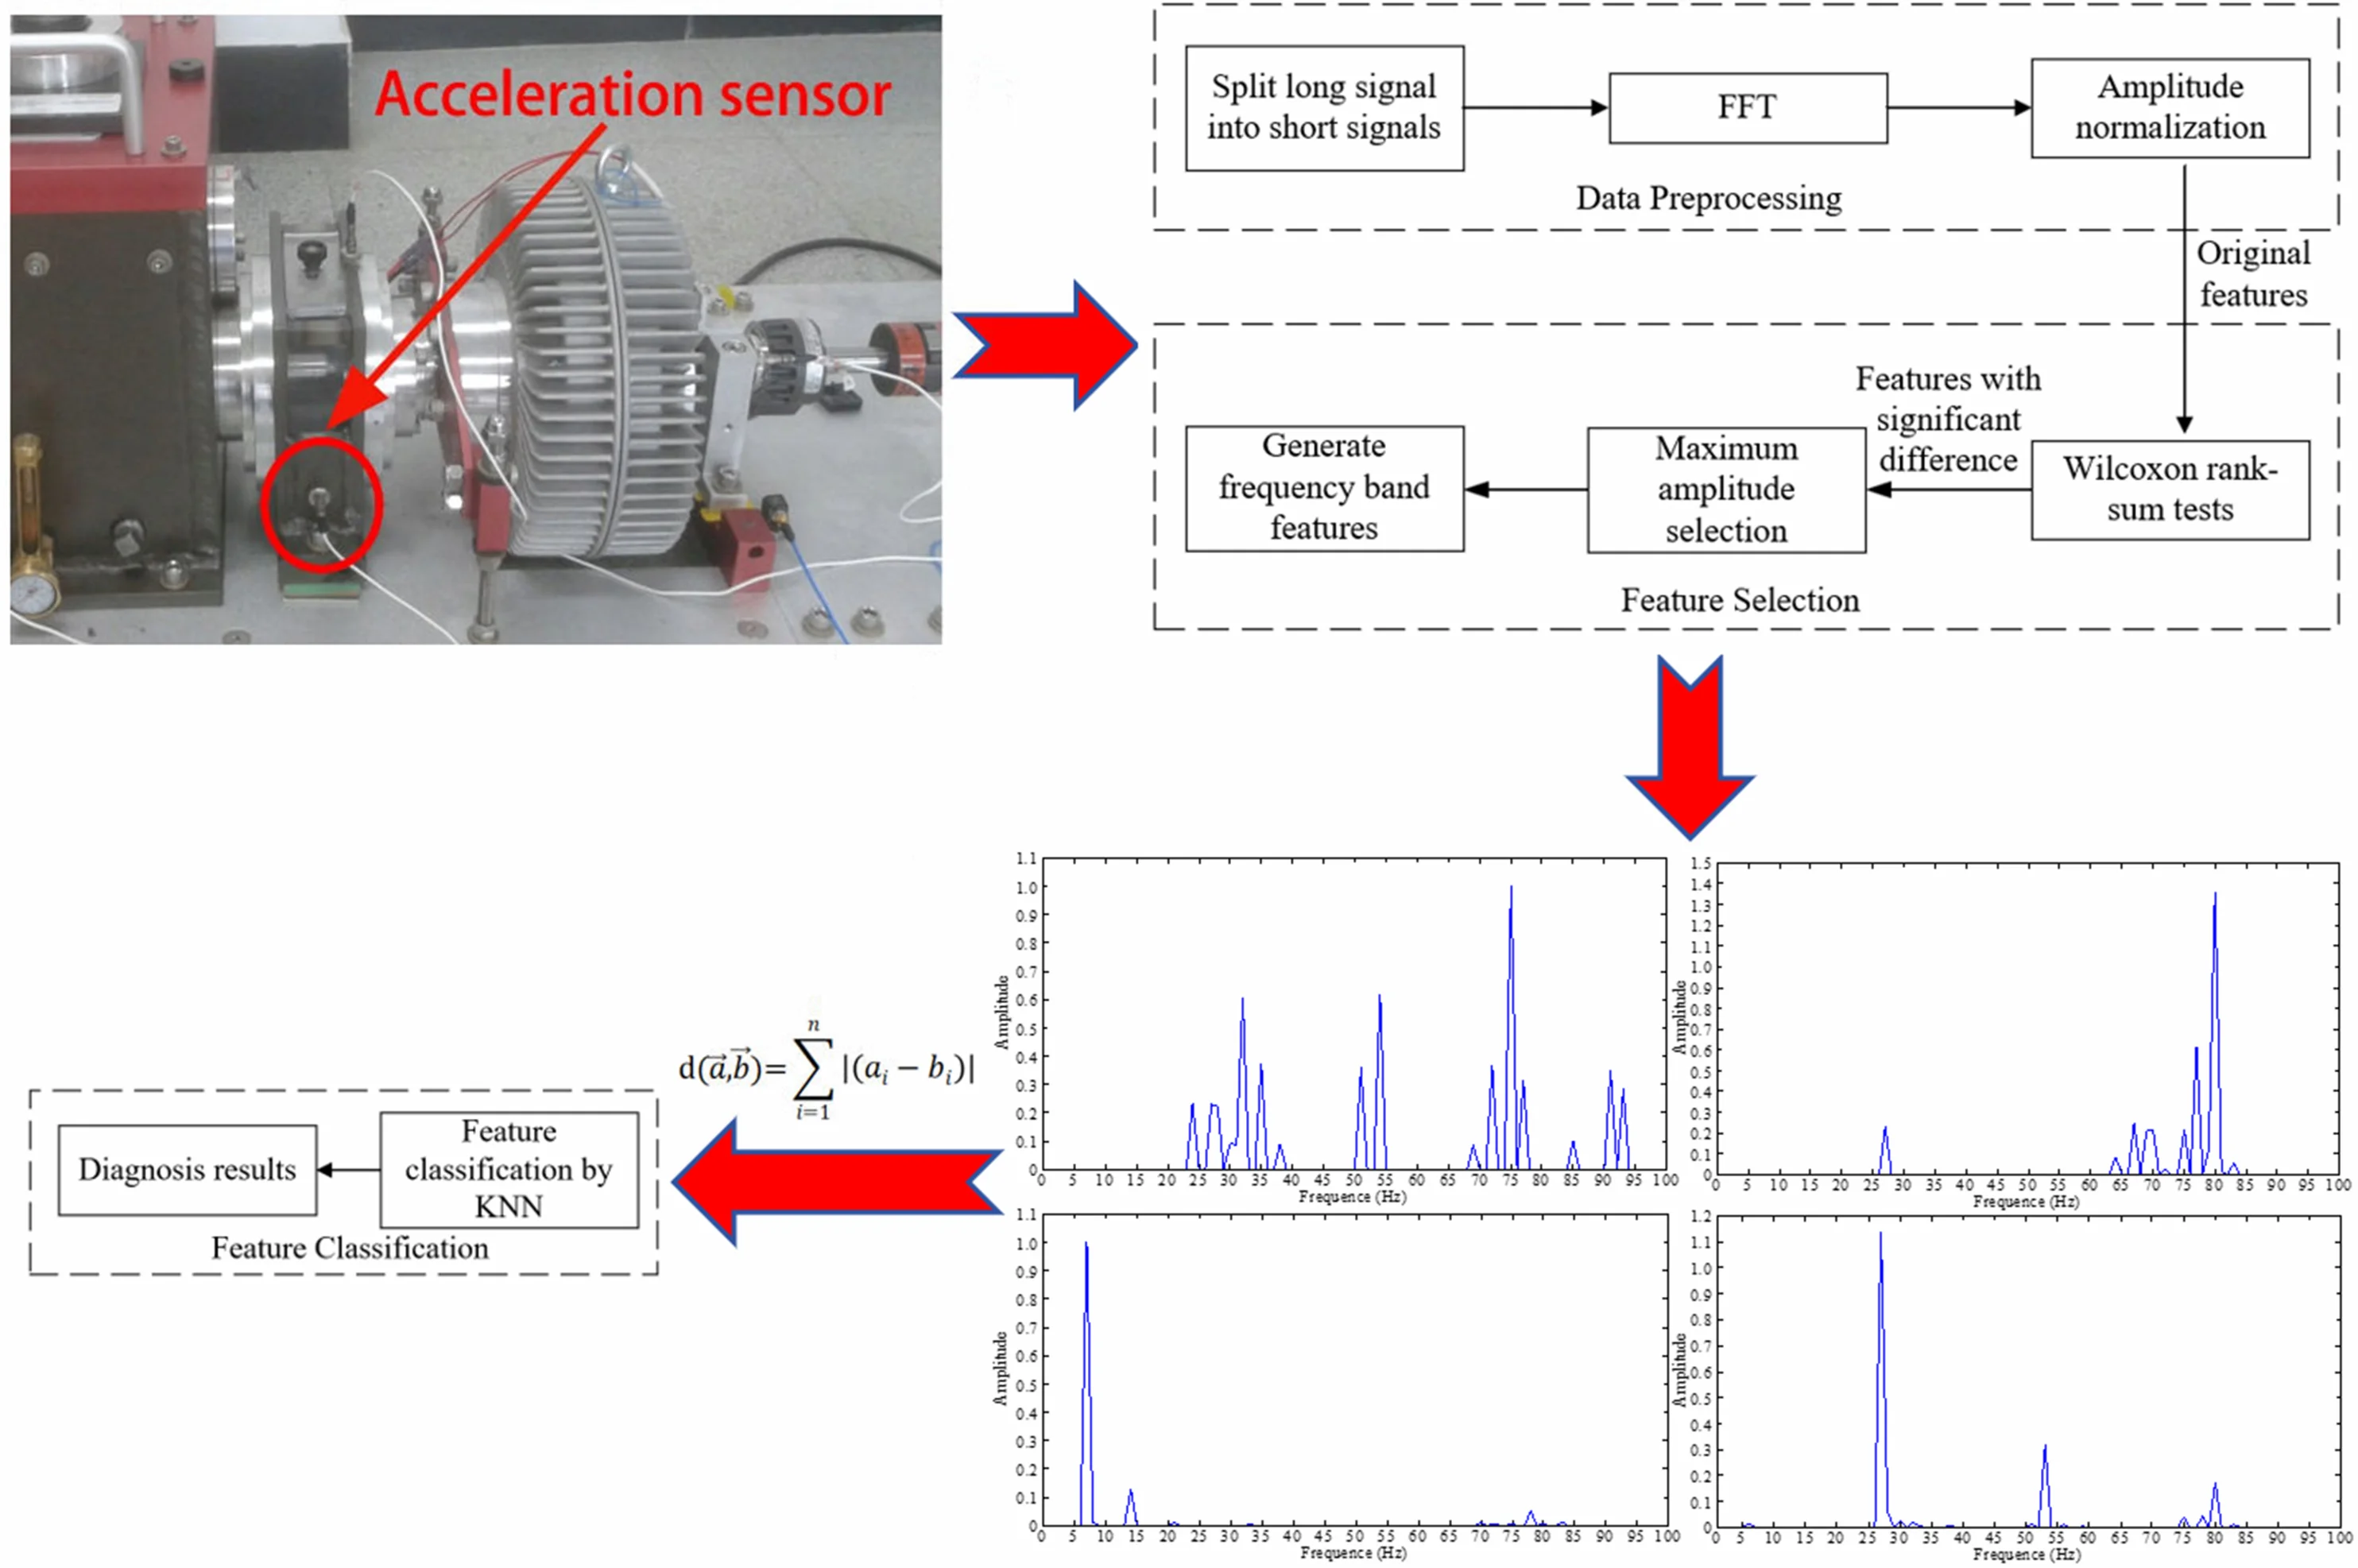
The flowchart of the proposed method is shown in Fig. 1. The method consists of two parts: the generation of training samples and test samples; fault identification and classification. The sample generation includes data acquisition, data preprocessing (split the long signal collected from the test bench to abtain short signals, FFT for each short signal to obtain frequency spectrum signals, and amplitude normalization for each frequency spectrum signal), and Wilcoxon rank-sum tests and maximum amplitude selection (WTMAS) for feature extraction. The KNN method is used for fault identification and classification.
Fig. 1Signal flowchart of the proposed method
The diagnostic workflow of the proposed method is illustrated in Fig. 1, which comprises three core functional modules: vibration signal preprocessing, feature extraction, and feature classification. Specifically, raw long-term vibration signals acquired from the test rig are first segmented into multiple short subsequences, followed by Fast Fourier Transform (FFT) for spectrum generation and amplitude normalization for each spectrum. Subsequently, the Wilcoxon rank-sum test and maximum amplitude selection are performed on the preprocessed spectra to extract fault-sensitive frequency band features explicitly associated with specific fault modes. Finally, the K-nearest neighbor (KNN) classifier is employed to achieve accurate identification and classification of the extracted feature vectors.
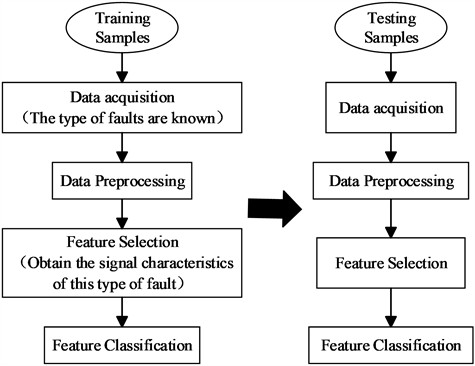
The implementation of the proposed method is divided into two sequential phases, as illustrated in Fig. 2. The first is the sample training phase: vibration signals with known fault modes are processed following the procedure shown in Fig. 1, and labels are assigned according to the corresponding operating conditions. Specifically, five operating conditions are considered in this work, corresponding to five labels denoted as a to e, with each label uniquely matching one specific operating condition. The second is the sample testing phase: vibration signals under unknown operating conditions are fed into the established diagnostic system, processed via the identical workflow shown in Fig. 1, and matched against the labeled feature reference library built in the training phase. The corresponding operating condition label is then assigned to the test sample, thus yielding the final diagnostic result.
Fig. 2The implementation workflow of the proposed method
2.3. Data acquisition
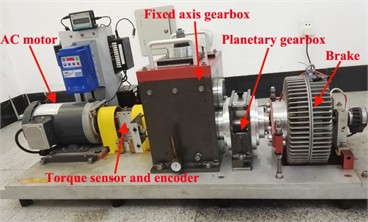
The experiment was performed on the WTDS2010 test platform, which is developed by the US SpectraQuest Corporation as shown in Fig. 3. WTDS2010 is a comprehensive test platform for fault diagnosis of gearbox transmission, which contains replacement parts of fault gears and bearings. The test platform consists of two-stage fixed axis gear train and a planetary gear train, and the planetary gear train consists of three planetary gears. A variable frequency AC motor is used to drive the test platform.
Fig. 3WTDS2010 test platform. Photo by authors in Tiangong University, Tianjin, China, 2024
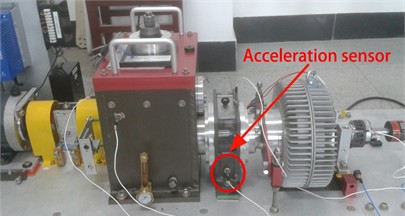
The basic state of the test platform is health state, and different fault states can be set by replacing the fault parts. A PCB accelerometer is attached on the outer shell of planetary gear train in the radial direction paralleling to the base to measure the vibration signal. The sampling frequency is set to 3000 Hz, and the installation location of accelerometer is shown in Fig. 4.
Fig. 4Installation location of acceleration sensor. Photo by authors in Tiangong University, Tianjin, China, 2024
2.4. Data preprocessing
The long vibration signals were split into short signals with a duration of 1 second. The fast Fourier transform (FFT) was performed on all the short signals to obtain their frequency spectrum vectors, and all the vectors were used for feature extraction. Since the sampling frequency is 3000 Hz, the effective frequency component is 1 to 1500 Hz, and each spectrum vector has 1500 feature points. The point with maximum amplitude was extracted from the 1500 feature points of each spectrum vector. The corresponding amplitude of each point was divided by the maximum amplitude, then the normalized spectrum vector was obtained.
2.5. Feature extraction and classification
2.5.1. Feature extraction
The frequency spectrum of the same fault state on the same equipment has similar frequency components, but there are significant differences between frequency spectrums of fault state and health state. In the feature extraction process, the unique frequency components of each kind of fault signal can be selected by the significant differences between frequency spectrums of fault state and health state. So the Wilcoxon rank-sum tests can be used to analyze the differences between the frequency spectrums of vibration signals [33].
WTMAS is used as feature extraction method. Wilcoxon rank-sum tests is to test whether there is a significant difference in the overall distribution of paired test data in the case where the overall distribution is arbitrary. The frequency points with significant differences between each fault state and health state can be selected by Wilcoxon rank-sum tests.
It is necessary to determine the target samples and non-target samples when using Wilcoxon rank-sum tests, to obtain the points whose significant difference between target samples and non-target samples meet the requirements. In the proposed method, the number of non-target samples and target samples are the same. The non-target samples are frequency spectrum vectors of the health state, and the target samples are frequency spectrum vectors of the fault states.
The Wilcoxon rank-sum tests is used to find the significant difference between the frequency spectrums of fault state and health state. Each target sample has 1500 feature points. The fault characteristics are not obvious due to noise interference. The purpose of Wilcoxon rank-sum tests is to calculate the P value of each set of feature points among 1500 set of points, and the amplitude of the feature point that does not meet the range of P value is assigned to zero, thereby extracting the points with significant difference from frequence spectrum of health state in frequence spectrum of fault state. The significance difference level P is set to 0.001.
In order to improve the diagnostic accuracy and reduce the diagnostic error, after Wilcoxon rank-sum tests, 1500 frequency points are equally divided into 100 frequency bands. Each adjacent 15 frequency points form one frequency band, and the sum of the amplitudes corresponding to the 15 frequency points is the amplitude of the frequency band. The frequency spectrum band feature samples of each state can be obtained by the above method, of which the training samples of healthy state are all zero vectors, and the training samples of other states are non-zero vectors.
2.5.2. Feature classification
KNN method is used for feature classification. KNN classification algorithm is one of the commonly used methods in data mining classification technology. It can be applied to many applications, such as signal processing, image processing, medical data mining, prediction, text recognition, genome data analysis, and economic analysis. KNN classifies by measuring the distance between different eigenvalues. The main computational procedure is as follows:
1) Calculate the distances between the test samples and each training samples.
2) Sort the distances according to the increasing relationship.
3) Select the K points with the smallest distance.
4) Determine the frequency of occurrence of the top K points in the category.
5) Return the category with the highest frequency among the top K points as the prediction classification of the test samples.
The similar distances are used by KNN to classify feature vectors. The commonly used of similar distances are: Euclidean distance, cosine, correlation, Manhattan distance. The Manhattan distance used in this paper is defined as follows:
where, is training sample, and is test sample.
3. Experiment design
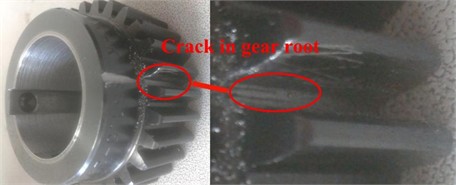
Five states were set on the test platform, respectively: healthy state (state I); one tooth breakage of fixed-axle gear (state II); one tooth breakage of planetary gear and bearing rolling element damage (state III); planetary gear wear and rolling bearing outer ring damage (state IV); fixed-axle gear crack on root of tooth, planetary gear wear and bearing outer ring damage (state V). The vibration signals of the five states were collected respectively. The faulty parts are shown in Figs. 5-9.
Fig. 5Planetary gear wear. Photo by authors at Tiangong University, Tianjin, China, 2024
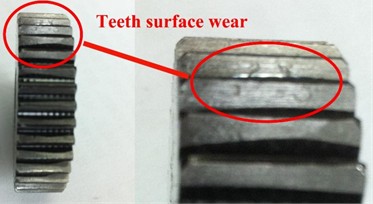
Fig. 6One tooth breakage of fixed-axle gear. Photo by authors at Tiangong University, Tianjin, China, 2024
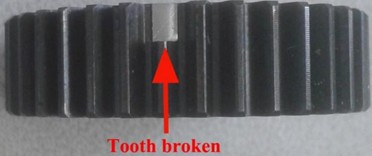
Fig. 7Bearing rolling element damage. Photo by authors at Tiangong University, Tianjin, China, 2024
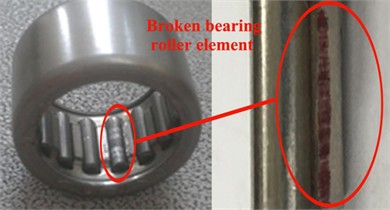
Fig. 8Bearing outer ring damage. Photo by authors at Tiangong University, Tianjin, China, 2024
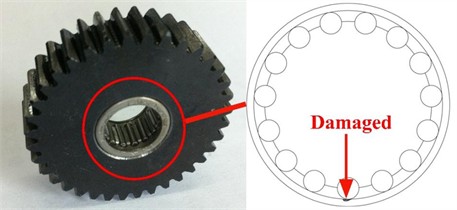
Fig. 9Fixed-axle gear crack on root of tooth. Photographed at Tiangong University, Tianjin, China, 2024
The rotating speed of AC motor was 2400 r/min, and the sampling frequency was set to 3000 Hz. The vibration signal was obtained after the test platform operating stably. In order to distinguish between training data and test data, the signals were collected three times for each state, with an interval of one hour per acquisition. The first sampling time was 20 seconds, and the other two sampling times were 60 seconds. The long signal was splited into short signals with a length of 1 second, which was used as training data and test data: splitting the 5 to 15 second segment of the first sampling signal as training data; splitting the 5 to 55 second segment of the other two sampling signals respectively as test data. Thus, 10 sets of 1 second long training data and 100 sets of 1 second long test data are obtained for each state.
4. Experimental signal analysis
Taking one short signal of each state as an example, the spectrum vectors of the five states can be expressed as:
– The frequency spectrum of the state I is defined as vector .
– The frequency spectrum of the state II is defined as vector .
– The frequency spectrum of the state III is defined as vector .
– The frequency spectrum of the state IV is defined as vector .
– The frequency spectrum of the state V is defined as following vector .
Find the element with maximum amplitude in the spectrum vector of each short signal above. The maximum element corresponding to the frequency spectrum of the five states are , , , , and , respectively. Dividing the frequency spectrum vector by the maximum element corresponding to which to obtain the normalized frequency spectrum vector:
For the five states, each set of training samples consists of ten frequency band vectors. For the signal of health state, it is considered that there is no significant difference between the target sample and the non-target sample, so the feature vector of the health state training sample is zero vector. For the other four fault states, ten normalized training datas of health state are used as non-target samples:
ten normalized training datas of each fault state are used as target samples, respectively:
where the subscript “trta” means “traning target”, and “trnor” means “training normalization”.
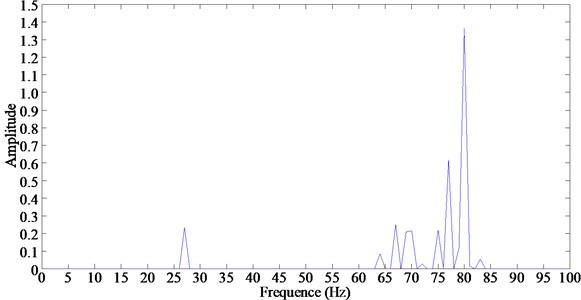
Calculated by the WTMAS, a training sample consisting of 40 frequency band vectors is obtained. 10 zero vectors of state I and each 10 non-zero vectors of state II~ state V after feature extraction are arranged together in order to form a complete set of training samples. Fig. 10 to Fig. 13 show the frequency band spectrum of the four fault states.
Fig. 10The frequency band spectrum of state II
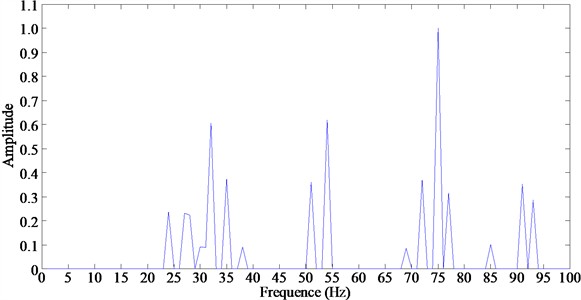
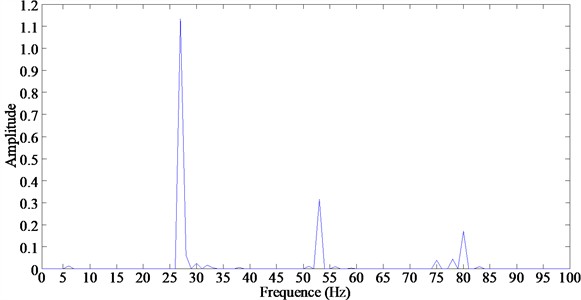
Fig. 11The frequency band spectrum of state III
The same non-target samples are used as training samples when generating the test samples. The purpose of sample test is to simulate the case where the fault state is unknown, to test the reliability of the proposed method. Therefore, the zero vectors are not used as test samples of the health state, but the test datas of the health state are taken as the target samples for feature extraction. Ten test datas are formed as one group for feature extraction, so the test datas of each state can be divided into ten groups, respectively. One group of normalized test datas of each state can be defined as:
where the subscript “teta” means “test target”, and “tenor” means “test normalization”.
The vectors are used as non-target samples, and the standardized ten sets of test datas are used as target samples. Then 100 test samples of each state can be obtained after calculating by WTMAS.
Fig. 12The frequency band spectrum of state IV
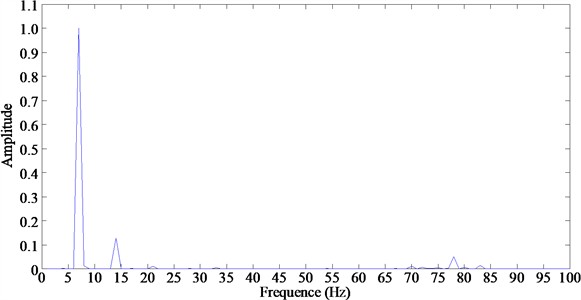
Fig. 13The frequency band spectrum of state V
5. Results and analysis
The obtained training samples and test samples were brought into the KNN algorithm for feature classification and fault identification. The diagnosis results are shown in Table 1.
It can be seen in Table 1, the recognition rate for health state is 99.854 %; the recognition rate for one tooth breakage of fixed-axle gear is 98.305 %; the recognition rate for one tooth breakage of planetary gear and bearing rolling element damage is 99.837 %; the recognition rate for planetary gear wear and rolling bearing outer ring damage is 90.447 %, the recognition rate for fixed-axle gear crack on root of tooth, planetary gear wear and bearing outer ring damage is 90.324 %, and the average recognition rate of the proposed method for the five states is 95.753 %.
To quantitatively evaluate the gearbox fault diagnosis performance of the proposed model, four widely recognized quantitative metrics, namely Accuracy, Precision, Recall and F1-score, are adopted to verify the effectiveness of the model. The mathematical definitions of these metrics are given as follows:
where, True Positive (TP), False Positive (FP), False Negative (FN) and True Negative (TN) denote the number of samples corresponding to each classification outcome, respectively. Specifically, TP represents positive samples correctly classified as positive by the proposed diagnostic model, FP represents negative samples incorrectly classified as positive, FN represents positive samples incorrectly classified as negative, and TN represents negative samples correctly classified as negative. The performance metrics of the proposed WTMAS method are summarized in Table 2.
Table 1Diagnosis results
State type | Diagnosis accuracy |
Healthy state (State I) | 99.854 % |
One tooth breakage of fixed-axle gear (State II) | 98.305 % |
One tooth breakage of planetary gear and bearing rolling element damage (State III) | 99.837 % |
Planetary gear wear and rolling bearing outer ring damage (State IV) | 90.447 % |
Fixed-axle gear crack on root of tooth, planetary gear wear and bearing outer ring damage (State V) | 90.324 % |
Average recognition rate | 95.753 % |
Table 2The performance metrics of WTMAS method
State type | Accuracy | Precision | Recall | F1 |
State I | 0.99854 | 0.99881 | 0.99832 | 0.99856 |
State II | 0.98305 | 0.98332 | 0.98305 | 0.98318 |
State III | 0.99837 | 0.98376 | 0.99478 | 0.98924 |
State IV | 0.90447 | 0.90797 | 0.90747 | 0.90772 |
State V | 0.90324 | 0.90994 | 0.90783 | 0.90888 |
As calculated from the data presented in Table 2, the proposed WTMAS method achieves high Accuracy in gearbox fault classification. This indicates that the diagnostic model can correctly identify various fault modes under most operating conditions, demonstrating the excellent stability and reliability of the model in overall classification performance.
The high Precision of the proposed method verifies that the vast majority of samples predicted as fault conditions are real fault samples, reflecting the low false alarm rate of the model in practical fault diagnosis scenarios.
In addition, the high Recall achieved by the model confirms its capability to identify nearly all real fault samples, which effectively avoids missed fault detection and improves the fault detection capability in practical engineering applications. Overall, the proposed method exhibits comprehensive and superior performance in gearbox fault diagnosis, and has high engineering application value.
6. Conclusions
Aiming at the industry pain points of difficult extraction of multi-source coupling features of gearbox compound faults, and the strong dependence of traditional diagnostic methods on manual experience and prior knowledge of signals, this paper proposes an intelligent gearbox fault diagnosis method based on Wilcoxon rank-sum Test combined with Maximum Amplitude Selection (WTMAS). Taking the spectrum of vibration signals under the healthy condition of the gearbox as the baseline, the proposed method screens the frequency points with statistically significant differences between healthy and fault conditions through the non-parametric Wilcoxon rank-sum test to extract fault-sensitive features, and constructs a diagnostic framework combined with the K-nearest neighbor (KNN) classifier to achieve accurate identification of single faults and multi-component coupled compound faults of gearboxes. Verified by gearbox fault simulation experiments, the core conclusions of this paper are obtained as follows:
1) As a non-parametric statistical method, the Wilcoxon rank-sum test does not require prior assumptions on the signal distribution. It can accurately identify the frequency points with statistically significant differences between the spectrum signals of the healthy state and various fault states of the gearbox, and effectively locate the exclusive characteristic frequency components corresponding to different fault modes, which provides reliable statistical theoretical support for the extraction of gearbox fault-sensitive features.
2) The diagnostic framework constructed by the fault-sensitive features extracted based on the WTMAS method combined with the KNN classifier can efficiently realize the intelligent identification and classification of multiple gearbox fault modes without complex manual feature engineering and deep model training. The method has the advantages of simple implementation, high computational efficiency and strong robustness.
3) The proposed WTMAS diagnostic method achieves excellent and stable diagnostic performance under five typical working conditions, including healthy condition, single fault of parallel gear tooth breakage, compound fault of planetary gear tooth breakage and bearing rolling element damage, compound fault of planetary gear wear and bearing outer race damage, and triple compound fault of parallel gear tooth root crack, planetary gear wear and bearing outer race damage. Especially, it has good feature decoupling and identification ability for compound faults with multi-component coupling, which solves the industry pain point of difficult extraction of coupling features of compound faults.
The experimental results demonstrate that the proposed WTMAS method in this paper is an efficient and reliable feature extraction method for gearbox fault diagnosis. The diagnostic framework combined with the KNN classifier can achieve high-precision diagnosis of single and compound gearbox faults, which provides a new feasible solution for intelligent condition monitoring and fault diagnosis of gearboxes in industrial scenarios, and has good engineering application prospects.
7. Future work
Future research can be further deepened and extended from multiple dimensions. On the one hand, the coverage of fault modes can be expanded, and multi-source monitoring signals including vibration, temperature and current can be fused under complex engineering operating conditions such as variable speed and variable load, so as to enhance the robustness and adaptability of the proposed method in complex service environments. On the other hand, the Wilcoxon rank-sum Test combined with Maximum Amplitude Selection (WTMAS) feature extraction strategy proposed in this paper can be deeply integrated with state-of-the-art algorithms such as deep learning and transfer learning, to construct a diagnostic model with stronger generalization ability and effectively address the diagnostic challenges in small-sample and cross-equipment scenarios. Meanwhile, the architecture design of the classifier can be optimized to promote the evolution of the model towards lightweight and real-time implementation, providing technical support for on-site online fault diagnosis and real-time early warning in engineering applications. In addition, the research boundary can be further expanded from the current fault mode identification to quantitative assessment of fault severity and remaining useful life (RUL) prediction, realizing the leap from passive fault diagnosis to active health state prediction and full life cycle management. The proposed diagnostic method can also be extended to other types of rotating machinery such as motors, pumps and fans, to comprehensively improve its engineering application value and universality.
References
-
X. Zhao, K. Lv, Z. Zhang, Y. Zhang, and Y. Wang, “A multi-fault diagnosis method of gear-box running on edge equipment,” Journal of Cloud Computing, Vol. 9, No. 1, Oct. 2020, https://doi.org/10.1186/s13677-020-00205-7
-
Q. Shang et al., “Fault diagnosis of marine electric thruster gearbox based on MPDCNN under strong noisy environments,” (in Chinese), Chinese Journal of Ship Research, Vol. 20, No. 2, pp. 30–38, 2025, https://doi.org/10.19693/j.issn.1673-3185.03814
-
L. O. Felix, D. H. C. de Sá Só Martins, U. A. B. V. Monteiro, L. A. V. Pinto, L. Tarrataca, and C. A. O. Martins, “Multiple Fault diagnosis in a wind turbine gearbox with autoencoder data augmentation and KPCA dimension reduction,” Journal of Nondestructive Evaluation, Vol. 43, No. 4, Oct. 2024, https://doi.org/10.1007/s10921-024-01131-3
-
Z. Ye, S. Yue, P. Yang, R. Zhou, and J. Yu, “Deep morphological shrinkage convolutional autoencoder-based feature learning of vibration signals for gearbox fault diagnosis,” IEEE Transactions on Instrumentation and Measurement, Vol. 73, pp. 1–12, Jan. 2024, https://doi.org/10.1109/tim.2024.3366570
-
L. Ding, H. Guo, and L. Bian, “Convolutional neural networks based on resonance demodulation of vibration signal for rolling bearing fault diagnosis in permanent magnet synchronous motors,” Energies, Vol. 17, No. 17, p. 4334, Aug. 2024, https://doi.org/10.3390/en17174334
-
W. Liu, Z. Zhang, Z. Ye, and Q. He, “A novel intelligent fault diagnosis method for gearbox based on multi-dimensional attention denoising convolution,” Scientific Reports, Vol. 14, No. 1, p. 12345, Oct. 2024, https://doi.org/10.1038/s41598-024-75522-x
-
X. Dong, G. Niu, H. Wang, and H. Oh, “Convenient gearbox fault diagnosis under random variable speeds: A motor current nonlinear harmonic approach,” Mechanical Systems and Signal Processing, Vol. 225, p. 112290, Feb. 2025, https://doi.org/10.1016/j.ymssp.2024.112290
-
G. Niu, X. Dong, and Y. Chen, “Motor fault diagnostics based on current signatures: a review,” IEEE Transactions on Instrumentation and Measurement, Vol. 72, pp. 1–19, Jan. 2023, https://doi.org/10.1109/tim.2023.3285999
-
X. Chen and Z. Feng, “Time-frequency space vector modulus analysis of motor current for planetary gearbox fault diagnosis under variable speed conditions,” Mechanical Systems and Signal Processing, Vol. 121, pp. 636–654, Apr. 2019, https://doi.org/10.1016/j.ymssp.2018.11.049
-
F. Cheng, Y. Peng, L. Qu, and W. Qiao, “Current-based fault detection and identification for wind turbine drivetrain gearboxes,” IEEE Transactions on Industry Applications, Vol. 53, No. 2, pp. 878–887, Mar. 2017, https://doi.org/10.1109/tia.2016.2628362
-
S. Yang, H. Xu, Y. Wang, J. Chen, and C. Li, “Fault diagnosis of wind turbine with few-shot learning based on acoustic signal,” Engineering Research Express, Vol. 7, No. 1, p. 015516, Mar. 2025, https://doi.org/10.1088/2631-8695/ada5ac
-
F. Tu, T. Zhang, T. Liu, D. Zhang, and S. Yang, “A novel acoustic-based framework for compound fault diagnosis in rotating machinery with limited samples,” IEEE Transactions on Instrumentation and Measurement, Vol. 74, pp. 1–15, Jan. 2025, https://doi.org/10.1109/tim.2025.3551919
-
Y. Li, X. Cao, H. Wang, K. Yu, and Y. Zhang, “Industrial gearbox fault diagnosis based on vision transformer and infrared thermal imaging,” in Mechanisms and Machine Science, pp. 16–24, Oct. 2024, https://doi.org/10.1007/978-3-031-73407-6_2
-
X. Du, S. Si, and Y. Li, “Fault diagnosis of gearbox based on convolutional neural network and infrared thermal imagining,” in Prognostics and System Health Management Conference (PHM-Qingdao), Oct. 2019, https://doi.org/10.1109/phm-qingdao46334.2019.8942855
-
L. Zhang and N. Hu, “Fault diagnosis of sun gear based on continuous vibration separation and minimum entropy deconvolution,” Measurement, Vol. 141, pp. 332–344, Jul. 2019, https://doi.org/10.1016/j.measurement.2019.04.049
-
L. Wang, Y. Shao, and Z. Cao, “Optimal demodulation subband selection for sun gear crack fault diagnosis in planetary gearbox,” Measurement, Vol. 125, pp. 554–563, Sep. 2018, https://doi.org/10.1016/j.measurement.2018.05.023
-
M. Zhang, K. Liang, Y. Miao, J. Lin, and C. Ding, “Application of improved double-dictionary K-SVD for compound-fault diagnosis of rolling element bearings,” Measurement, Vol. 187, p. 110168, Jan. 2022, https://doi.org/10.1016/j.measurement.2021.110168
-
Y. Cheng, Z. Wang, B. Chen, W. Zhang, and G. Huang, “An improved complementary ensemble empirical mode decomposition with adaptive noise and its application to rolling element bearing fault diagnosis,” ISA Transactions, Vol. 91, pp. 218–234, Aug. 2019, https://doi.org/10.1016/j.isatra.2019.01.038
-
L. S. Dhamande and M. B. Chaudhari, “Compound gear-bearing fault feature extraction using statistical features based on time-frequency method,” Measurement, Vol. 125, pp. 63–77, Sep. 2018, https://doi.org/10.1016/j.measurement.2018.04.059
-
G. Tang, X. Wang, and Y. He, “Diagnosis of compound faults of rolling bearings through adaptive maximum correlated kurtosis deconvolution,” Journal of Mechanical Science and Technology, Vol. 30, No. 1, pp. 43–54, Jan. 2016, https://doi.org/10.1007/s12206-015-1206-7
-
Y. Song, S. Zeng, J. Ma, and J. Guo, “A fault diagnosis method for roller bearing based on empirical wavelet transform decomposition with adaptive empirical mode segmentation,” Measurement, Vol. 117, pp. 266–276, Mar. 2018, https://doi.org/10.1016/j.measurement.2017.12.029
-
G. Cai, X. Chen, and Z. He, “Sparsity-enabled signal decomposition using tunable Q-factor wavelet transform for fault feature extraction of gearbox,” Mechanical Systems and Signal Processing, Vol. 41, No. 1-2, pp. 34–53, Dec. 2013, https://doi.org/10.1016/j.ymssp.2013.06.035
-
D. Yu, M. Wang, and X. Cheng, “A method for the compound fault diagnosis of gearboxes based on morphological component analysis,” Measurement, Vol. 91, pp. 519–531, Sep. 2016, https://doi.org/10.1016/j.measurement.2016.05.087
-
Z. Li, X. Yan, Z. Tian, C. Yuan, Z. Peng, and L. Li, “Blind vibration component separation and nonlinear feature extraction applied to the nonstationary vibration signals for the gearbox multi-fault diagnosis,” Measurement, Vol. 46, No. 1, pp. 259–271, Jan. 2013, https://doi.org/10.1016/j.measurement.2012.06.013
-
H. Jiang, C. Li, and H. Li, “An improved EEMD with multiwavelet packet for rotating machinery multi-fault diagnosis,” Mechanical Systems and Signal Processing, Vol. 36, No. 2, pp. 225–239, Apr. 2013, https://doi.org/10.1016/j.ymssp.2012.12.010
-
D. Zhang and D. Yu, “Multi-fault diagnosis of gearbox based on resonance-based signal sparse decomposition and comb filter,” Measurement, Vol. 103, pp. 361–369, Jun. 2017, https://doi.org/10.1016/j.measurement.2017.03.006
-
R. Chen, X. Huang, L. Yang, X. Xu, X. Zhang, and Y. Zhang, “Intelligent fault diagnosis method of planetary gearboxes based on convolution neural network and discrete wavelet transform,” Computers in Industry, Vol. 106, pp. 48–59, Apr. 2019, https://doi.org/10.1016/j.compind.2018.11.003
-
M. Demetgul, K. Yildiz, S. Taskin, I. N. Tansel, and O. Yazicioglu, “Fault diagnosis on material handling system using feature selection and data mining techniques,” Measurement, Vol. 55, pp. 15–24, Sep. 2014, https://doi.org/10.1016/j.measurement.2014.04.037
-
G. Krishna Durbhaka, B. Selvaraj, M. Mittal, T. Saba, A. Rehman, and L. Mohan Goyal, “Swarm-LSTM: condition monitoring of gearbox fault diagnosis based on hybrid LSTM deep neural network optimized by swarm intelligence algorithms,” Computers, Materials and Continua, Vol. 66, No. 2, pp. 2041–2059, Jan. 2021, https://doi.org/10.32604/cmc.2020.013131
-
H. Zhang et al., “Fault diagnosis of gearbox compound fault based on multi-scale compound regularized convolutional sparse coding,” (in Chinese), Journal of Vibration, Measurement and Diagnosis, Vol. 43, No. 2, pp. 321–330, 2023, https://doi.org/10.16450/j.cnki.issn.1004-6801.2023.02.002
-
G. Li, L. He, Y. Ren, X. Li, J. Zhang, and R. Liu, “compound fault diagnosis of planetary gearbox based on improved LTSS-BoW model and capsule network,” Sensors, Vol. 24, No. 3, p. 940, Jan. 2024, https://doi.org/10.3390/s24030940
-
K. Yıldız, A. Buldu, and M. Demetgul, “A thermal-based defect classification method in textile fabrics with K-nearest neighbor algorithm,” Journal of Industrial Textiles, Vol. 45, No. 5, pp. 780–795, Oct. 2014, https://doi.org/10.1177/1528083714555777
-
T. Teng, L. Bi, and Y. Liu, “EEG-based detection of driver emergency braking intention for brain-controlled vehicles,” IEEE Transactions on Intelligent Transportation Systems, Vol. 19, No. 6, pp. 1766–1773, Jun. 2018, https://doi.org/10.1109/tits.2017.2740427
About this article

This work was supported by the College-level research project of Shijiazhuang Information Engineering Vocational College (2024-25-41).
The datasets generated during and/or analyzed during the current study are available from the corresponding author on reasonable request.
Xuan Lyu: conceptualization, project administration, writing original draft, preparation. Renfeng Zhang: data curation, validation. Shuo Feng: formal analysis, methodology. Xinqiang Li: software, writing review and editing.
The authors declare that they have no conflict of interest.
