Abstract
As one of the key components of transmission and support in rotating machinery, rolling bearings will directly affect the operating status of the equipment. Therefore, scholars have proposed various methods to process its fault signals. Among them, spectral amplitude modulation (SAM) is a nonlinear filtering method that can effectively extract bearing fault characteristics. However, due to the high-intensity noise interference in the working environment of the equipment, the interference component dominates the monitoring signal, and the fault characteristics are no longer obvious or even undetectable. To solve the above problems, this paper proposes a local W transform spectral amplitude (LWTSAM) modulation method. First, the method divides the original signal into multiple narrowband signals in different frequency bands and selects the narrowband signal with the most abundant fault information among them; then, the selected narrowband signal uses a windowed Fourier transform (WFT) to obtain the amplitude in the time-frequency domain, and uses different weight indices (MO) to correct the amplitude; Finally, the modified amplitude is combined with its original phase to perform inverse window Fourier transform to obtain the modified signal and its square envelope, and the square envelope under the optimal weight is calculated using unbiased autocorrelation and information entropy to complete the local W transform spectrum amplitude modulation. In this paper, this method is verified through fault data sets. The research results show that this method can effectively reduce the interference of noise on fault diagnosis, and the fault characteristic information obtained is clearer. Compared with SAM method, Autogram method and fast spectral kurtosis diagram method, the superiority of this method is proved.
Highlights
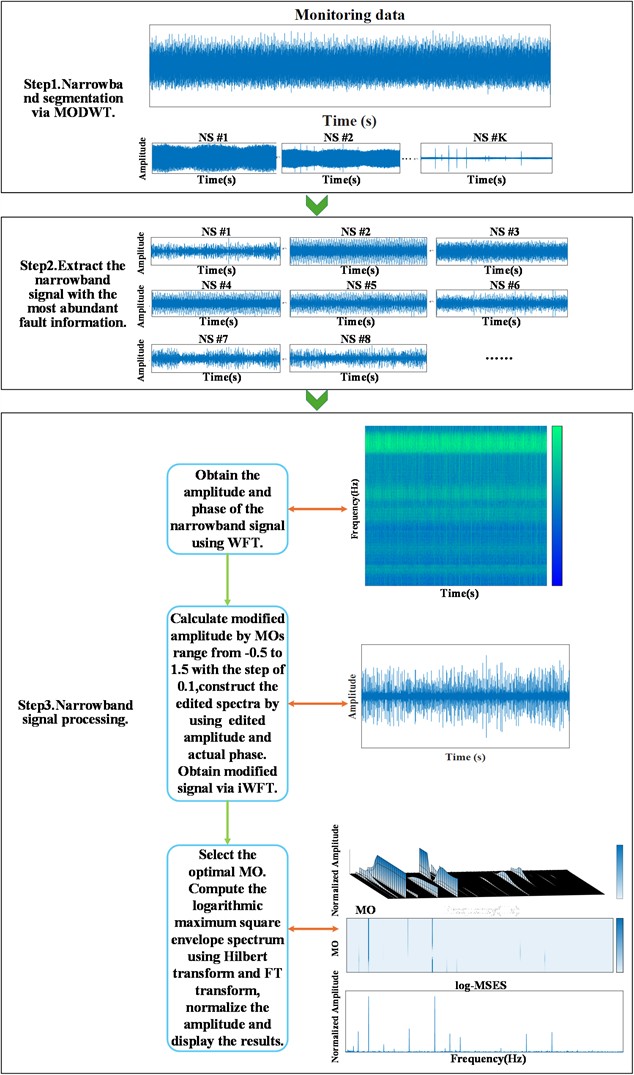
- The method divides the original signal into multiple narrowband signals in different frequency bands and selects the narrowband signal with the most abundant fault information among them.
- The selected narrowband signal uses a windowed Fourier transform (WFT) to obtain the amplitude in the time-frequency domain, and uses different weight indices (MO) to correct the amplitude.
- The modified amplitude and original phase are reconstructed via inverse WFT, and the optimal weight is selected using autocorrelation and entropy to achieve LWTSAM.
1. Introduction
As one of the key components in rotating machinery, rolling bearings need to withstand various dynamic loads and complex working conditions, and internal components are prone to failure [1, 2]. Once a failure occurs, major safety accidents will be caused, resulting in mechanical system failures and economic losses [3, 4], and even casualties. Therefore, bearing failures should be discovered as soon as possible to avoid accidents. However, due to the complex and diverse working environment, the collected vibration signals include a large amount of environmental noise and irrelevant pulses, making faults difficult to identify at the early stage. Therefore, the importance of identifying weak bearings under complex conditions is self-evident [5, 6].
In recent decades, bearing fault diagnosis has gradually developed into an important research field in academia and industry. Among the currently known fault diagnosis technologies, resonance demodulation technology [7] is undoubtedly one of the most classic methods, also known as envelope analysis. The corresponding fault information can be obtained by band-pass filtering the resonance band with high signal-to-noise ratio and then demodulating it using the Hilbert transform [8, 9]. However, the selection of the resonance band is a relatively empirical process and is difficult in practical engineering applications. In order to overcome this problem, Antoni and Randall [10-11] conducted a detailed and meaningful study of spectral kurtosis and proposed a more practical and faster method, Kurtogram [12]. In Kurtogram, a 1/3 binary tree filter bank is used to partition the spectrum and determine the best signal based on kurtosis. However, kurtosis is easily disturbed by noise and random pulses [13]. In order to improve its practical application capabilities, scholars have proposed a large number of improvement methods, such as Protrugram [14], Infogram [15], enhanced Kurtogram [16], improved Kurtogram [17], Autogram [18]. All of the above methods have achieved good results. In addition, other kurtosis methods based on period indicators have been proposed [19-23]. These methods can specify the frequency band in which the periodic component is located, and all suppress noise and irrelevant pulses to a certain extent. However, the biggest drawback of this kind of method is that only one defect can be detected and other defects are ignored. When multiple defects appear in different frequency bands, fault information will be lost and fault information will be lacking, which brings great difficulties to bearing fault diagnosis.
As a common method to separate signal periods and random components, cepstrum pre-whitening is fast and easy to implement and can be used for automatic diagnosis [24, 25]. However, setting the amplitudes of all frequency components to unit amplitude seriously reduces the SNR and greatly limits practical applications. Therefore, Moshrefzadeh et al. introduced spectral amplitude modulation (SAM), a new nonlinear filtering technique [26]. The method performs Fourier transformation on the obtained vibration signal to obtain its amplitude spectrum and phase spectrum and then assigns different weight indices (MO) to its phase spectrum. The resulting edit spectrum is subjected to inverse Fourier transformation to obtain a series of corrected signals. Finally, the square spectrum of the corrected signal is Fourier transformed to obtain a square envelope spectrum to view fault characteristic information. At present, SAM is favored by many scholars for its powerful nonlinear enhancement capabilities. Zhu et al.[27] combined SAM with Savitzky-Golay filtering to suppress noise interference and signal distortion during signal transmission; Moshrefzadeh [28] combined it with support vector machines to expand the application of SAM in online monitoring of variable operating conditions; Liu [29] applied unbiased autocorrelation to corrected signals to optimize SAM results; Wang [30] used SAM to extract fault characteristics under variable speed conditions and test its noise suppression ability; Zhong [31-32] used SAM to highlight and reconstruct the pulse characteristics in the signal; Ma [33] pointed out that at certain amplitude orders, fault information may be concealed by noise, and gave a generalized envelope spectrum to improve fault characteristics, which was verified on a locomotive bearing test stand.
Although the above studies have achieved good research results, SAM still faces huge challenges in practical applications. First of all, even if SAM can reduce the impact of interference components on fault components, if it is in a strong interference environment, the interference component is still the dominant component, which will cause fault information to be submerged in a large amount of interference; Secondly, because SAM processes signals, Scanning the entire frequency band amplifies fault information while also enhancing interference information, which means that the final result may be erased due to interference. Based on the above problems, a new local W transform spectral amplitude modulation (LWTSAM) method is proposed. In this paper, first, the maximum discrete overlapped wavelet transform (MODWT) is used to decompose the original signal into multiple narrowband signals in different frequency bands to remove some interference components; then the windowed Fourier transform (WFT) is used to calculate the phase and amplitude of the narrowband signal with the richest fault information and select the square envelope under the optimal weight, which will get more accurate results, because the amplitude is not calculated over the entire frequency band. Experimental results show that this method has good results in bearing fault diagnosis and analysis.
To sum up, a review table of the comparative literature is given, as shown in Table 1.
Table 1Comparison between existing bearing fault diagnosis methods and the proposed LWTSAM
Method | Core idea | Noise robustness | Multi-fault capability | Automatic band selection | Limitation |
Kurtogram [10-12] | Kurtosis-based band selection | Medium | No | No | Sensitive to impulsive noise |
Autogram [18] | Thresholded kurtosis | Medium | No | Yes | Noise-dominated envelope |
SAM [26] | Global spectral amplitude modulation | Medium | No | No | Global enhancement amplifies noise |
LWTSAM | MODWT + local WFT-SAM | High | Yes | Yes | Slightly increased complexity |
2. SAM theory
The SAM method was proposed by Moshrefzadeh [26]. As an advanced nonlinear filtering technique, it extracts frequency components of different energies in the signal by setting different MOs without requiring the input of any parameters in advance, thereby realizing bearing fault diagnosis., made great contributions in the field of bearing fault diagnosis.
First, FT is used to convert the original signal from the time domain to the frequency domain:
where is the imaginary unit, FT is the Fourier transform, and and represent the amplitude and phase of the spectrum respectively.
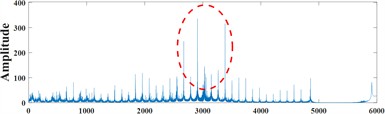
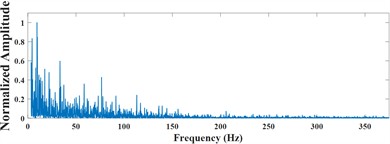
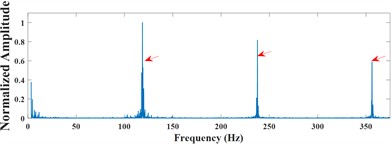
Subsequently, the phase remains unchanged, and different weight indices () are assigned to the amplitude spectrum to adjust the amplitude in different frequency bands. Then the original phase is combined with the modulated amplitude to obtain the edited spectrum. Finally, inverse Fourier transform is performed to obtain the correction signal. This nonlinear filtering process is as follows:
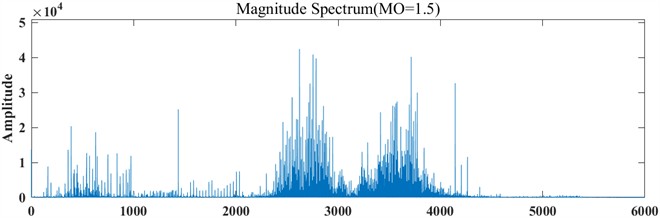
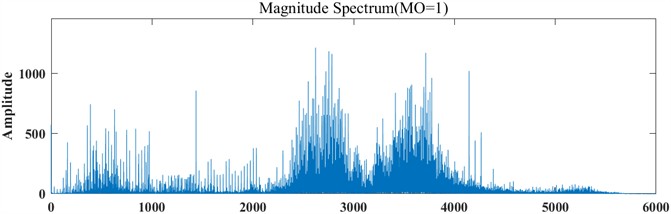
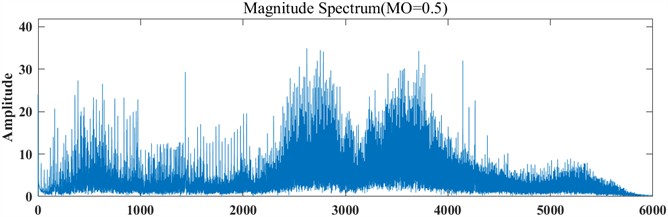
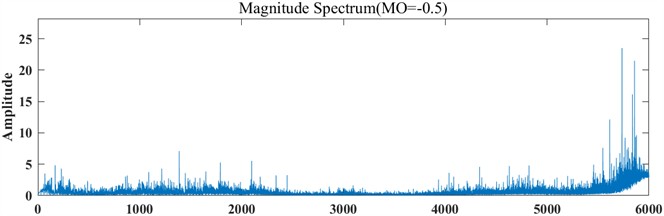
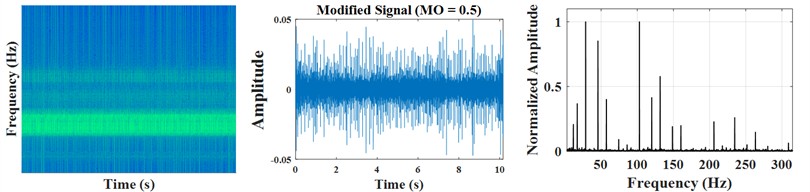
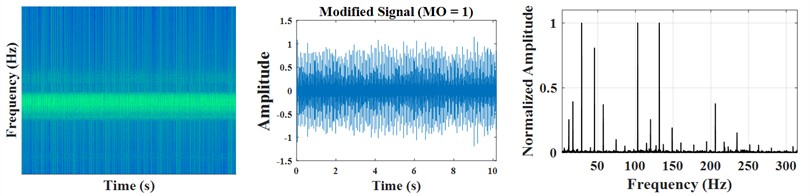
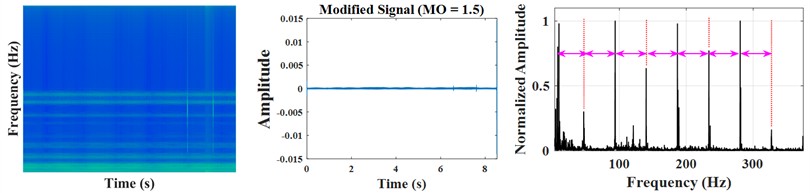
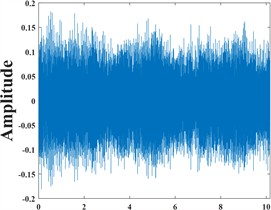
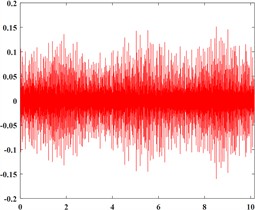
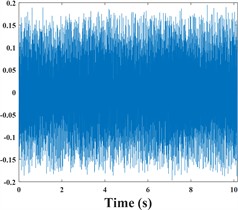
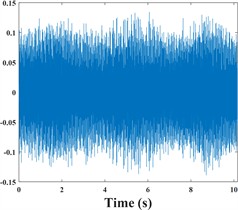
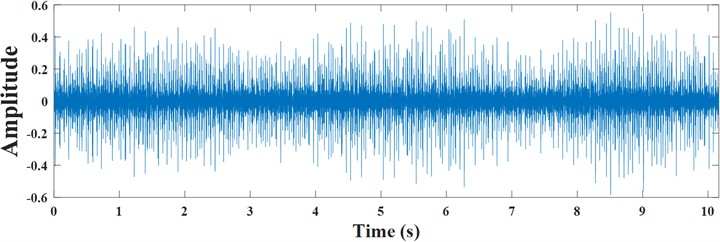
where is the correction signal under different weight indices, and is the inverse Fourier transform. The recommended value for is , with a step size of 0.1. The advantage of this is that it can adjust the size of to diagnose faults under different situations and effectively shield interference components. Among them, there are three main effects of value on the signal: when , if the noise component does not dominate, the fault component with very low energy level can be extracted; when , the dominant position of high amplitude frequency gradually decreases, but the high-energy components and low-energy components will be retained to a certain extent; when , the larger amplitude component is further amplified to conceal the smaller amplitude component; when , it is the original signal. The signal spectra under different are shown in Fig. 1.
Then, the SES for each modified signal is calculated as follows:
Next, the SES are normalized between [0, 1] for explicit comparisons:
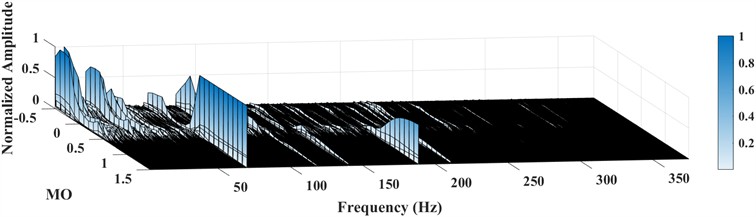
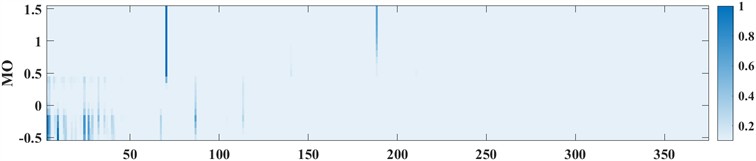
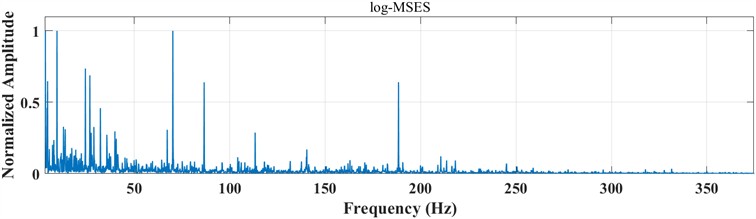
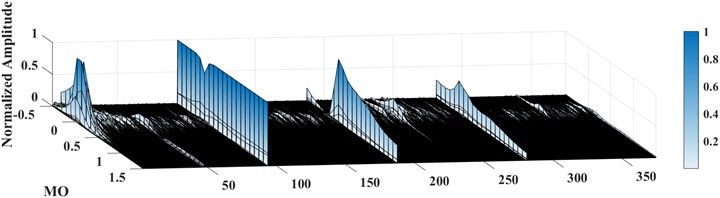
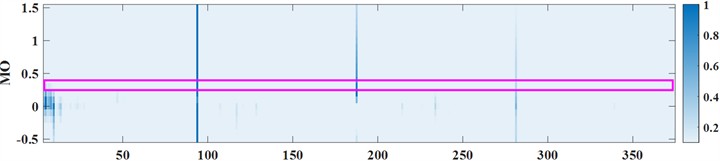
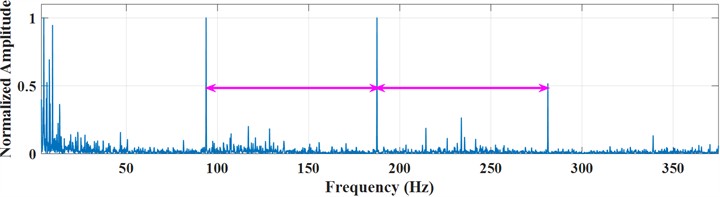
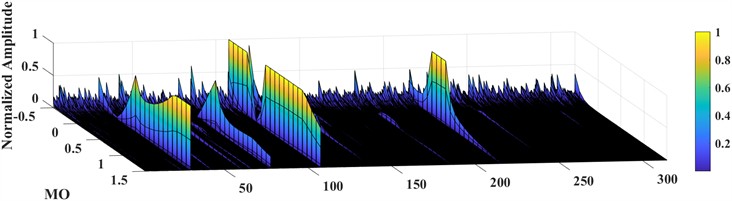
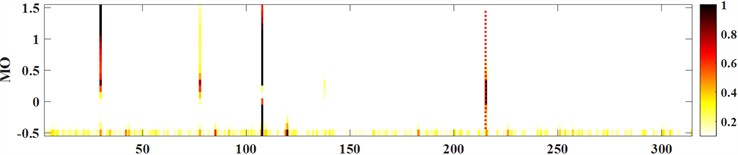
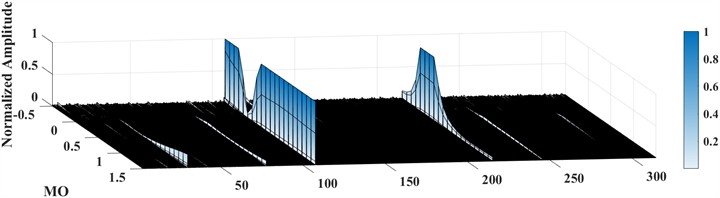
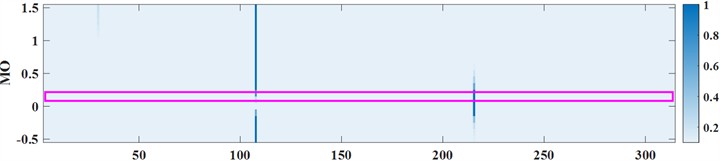
Finally, use a three-dimensional diagram to display the results. Where the -axis represents the modulation frequency, the -axis represents , and the -axis represents the normalized amplitude. In addition, other visual view demonstration results will also be given. One view is a top view of the three-dimensional map, which is a two-dimensional color map along the normalized amplitude axis, and the color intensity corresponds to the normalized amplitude magnitude. This view is clear for analyzing the relationship between the intensity of each modulation frequency and the corresponding value. The other view is a front view of the three-dimensional graph, which is the logarithmic maximum square envelope spectrum plotted along the axis, which provides the modulation frequency and corresponding amplitude for different values. As shown in Fig. 2.
Fig. 1Signal spectrum under different MO
SAM restores the original signal by assigning different amplitudes and different weight indices, and combines it with the original phase, and determines fault components according to different angles. This has proven to be a convenient, efficient and automated method. However, in complex industrial environments, the application of SAM will face some challenges. First, is assigned to the entire amplitude spectrum, but if the fault information only appears in a certain narrow band at this time, this will mean that the weight of the fault information will increase and the noise information will also be enhanced. Then after SAM processing, the fault information will be covered up by a large amount of enhanced noise; In addition, since the Fourier transform is performed over the entire time domain, which means that the amplitude of each frequency in the amplitude spectrum is based on the contribution of the entire time process, inaccuracies will undoubtedly be amplified in subsequent calculations.
To address the above problems, it is necessary to explore a more ideal method.
Fig. 2SAM example
3. Recommended method: local W-transform spectral amplitude modulation
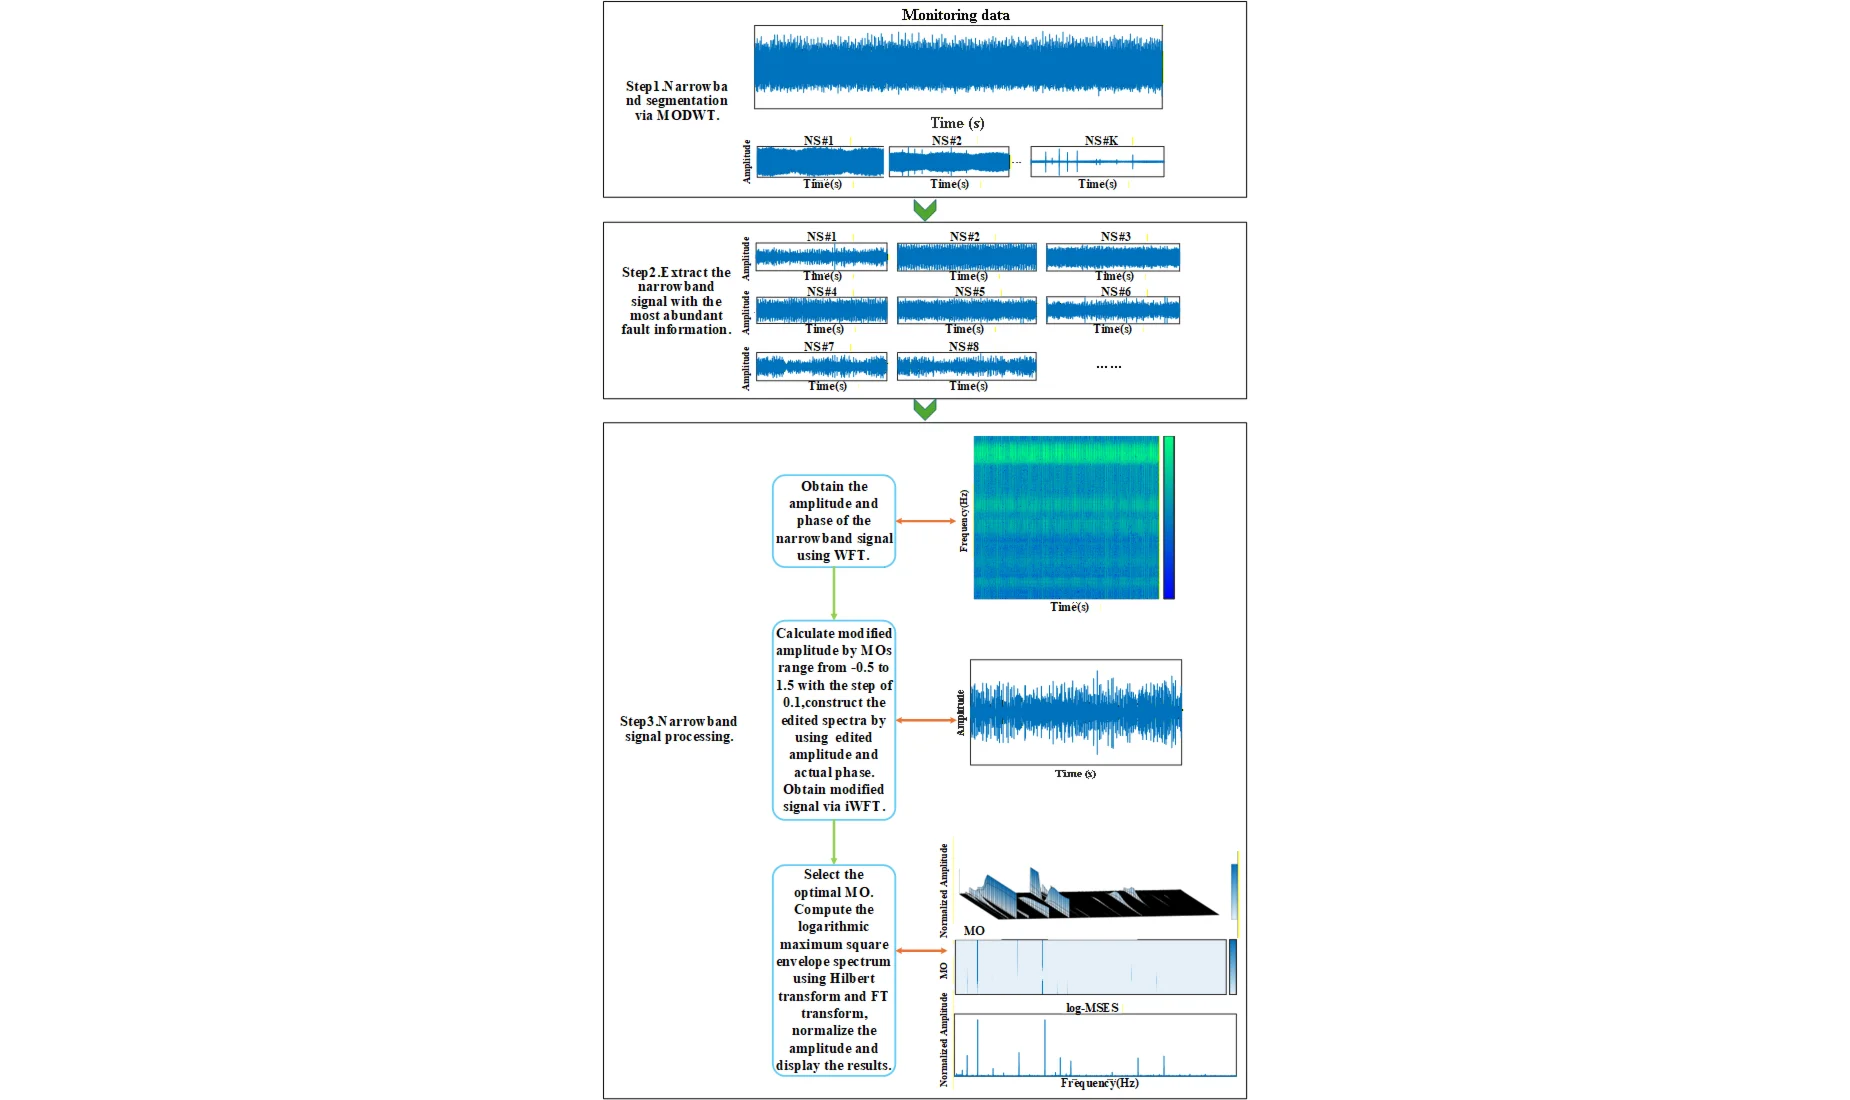
A method called LWTSAM was proposed to solve the above problems. First, the entire spectrum is segmented using the Maximum Discrete Overlapped Wavelet Transform (MODWT), separated into narrowband signals in different frequency bands, and selected the narrowband with the richest fault information; secondly, the narrowband signal is used to obtain its phase and amplitude and reconstruct it. The reconstructed signal can be used to extract the characteristic frequency more obviously. Based on the above statement, the LWTSAM flow chart is shown in Fig. 3, and the following section details the implementation and explanation of each step.
3.1. Signal segmentation via maximum discrete overlapping wavelet transform
As mentioned earlier, SAM can enhance the fault frequency component by modifying the weighting index. However, for a strong interference environment, the interference component and the fault component may have the same amplitude. In this case, the fault component and the noise component will be enhanced at the same time, and the SAM diagnosis will be invalid. Bearing fault components usually exist in the fault resonance frequency band, so the original signal can be divided into several narrowband signals to maximize the separation of the fault components from most of the noise components.
Fig. 3LWTSAM method flowchart
The Maximum Discrete Overlap Wavelet Transform [34] can decompose a signal into multiple frequency bands, and it is convolved through maximum overlap, which means that at each scale, the convolution window of the wavelet function and the scale function covers the entire signal, thereby retaining more information. This section uses the maximum discrete overlapping wavelet transform to segment the original signal into multiple narrowband signals. First, the characteristics of the wavelet transform are defined by selecting appropriate wavelet basis functions and scale functions ; secondly, at each scale , the signal is decomposed into approximation coefficients and detail coefficients :
where is the translation parameter, , are defined as follows:
Finally, the original signal is reconstructed from the MODWT coefficients to obtain the reconstructed signal :
The reconstructed signal can be decomposed into multiple narrowband signals through the filter bank included in MODWT:
where is the time index, is the scale coefficient of the layer, is the wavelet coefficient of the layer, and are the inverse scale filter and the inverse wavelet filter respectively.
3.2. Signal segmentation via maximum discrete overlapping wavelet transform
Although the optimal narrowband signal obtained by MODWT segmentation has filtered out most irrelevant components, there are inevitably some interference components in a single narrowband. Therefore, in order to observe and extract more comprehensive information, a windowed Fourier transform is used for the optimal narrowband signal. For the selected optimal narrowband signal and window function , it is defined as:
where is the result of the windowed Fourier transform, which is a function of time shifted and frequency ; is a window function shifted by time; is a complex exponential function, and is an imaginary unit. Then, the inverse window Fourier transform is calculated by extracting the IFT signal of each modified FT vector in a certain window of the WFT and overlapping and adding them. However, in practical applications, this process can be achieved by providing a different MO value for each amplitude value in the time-frequency matrix. It can be expressed as:
where represents the correction signal obtained by the proposed method.
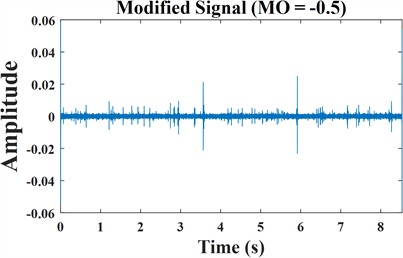
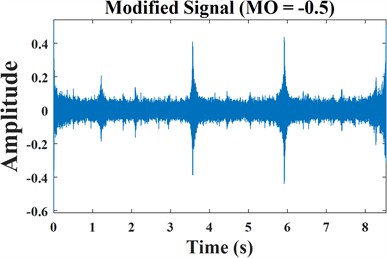
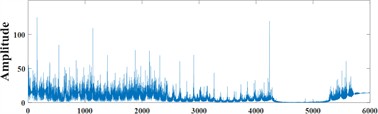
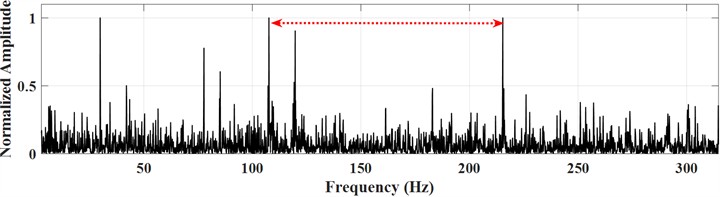
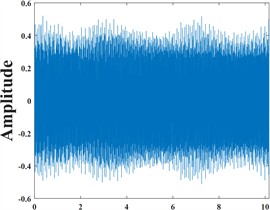
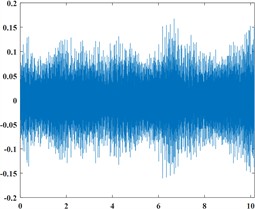
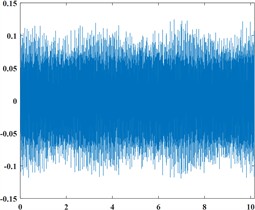
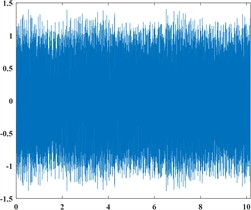
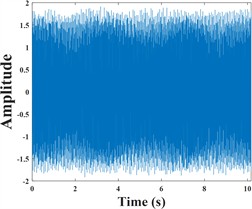
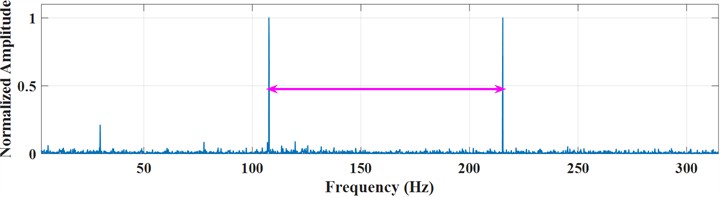
Window Fourier transform can analyze local frequency components of a signal by sliding a window on the signal, which is particularly useful for non-stationary signals; Fourier transform provides global frequency information of the entire signal and cannot distinguish between frequency changes in different time periods, and the amplitude obtained by Fourier transform is the average of the amplitudes obtained over the entire time, which can lead to significant differences in results. A comparison of these two methods is shown in Fig. 4. For the same value, it can be observed that LWTSAM reveals the resonance band well, while the resonance band in SAM is submerged by noise, which also leads to completely different diagnostic results for the envelope spectrum.
Fig. 4a) SAM modified signal; b) LWTSAM modified signal; c) SAM modified signal spectrum; d) LWTSAM modified signal spectrum; e) SAM modified signal envelope spectrum; f) LWTSAM modified signal envelope spectrum
a)
b)
c)
d)
e)
f)
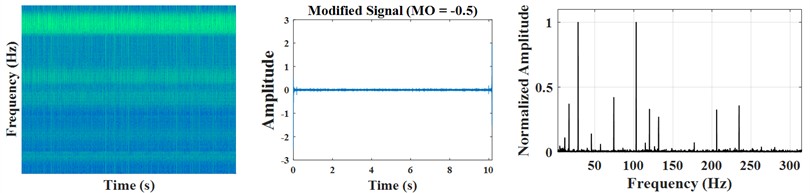
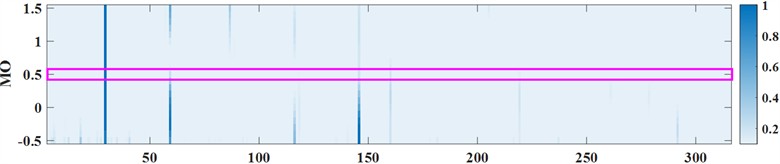
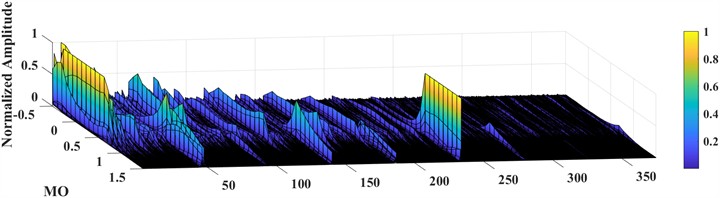
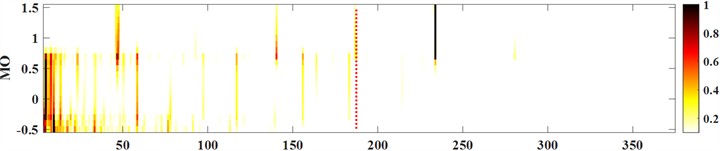
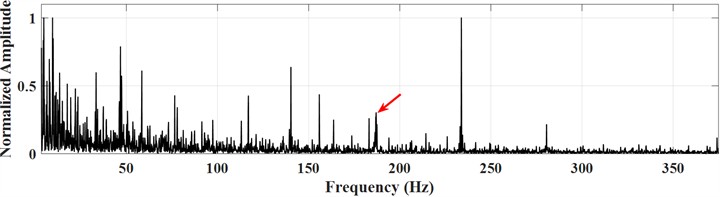
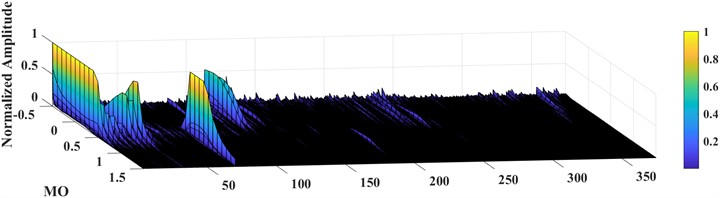
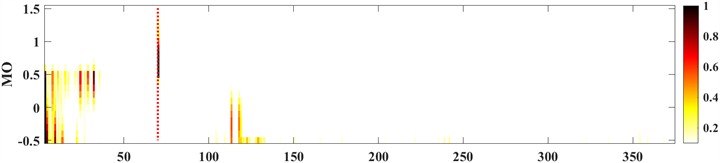
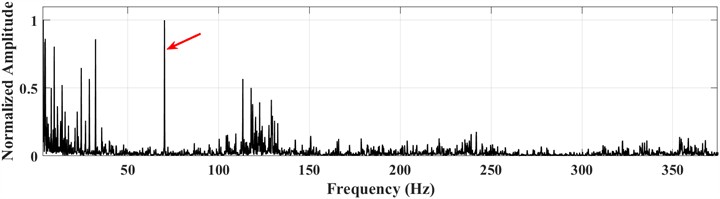
Therefore, in this study, WFT was used to improve spectral amplitude modulation. The amplitude calculated by WFT no longer corresponds to the entire time domain, so a more accurate corrected amplitude can be obtained in subsequent calculations. As shown in Fig. 5, it can be observed that by assigning different weight indices to the time-frequency domain, fault characteristics can also be highlighted for certain specific values, which verifies the feasibility of the method in this paper.
3.3. Select the best weights through unbiased autocorrelation and information entropy
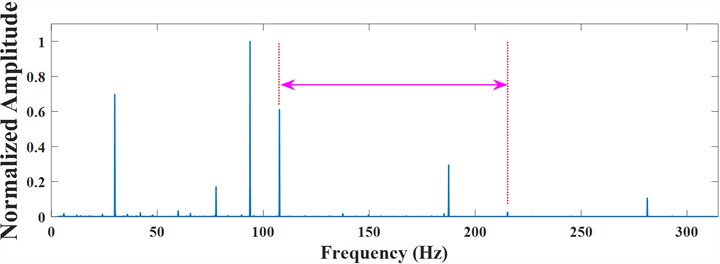
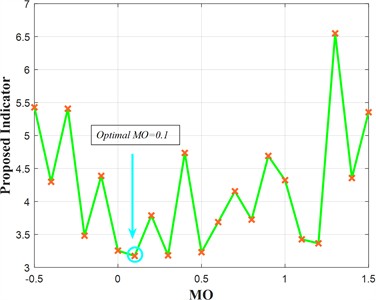
As mentioned earlier, when a signal is subjected to high-intensity interference, a large amount of noise will flood into the envelope spectrum, which can easily drown out the fault characteristic frequency. At this point, it is undoubtedly a huge challenge to manually analyze the harmonic bands and correctly select the best . Therefore, an indicator that can automatically select the best is needed to quantify the fault information in the envelope spectrum. Although harmonic spectrum kurtosis [35], spectral negative entropy [15] and sparsity [36] are excellent indicators for detecting pulse components in bearing vibration signals, in order to highlight signal characteristics and strengthen feature information, this paper adopts an indicator based on unbiased autocorrelation (AC) and information entropy adaptively selecting the optimal [37].
Fig. 5a) Time-frequency domain spectrum, modified signal and envelope spectrum at MO= –0.5; b) Time-frequency domain spectrum, modified signal and envelope spectrum at MO= 0.5; c) Time-frequency domain spectrum, modified signal and envelope spectrum at MO= 1; d) Time-frequency domain spectrum, modified signal and envelope spectrum at MO= 1.5
a)
b)
c)
d)
First, the square envelope of the modified signal is calculated through the Hilbert transform:
where is the square envelope of the modified signal, is the signal length, and the interval is .
Unbiased autocorrelation is then used to enhance the periodic component of the signal and weaken the random pulse component:
where is the delay coefficient, calculated as follows:
where, represents the sampling frequency. In Eq. (12), the number of data samples used to calculate AC will decrease as increases, which may lead to insufficient estimation variance in the result part. Therefore, only the first half of the AC is selected, and the uncertainty of the result is represented by information entropy, which is defined as follows:
where, corresponds to the result of each suggested indicator, and is the probability distribution:
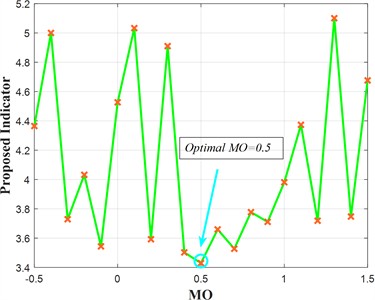
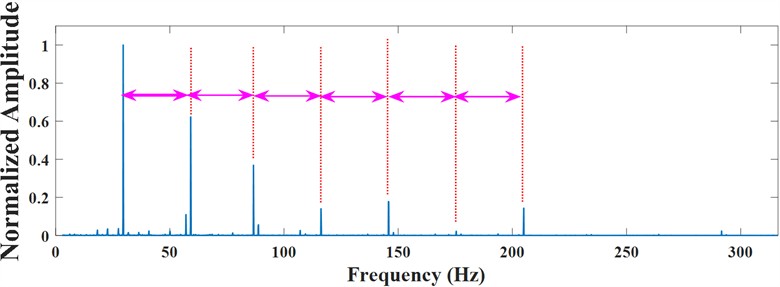
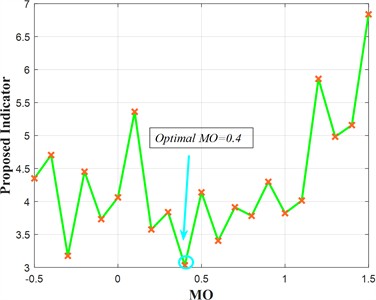
where, represents the amplitude under a certain range of sample numbers . Since random pulse components in the vibration signal will cause energy fluctuations, and periodic fault components will cause entropy reduction, with the smallest index value is used as the best weight. The results are shown in Fig. 6. It can be seen that the fault component dominates and the interference component can be ignored.
Fig. 6a) Indicator analysis results; b) 2D diagram of LWTSAM; c) envelope spectrum at MO= 0.5
a)
b)
c)
4. Experimental verification
This section uses real data from the Southeast University Bearing Failure Test Bench [38] to verify the feasibility of LWTSAM. It will be compared with SAM method, Autogram method and fast spectral kurtosis diagram method.
4.1. Experimental device
The vibration signal was collected at the motor speed of 1800 r/min and the sampling frequency of 12 kHz. The experiment will use outer ring, inner ring and composite fault data sets of inner and outer rings to verify this research. The fault types are shown in Table 2, and samples under a load of 30 Hz-2 V are used.
Table 2Description of SEU bearing faults
Speed-load | Fault type | Description | Label |
30 Hz-2 V | Outer fault | Outer crack | 1 |
Inner fault | Inner crack | 2 | |
Comb fault | Comb crack | 3 |
4.2. Fault diagnosis of bearing outer ring
This section will provide experimental verification of bearing with outer ring failure. The actual running speed of the motor is 1768.6 r/min, and the actual rotating frequency is 29.91 Hz. After calculation, the characteristic frequency = 93.75 Hz can be obtained. Fig. 7 shows the time domain diagram and envelope spectrum of the original signal. Due to the interference of strong noise, there is no particularly obvious periodic effect in the time domain; the fault frequency and its doubling cannot be observed in the envelope spectrum. It is not easy to find more useful information.
First, the SAM method is used to process the signal, as shown in Fig. 8. It can be observed that no obvious fault components are observed in either the 3D image or the 2D image. in log-MSES is concealed by a large amount of noise, and only weak is observed. The interference of invalid components makes fault feature extraction difficult.
The LWTSAM method was then used to process the signal. First, the signal is divided using the filter bank that comes with MODWT. The number of filters is set to 8 and the bandwidth is set to 600 Hz. Random impact interference can be successfully separated. According to the parameters, narrowband signal #2 contains fault information, and all narrowband signals are shown in Fig. 9.
Fig. 7Time domain diagram and envelope spectrum of outer ring original signal
Fig. 8SAM outer ring fault diagnosis
Narrow-band signal #2 and its envelope spectrum are shown in Fig. 10, and fault-related information is hidden in harmonic interference.
Although the fault frequency and its doubling can be observed in the segmented narrowband signal, it still appears weak compared with the interference component. So, we proceed to the next step. WFT is used to reconstruct narrowband signal #2. The reconstructed signal and its envelope spectrum are shown in Fig. 11. It can be seen that the noise is greatly reduced, and three harmonics of the characteristic frequency can be found in log-MSES, which shows that the LWTSAM method has obvious advantages over the SAM method. The recommended indicators are then used to select the best weights for extracting individual SES, and the minimum value of the recommended indicators appears at 0.4, which is considered the best weights. As shown in Fig. 12, the characteristic frequency and its doubling are further enhanced, enough to determine that it is an outer ring fault.
Fig. 9Outer band signal
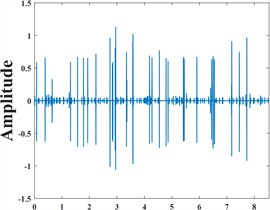
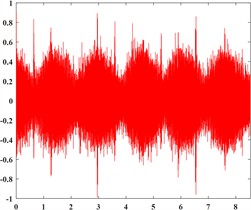
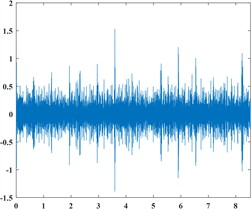
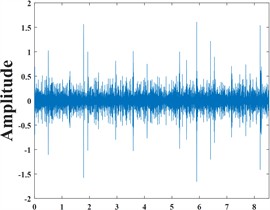
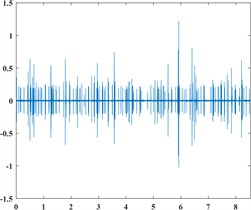
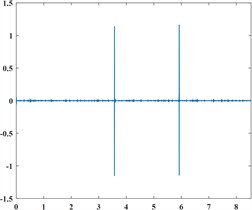
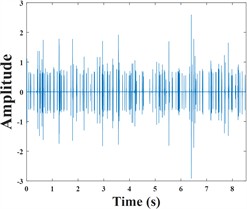
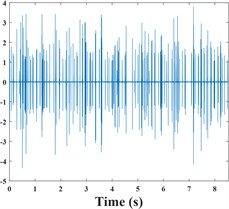
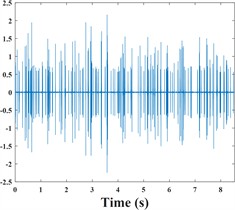
Fig. 10Outer band signal #2 and its envelope spectrum
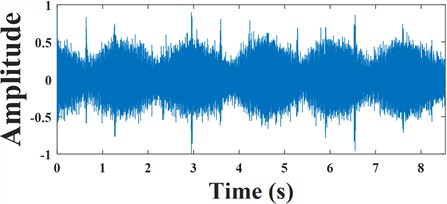
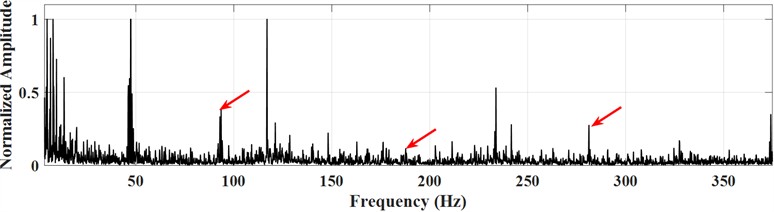
Fig. 11Outer ring reconstructed signal and its envelope spectrum
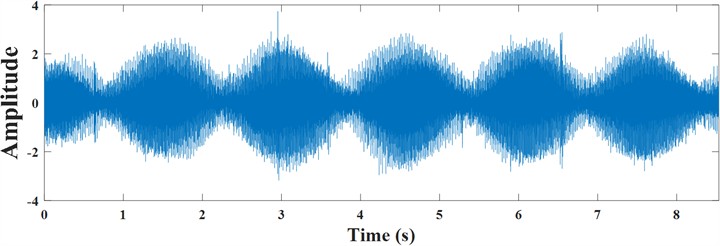
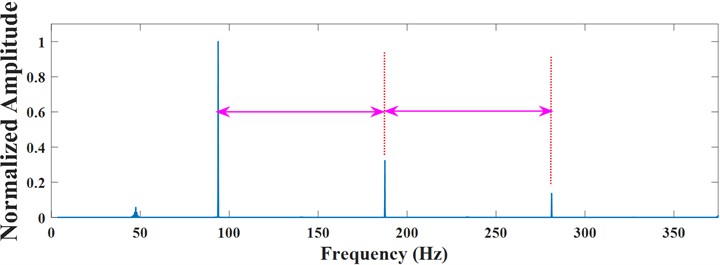
Fig. 12Outer ring reconstructed signal and its envelope spectrum
For further comparison, the fast spectral kurtosis method and the Autogram method continue to be used to process signals. The diagnosis results of the fast spectral kurtosis method are shown in Fig. 13. Where is the maximum kurtosis value, is the bandwidth, and is the center frequency. From the kurtosis diagram, we can know that is 8.9, is 500 Hz, and is 5750 Hz. The best frequency band is found in Level 3.5, and no useful fault information is observed in the envelope spectrum.
Fig. 13Fast spectral kurtosis method outer ring diagnostic results
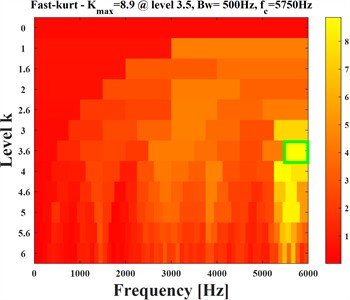
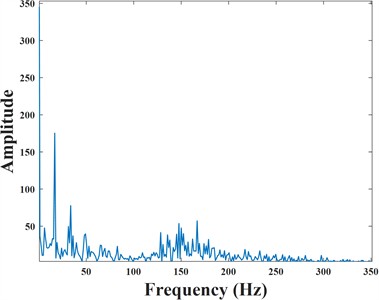
Fig. 14Autogram method outer ring diagnostic results
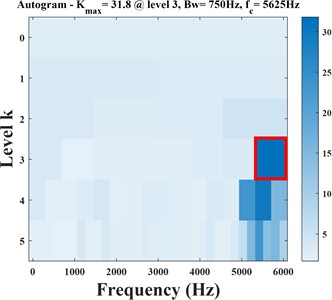
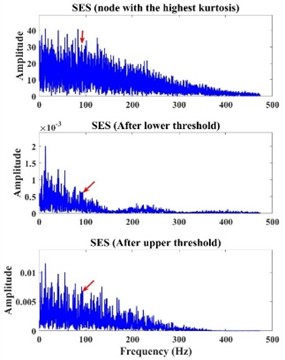
The diagnosis results of the Autogram method are shown in Fig. 14. Where is the maximum kurtosis value, is the bandwidth, and is the center frequency. From the kurtosis diagram, we can know that is 31.8, is 750 Hz, and is 5625 Hz. The best frequency band is found at Level 3. The envelope spectrum results under the best frequency band are given. For further verification, the envelope spectra after the rising and falling thresholds are given respectively. It can be observed that although the fault frequency can be observed after processing, a large number of noise components dominate.
To sum up, the LWTSAM method is significantly better than the SAM method in processing outer ring fault signals. The fast spectral kurtosis diagram method and Autogram method verify the feasibility of the method in this paper.
4.3. Fault diagnosis of bearing inner ring
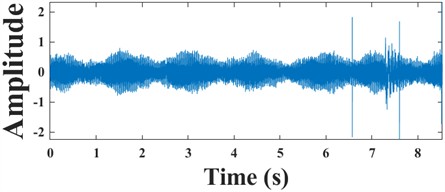
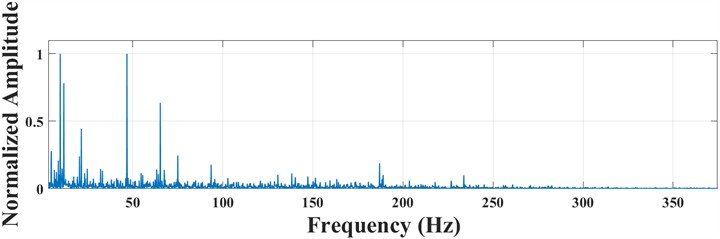
This section will conduct experimental verification of bearing with inner ring failure. The actual running speed of the motor is 1779.2 r/min, and the actual rotating frequency is 29.93 Hz. After calculation, the characteristic frequency of bearing inner ring fault = 107.61 Hz can be obtained. Fig. 15 shows the time domain diagram and envelope spectrum of the original signal. Due to the interference of a large amount of noise, there is no particularly obvious fault information in the time domain; the fault frequency and its doubling cannot be observed in the envelope spectrum, so it is difficult to extract more useful information.
Fig. 15Time domain diagram and envelope spectrum of inner ring original signal
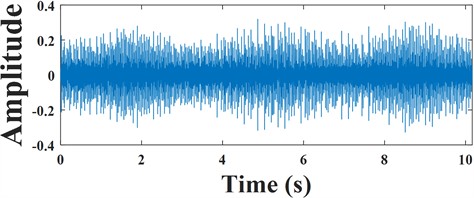
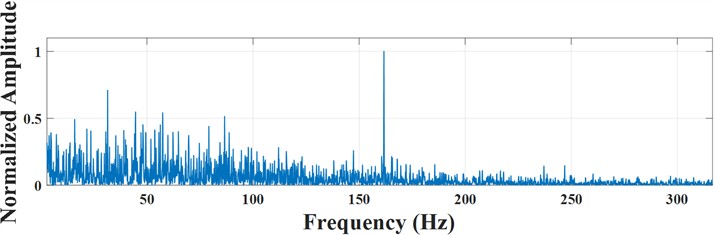
Fig. 16SAM iuter ring fault diagnosis
First, the signal is processed using the SAM method, as shown in Fig. 16. Fault information can be clearly observed in both the 3D and 2D graphs. and can also be observed in log-MSES. However, there are some interference components with amplitude equivalent to the fault frequency, so it is very necessary to eliminate these interference.
The LWTSAM method was then used to process the signal. First, the signal is divided using the filter bank that comes with MODWT. The number of filters is set to 9 and the bandwidth is set to 600Hz. Random impact interference can be successfully separated. According to the parameters, narrowband signal #5 contains fault information, and all narrowband signals are shown in Fig. 17.
Fig. 17Inner band signal
Narrow-band signal #5 and its envelope spectrum are shown in Fig. 18, and fault-related information is hidden in harmonic interference.
Obvious and can be observed from the obtained narrowband signal #5, but it can also be seen that there are many irrelevant components with amplitudes similar to the fault component, which can easily lead to misdiagnosis. So, we proceed to the next step. WFT is used to reconstruct narrowband signal #5. The reconstructed signal and its envelope spectrum are shown in Fig. 19. It can be seen that the noise is greatly weakened, but the fault component is also weakened. The characteristic frequency can be found in log-MSES. 2 harmonics, but the amplitude intensity is far less than that of the irrelevant component. The recommended indicators are then used to select the best weights for extracting individual SES, and the minimum value of the recommended indicators appears at 0.1, which is considered the best weights. As shown in Fig. 20, the irrelevant components are eliminated and the fault components are enhanced, which is enough to determine that it is an inner ring fault.
Fig. 18Inner circle narrowband signal #5 and its envelope spectrum
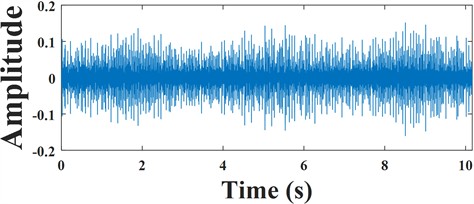
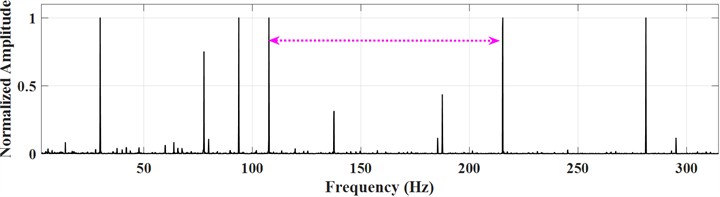
Fig. 19Inner ring reconstructed signal and its envelope spectrum
Next, we continue to use the fast spectral kurtosis method and the Autogram method to process the signal. Fig. 21 shows the fast spectral kurtosis method. Where is the maximum kurtosis value, is the bandwidth, and is the center frequency. From the kurtosis diagram, we can know that is 8.9, is 500 Hz, and is 5750 Hz. The best frequency band is found in Level 3.5, and no useful fault information is observed in the envelope spectrum.
Fig. 20Final diagnostic results of LWTSAM method inner circle
The diagnosis results of Autogram method are shown in Fig. 22. Where is the maximum kurtosis value, is the bandwidth, and is the center frequency. From the kurtosis diagram, we can know that is 11.2, is 375 Hz, and is 5812.5 Hz. The best frequency band is found at Level 4. The envelope spectrum results under the best frequency band are given. For further verification, the envelope spectra after the rising and falling thresholds are given respectively. It can be observed that fault information is submerged by a large number of noise components.
To sum up, the LWTSAM method has also achieved good results in processing inner ring fault signals, which is significantly superior to other classic methods, which verifies the feasibility and superiority of the method in this paper.
Fig. 21Inner circle diagnosis results of fast spectral kurtosis method
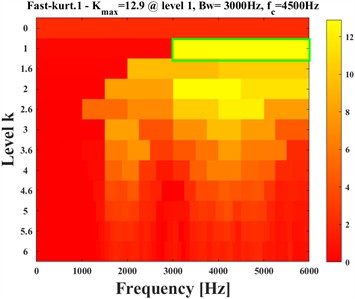
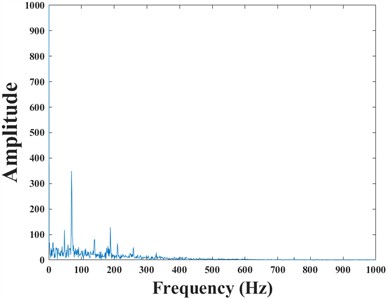
Fig. 22Autogram method inner circle diagnosis results
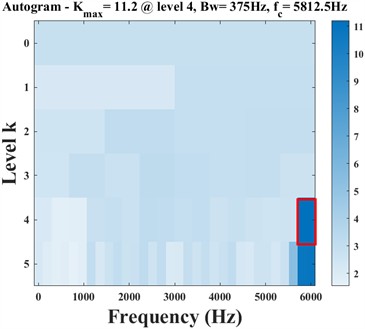
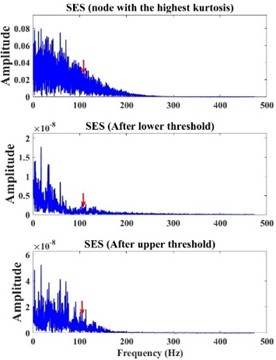
Fig. 23Composite original signal time domain diagram and envelope spectrum
4.4. Bearing composite fault diagnosis
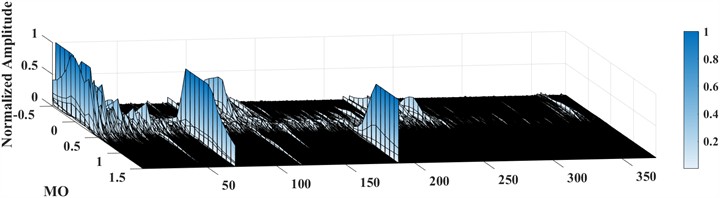
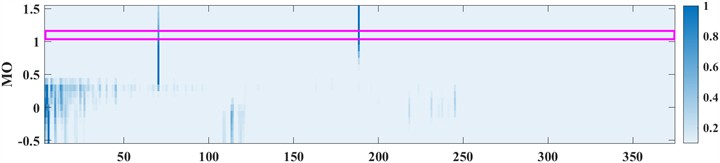
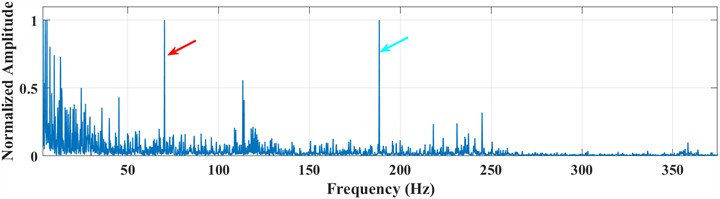
This section will conduct experimental verification of composite fault bearings. The actual running speed of the motor is 1758.8 r/min, and the actual rotating frequency is 29.86 Hz. After calculation, the characteristic frequency of bearing outer ring fault = 70.2 Hz; the characteristic frequency of inner ring fault = 188.4 Hz can be obtained. Fig. 23 shows the time domain diagram and envelope spectrum of the original signal. Due to the interference of a large amount of noise, although part of the impact signal can be observed in the time domain, the fault frequency and its doubling cannot be observed in the envelope spectrum, and no more useful information can be extracted.
First, the signal is processed using the SAM method, as shown in Fig. 24. The outer ring fault information can be observed in both the 3D diagram and the 2D diagram, but the inner ring fault information cannot be observed. Only can be observed in log-MSES, and all fault information cannot be accurately diagnosed.
Fig. 24Composite diagnosis results of SAM method
The LWTSAM method was then used to process the signal. First, the signal is divided using the filter bank that comes with MODWT. The number of filters is set to 9 and the bandwidth is set to 600Hz. Random impact interference can be successfully separated. According to the parameters, narrowband signal #7 contains fault information, and all narrowband signals are shown in Fig. 25.
Narrow-band signal #7 and its envelope spectrum are shown in Fig. 26, and fault-related information is hidden in harmonic interference.
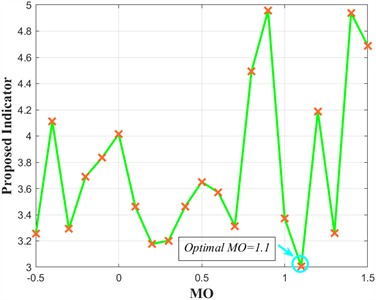
From the obtained narrowband signal #7, and can be observed, but the amplitude is relatively low and lower than other irrelevant components. So, we proceed to the next step. WFT is used to reconstruct narrowband signal #7. The reconstructed signal and its envelope spectrum are shown in Fig. 27. It can be seen that the noise is greatly weakened, but the fault component is also weakened. The harmonics of the inner and outer rings can be found respectively in log-MSES., but the amplitude intensity is lower than that of the original narrowband signal, because no suitable MO was selected. The recommended indicators are then used to select the best weights for extracting individual SES, and the minimum value of the recommended indicators appears at 1.1, which is considered the best weights. As shown in Fig. 28, the irrelevant components are weakened and the fault components are enhanced, which is enough to determine that they are inner and outer rings.
Fig. 25Composite fault narrowband signal

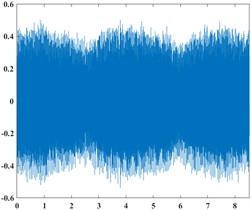
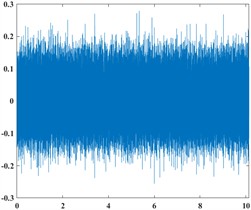
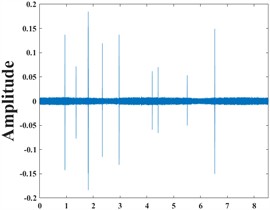
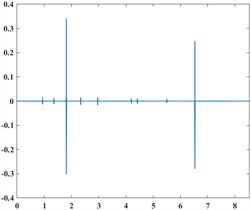
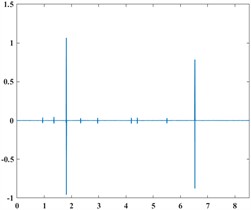
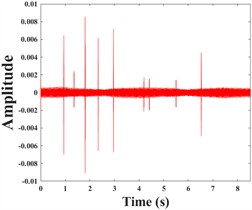
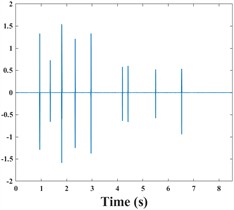
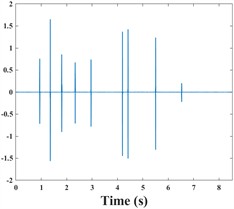
Fig. 26Narrowband signal #7 and its envelope spectrum
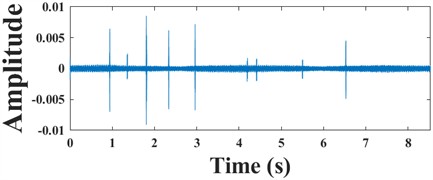
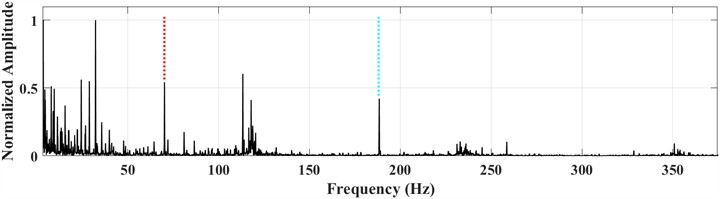
Fig. 27Composite reconstructed signal and its envelope spectrum
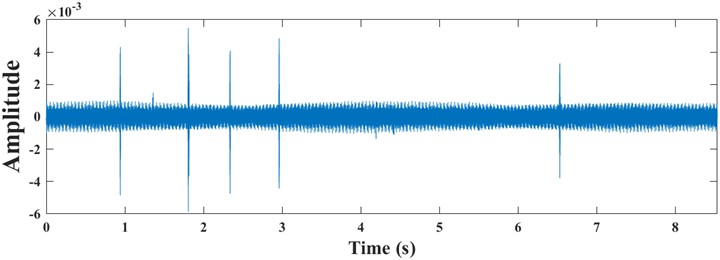
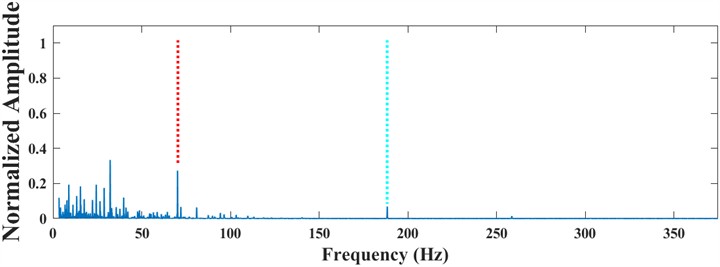
Fig. 28Final diagnosis result of LWTSAM composite fault
The fast spectral kurtosis method and Autogram method are used to process the signal. Fig. 29 shows the fast spectral kurtosis method. Where is the maximum kurtosis value, is the bandwidth, and is the center frequency. It can be known from the kurtosis diagram that is 3.9, is 6000 Hz, and is 3000 Hz. The best frequency band is found at Level 0. The envelope spectrum is all irrelevant information, and the effect is very poor.
Fig. 29Composite diagnosis results of fast spectral kurtosis method
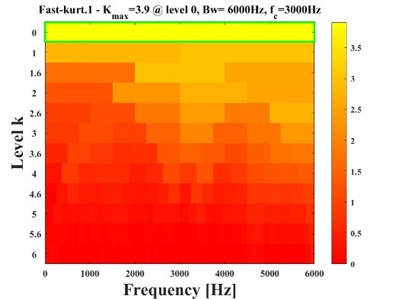

Fig. 30Autogram method composite diagnosis results
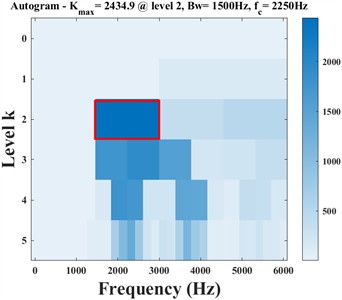
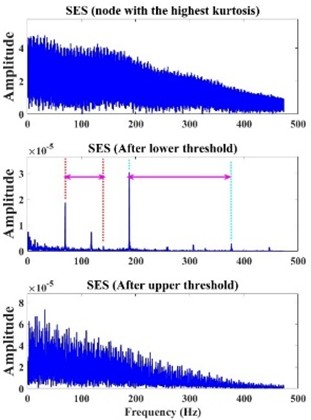
The diagnosis results of the Autogram method are shown in Fig. 30. Where is the maximum kurtosis value, is the bandwidth, and is the center frequency. From the kurtosis diagram, we can know that is 2434.9, is 1500 Hz, and is 2250 Hz. The best frequency band is found at Level 2. The envelope spectrum results under the best frequency band are given. For further verification, the envelope spectra after the rising and falling thresholds are given respectively. It can be observed that only the frequency of fault information is observed in the envelope spectrum after lowering the threshold, and the fault information of the rest of the envelope spectrum is concealed by noise.
To sum up, the LWTSAM method can also show good performance when processing composite fault signals, which verifies the feasibility and superiority of the proposed method.
4.5. Quantitative comparison
Through the above experiments and calculations, a comparative analysis of quantitative indicators is given, mainly including: SNR improvement (dB); Fault-to-noise ratio (FNR); Entropy of envelope spectrum; Detected fault frequencies.
The analysis is shown in Table 3.
Table 3Quantitative indicator comparison
Method | SNR (dB) | FNR | Envelope entropy | Detected fault frequencies |
Original | –6.2 | 0.31 | 4.82 | No |
Kurtogram | –1.4 | 0.58 | 3.91 | Partial |
Autogram | –0.8 | 0.63 | 3.74 | Partial |
SAM | 0.9 | 0.71 | 3.26 | Single |
LWTSAM | 3.8 | 0.89 | 2.11 | All |
It can be seen from the table that the index data of this method are better than the comparison method, which is enough to prove the feasibility of this method.
4.6. Ablation study and statistical validation
Based on the above experiments and results, the ablation experimental analysis is given, as shown in Table 4.
Statistical verification is shown in Table 5, the indicators are as follows: Mean peak amplitude; Standard deviation (Std); Coefficient of Variation (CV).
Table 4Analysis of ablation experiments
Case | MODWT | WFT | selection | Result |
Case 1 | – | – | – | Failed |
Case 2 | + | – | – | Weak |
Case 3 | + | + | – | Partial |
Case 4 | + | + | + | Best |
Table 5Statistical verification
Method | Mean peak amplitude | Std | CV |
Kurtogram | 1.23 | 0.55 | 0.44 |
Autogram | 1.37 | 0.46 | 0.34 |
SAM | 1.68 | 0.41 | 0.33 |
LWTSAM | 2.98 | 0.29 | 0.10 |
5. Conclusions
In this study, a method called LWTSAM was proposed to diagnose bearing faults under complex conditions. First, the original signal is divided into several narrowband signals by using the filter bank included in the MODWT to achieve the effect of separating some interference signals; then, the narrowband signal with the richest fault information is selected and subjected to window Fourier transform to obtain the narrowband signal in the time domain. The amplitude value, and more comprehensive and detailed amplitude information is obtained; then, unbiased autocorrelation and information entropy are used to select the best weight and extract the single square envelope to further reduce the interference of irrelevant components; Finally, the proposed method is applied to outer ring fault, inner ring fault and composite fault signals respectively. The results prove that the method is fast, effective and adaptable, can automatically and accurately extract fault information, and successfully diagnose bearing faults. It also compares it with some classic methods, highlighting the advantages of the research method in this paper. In future research, we will continue to improve the LWTSAM method to expand its application in practical projects. Future work will focus on extending LWTSAM to variable-speed conditions, reducing computational cost for online monitoring, and integrating the proposed framework with data-driven learning models for intelligent fault diagnosis.
References
-
C. He, T. Wu, R. Gu, Z. Jin, R. Ma, and H. Qu, “Rolling bearing fault diagnosis based on composite multiscale permutation entropy and reverse cognitive fruit fly optimization algorithm – Extreme learning machine,” Measurement, Vol. 173, p. 108636, Mar. 2021, https://doi.org/10.1016/j.measurement.2020.108636
-
J. Li, Q. Yu, X. Wang, and Y. Zhang, “An enhanced rolling bearing fault detection method combining sparse code shrinkage denoising with fast spectral correlation,” ISA Transactions, Vol. 102, pp. 335–346, Jul. 2020, https://doi.org/10.1016/j.isatra.2020.02.031
-
G. He, J. Li, K. Ding, and Z. Zhang, “Feature extraction of gear and bearing compound faults based on vibration signal sparse decomposition,” Applied Acoustics, Vol. 189, p. 108604, Feb. 2022, https://doi.org/10.1016/j.apacoust.2021.108604
-
K. Zhang, Y. Xu, and P. Chen, “Feature extraction by enhanced analytical mode decomposition based on order statistics filter,” Measurement, Vol. 173, p. 108620, Mar. 2021, https://doi.org/10.1016/j.measurement.2020.108620
-
L. Xiang, X. Yang, A. Hu, H. Su, and P. Wang, “Condition monitoring and anomaly detection of wind turbine based on cascaded and bidirectional deep learning networks,” Applied Energy, Vol. 305, p. 117925, Jan. 2022, https://doi.org/10.1016/j.apenergy.2021.117925
-
H. Su, L. Xiang, A. Hu, Y. Xu, and X. Yang, “A novel method based on meta-learning for bearing fault diagnosis with small sample learning under different working conditions,” Mechanical Systems and Signal Processing, Vol. 169, p. 108765, Apr. 2022, https://doi.org/10.1016/j.ymssp.2021.108765
-
Y. Liu, S. Yang, and Y. Liao, “An adaptive resonance demodulation method and its application in early fault diagnosis of rolling bearings,” (in Chinese), Journal of Vibration Engineering, Vol. 29, No. 2, pp. 366–370, 2016.
-
X. Wang, J. Zheng, Q. Ni, H. Pan, and J. Zhang, “Traversal index enhanced-gram (TIEgram): A novel optimal demodulation frequency band selection method for rolling bearing fault diagnosis under non-stationary operating conditions,” Mechanical Systems and Signal Processing, Vol. 172, p. 109017, Jun. 2022, https://doi.org/10.1016/j.ymssp.2022.109017
-
B. Cai, L. Zhang, and G. Tang, “Encogram: An autonomous weak transient fault enhancement strategy and its application in bearing fault diagnosis,” Measurement, Vol. 206, p. 112333, Jan. 2023, https://doi.org/10.1016/j.measurement.2022.112333
-
J. Antoni and R. B. Randall, “The spectral kurtosis: application to the vibratory surveillance and diagnostics of rotating machines,” Mechanical Systems and Signal Processing, Vol. 20, No. 2, pp. 308–331, Feb. 2006, https://doi.org/10.1016/j.ymssp.2004.09.002
-
J. Antoni, “The spectral kurtosis: a useful tool for characterising non-stationary signals,” Mechanical Systems and Signal Processing, Vol. 20, No. 2, pp. 282–307, Feb. 2006, https://doi.org/10.1016/j.ymssp.2004.09.001
-
J. Antoni, “The spectral kurtosis of nonstationary signals: formalisation, some properties, and application,” in 12th European Signal Processing Conference, 2004.
-
C. Ma, Z. Sheng, and Y. Xu, “Fault diagnosis of rolling bearings based on adaptive frequency slice wavelet transform,” (in Chinese), Journal of Agricultural Engineering, Vol. 35, No. 10, pp. 34–41, Oct. 2019.
-
T. Barszcz and A. Jabłoński, “A novel method for the optimal band selection for vibration signal demodulation and comparison with the kurtogram,” Mechanical Systems and Signal Processing, Vol. 25, No. 1, pp. 431–451, Jan. 2011, https://doi.org/10.1016/j.ymssp.2010.05.018
-
J. Antoni, “The infogram: entropic evidence of the signature of repetitive transients,” Mechanical Systems and Signal Processing, Vol. 74, pp. 73–94, Jun. 2016, https://doi.org/10.1016/j.ymssp.2015.04.034
-
D. Wang, P. W. Tse, and K. L. Tsui, “An enhanced kurtogram method for fault diagnosis of rolling element bearings,” Mechanical Systems and Signal Processing, Vol. 35, No. 1-2, pp. 176–199, Feb. 2013, https://doi.org/10.1016/j.ymssp.2012.10.003
-
Y. Lei, J. Lin, Z. He, and Y. Zi, “Application of an improved kurtogram method for fault diagnosis of rolling element bearings,” Mechanical Systems and Signal Processing, Vol. 25, No. 5, pp. 1738–1749, Jul. 2011, https://doi.org/10.1016/j.ymssp.2010.12.011
-
A. Moshrefzadeh and A. Fasana, “The Autogram: An effective approach for selecting the optimal demodulation band in rolling element bearings diagnosis,” Mechanical Systems and Signal Processing, Vol. 105, pp. 294–318, May 2018, https://doi.org/10.1016/j.ymssp.2017.12.009
-
X. Gu, S. Yang, Y. Liu, and R. Hao, “Rolling element bearing faults diagnosis based on kurtogram and frequency domain correlated kurtosis,” Measurement Science and Technology, Vol. 27, No. 12, p. 125019, Dec. 2016, https://doi.org/10.1088/0957-0233/27/12/125019
-
Y. Liao, P. Sun, B. Wang, and L. Qu, “Extraction of repetitive transients with frequency domain multipoint kurtosis for bearing fault diagnosis,” Measurement Science and Technology, Vol. 29, No. 5, p. 055012, May 2018, https://doi.org/10.1088/1361-6501/aaae99
-
W. Liu, Y. Liu, and S. Yang, “Fault diagnosis method for rolling bearings based on typical spectral correlation kurtosis diagram,” (in Chinese), Vibration and Shock, Vol. 37, No. 8, pp. 87–92, 2018.
-
P. Borghesani, P. Pennacchi, and S. Chatterton, “The relationship between kurtosis – and envelope-based indexes for the diagnostic of rolling element bearings,” Mechanical Systems and Signal Processing, Vol. 43, No. 1-2, pp. 25–43, Feb. 2014, https://doi.org/10.1016/j.ymssp.2013.10.007
-
X. Zhang, J. Kang, L. Xiao, J. Zhao, and H. Teng, “A new improved kurtogram and its application to bearing fault diagnosis,” Shock and Vibration, Vol. 2015, pp. 1–22, Jan. 2015, https://doi.org/10.1155/2015/385412
-
D. Ibarra-Zarate, O. Tamayo-Pazos, and A. Vallejo-Guevara, “Bearing fault diagnosis in rotating machinery based on cepstrum pre-whitening of vibration and acoustic emission,” The International Journal of Advanced Manufacturing Technology, Vol. 104, No. 9-12, pp. 4155–4168, Aug. 2019, https://doi.org/10.1007/s00170-019-04171-6
-
P. Borghesani, P. Pennacchi, R. B. Randall, N. Sawalhi, and R. Ricci, “Application of cepstrum pre-whitening for the diagnosis of bearing faults under variable speed conditions,” Mechanical Systems and Signal Processing, Vol. 36, No. 2, pp. 370–384, Apr. 2013, https://doi.org/10.1016/j.ymssp.2012.11.001
-
A. Moshrefzadeh, A. Fasana, and J. Antoni, “The spectral amplitude modulation: A nonlinear filtering process for diagnosis of rolling element bearings,” Mechanical Systems and Signal Processing, Vol. 132, pp. 253–276, Oct. 2019, https://doi.org/10.1016/j.ymssp.2019.06.030
-
D. Zhu, B. Yin, and C. Teng, “An improved spectral amplitude modulation method for rolling element bearing fault diagnosis,” Journal of the Brazilian Society of Mechanical Sciences and Engineering, Vol. 45, No. 5, Apr. 2023, https://doi.org/10.1007/s40430-023-04184-z
-
A. Moshrefzadeh, “Condition monitoring and intelligent diagnosis of rolling element bearings under constant/variable load and speed conditions,” Mechanical Systems and Signal Processing, Vol. 149, p. 107153, Feb. 2021, https://doi.org/10.1016/j.ymssp.2020.107153
-
W. Liu, S. Yang, Q. Li, Y. Liu, and X. Gu, “An enhanced spectral amplitude modulation method and its application to rolling element bearings fault diagnosis under complex interference,” (in Chinese), Journal of Vibration Engineering, Vol. 34, pp. 1064–1075, 2021.
-
Z. Wang, J. Yang, and Y. Guo, “Unknown fault feature extraction of rolling bearings under variable speed conditions based on statistical complexity measures,” Mechanical Systems and Signal Processing, Vol. 172, p. 108964, Jun. 2022, https://doi.org/10.1016/j.ymssp.2022.108964
-
Z. Du, X. Chen, H. Zhang, and Y. Yang, “Low-rank enhanced convolutional sparse feature detection for accurate diagnosis of gearbox faults,” Mechanical Systems and Signal Processing, Vol. 150, p. 107215, Mar. 2021, https://doi.org/10.1016/j.ymssp.2020.107215
-
X. Zhong, Q. Mei, X. Gao, and T. Huang, “Fault diagnosis of rolling bearings based on improved direct fast iterative filtering and spectral amplitude modulation,” Proceedings of the Institution of Mechanical Engineers, Part C: Journal of Mechanical Engineering Science, Vol. 236, No. 9, pp. 5111–5123, Jan. 2022, https://doi.org//10.1177/09544062211055657
-
Z. Ma, M. Zhao, X. Dai, B. Ma, and H. Bi, “Optimized spectral amplitude modulation based on generalized envelope for bearing compound fault diagnosis,” in 5th International Conference on Intelligent Control, Measurement and Signal Processing (ICMSP), pp. 1–6, May 2023, https://doi.org/10.1109/icmsp58539.2023.10171055
-
A. G. Hafez and E. Ghamry, “Geomagnetic sudden commencement automatic detection via MODWT,” IEEE Transactions on Geoscience and Remote Sensing, Vol. 51, No. 3, pp. 1547–1554, Mar. 2013, https://doi.org/10.1109/tgrs.2012.2207962
-
K. Zhang, P. Chen, M. Yang, L. Song, and Y. Xu, “The Harmogram: A periodic impulses detection method and its application in bearing fault diagnosis,” Mechanical Systems and Signal Processing, Vol. 165, p. 108374, Feb. 2022, https://doi.org/10.1016/j.ymssp.2021.108374
-
D. Wang, Y. Zhao, C. Yi, K.-L. Tsui, and J. Lin, “Sparsity guided empirical wavelet transform for fault diagnosis of rolling element bearings,” Mechanical Systems and Signal Processing, Vol. 101, pp. 292–308, Feb. 2018, https://doi.org/10.1016/j.ymssp.2017.08.038
-
Z. Jiang, K. Zhang, L. Xiang, G. Yu, and Y. Xu, “A time-frequency spectral amplitude modulation method and its applications in rolling bearing fault diagnosis,” Mechanical Systems and Signal Processing, Vol. 185, p. 109832, Feb. 2023, https://doi.org/10.1016/j.ymssp.2022.109832
-
S. Shao, S. Mcaleer, R. Yan, and P. Baldi, “Highly accurate machine fault diagnosis using deep transfer learning,” IEEE Transactions on Industrial Informatics, Vol. 15, No. 4, pp. 2446–2455, Apr. 2019, https://doi.org/10.1109/tii.2018.2864759
About this article

This research work was supported by the National Natural Science Foundation of China (611175054); Natural Science Foundation of Zhejiang Province (LY16E050001); Cixi City Science and Technology Plan Project:(2023CXS080009); Cixi City Science and Technology Project (CZ2023006); Cixi City Science and Technology Project (CZ2025003).
The datasets generated during and/or analyzed during the current study are available from the corresponding author on reasonable request.
Zongcai Ma: writing-original draft preparation, writing-review and editing. Yongqi Chen: conceptualization. Qinge Dai: data curation. Linqiang Wu: software. Yitong Qin: formal analysis.
The authors declare that they have no conflict of interest.
