Abstract
To improve the operational stability of the anchor winch, parametric reconstruction of the winch drum structure was conducted based on surrogate model technology. With the stress peak value and natural frequency as constraint conditions, lightweight design of the overall structure was implemented, effectively achieving energy conservation and consumption reduction. A parametric model coupling strength and modal characteristics of the winch drum was established using the finite element method. Taking the stress peak value, first-order natural frequency, and mass as objective functions, a response surface was fitted according to the mapping relationship with discretized parameter dimensions, and error verification was conducted. An optimization mathematical model of the winch drum was constructed, and the sequential quadratic programming (SQP) algorithm was adopted to solve the extremum of the model under different constraint conditions. Research indicates that the proxy model exhibits high accuracy. Under conditions of 1 time and 1.5 times the peak stress, the weight of the anchor drum can be reduced by 17.4 % and 27.6 %, respectively, with the natural frequencies remaining no lower than the initial values. The research method can significantly improve the cost-effectiveness of mechanical design and achieve good energy-saving and consumption reducing effects.
Highlights
- A parametric coupled analysis model for modality and strength is established, within which the coupled effects of structural variables on maximum stress and natural frequency are considered synchronously.
- Parametric surrogate model technology is introduced to improve optimization efficiency and accuracy.
- A multi-constraint and multi-objective optimization system is constructed.
1. Introduction
The windlass is an indispensable core deck equipment in the field of marine engineering, entrusted with key functions such as anchor lifting, anchoring, ship positioning, and emergency braking [1]. Its operational stability directly determines the operational safety and reliability of ships in scenarios including port berthing and offshore navigation, and is of great significance for ensuring the efficiency of ship transportation. As the core load-bearing and force-transmitting component of the windlass, the winch drum endures long-term tensile forces from steel wire ropes, dynamic loads, and vibrational excitations. The rationality of its structural design directly affects the overall performance of the windlass [2-5]. Currently, traditional winch drum designs are mostly based on empirical analogy and conservative safety factors, which generally exhibit problems such as bulky structure, local stress concentration, and high risk of mechanical resonance. These issues not only result in slow start-up and braking response speeds of the windlass, failing to meet the requirements for rapid and continuous operations of modern ships, but also significantly increase ship manufacturing costs, navigation fuel consumption, and deck bearing loads. Therefore, conducting strength analysis, modal characteristic research, and lightweight optimization design of winch drums has become an important research direction for energy conservation, consumption reduction, quality improvement, and efficiency enhancement of marine equipment.
With the development of the marine industry towards large-scale, energy-saving, and intelligent directions, the structural optimization of winch drums has emerged as a research hotspot among scholars worldwide. Currently, research in the field of winch drum structural design and optimization mainly focuses on performance optimization under dynamic loads. For instance, Mihai [6] analyzed the composite stress of the drum under extreme braking loads by considering the coupling effect of stress fields, providing support for material selection and strength design. Jassinbekov [7] proposed a structural improvement scheme to reduce the maximum stress of the drum based on stress distribution characteristics. Quynh [8] studied the improvement measures for the deviation problem in modal testing. By accurately measuring and analyzing the vibration characteristics of the structure, combined with structural optimization methods, the first-order natural frequency can be significantly increased, thereby reducing the probability of resonance.
Although extensive research has been carried out on the optimization of winch drums, combined with practical engineering requirements and the current status of technological application, prominent limitations are still exhibited by existing research models. For instance, in the construction of performance analysis models, the link of performance coupling analysis is lacking, and the coupling effects between strength (stress) and modality (natural frequency) are ignored. In the establishment of mathematical optimization models, the mapping relationship between design variables and optimization objectives fails to be accurately fitted, which results in a large computational load and low efficiency in the optimization process, and the global optimality of optimization results is difficult to be guaranteed.
To address the aforementioned research gaps, combined with the structural characteristics and engineering requirements of winch drums, an optimization design method based on parametric surrogate models are proposed. The core innovations are as follows: (1) A parametric coupled analysis model for modality and strength is established, within which the coupled effects of structural variables on maximum stress and natural frequency are considered synchronously. Thus, the secondary verification of the matching degree between strength and vibration performance is not required in the subsequent stage. (2) Parametric surrogate model technology is introduced to improve optimization efficiency and accuracy. The functional relationship between design variables and multiple optimization objectives is accurately fitted, and high-efficiency and high-precision optimization is achieved. (3) A multi-constraint and multi-objective optimization system is constructed, and extreme value search algorithms are integrated to realize multi-scenario optimization. Lightweight design is conducted under different stress peak scenarios, and the engineering promotion value of research results is enhanced. In addition, through this optimization method, the structural optimization of the winch drum can simultaneously reduce the operational noise of the entire windlass, improve the working environment, reduce the failure probability of other components caused by drum vibration, extend the overall service life of the windlass, and further enhance its reliability and economy in industrial production.
The lightweight design method of the anchor winch drum is mainly guided by green policies, centered on performance improvement, and supported by technological innovation. It serves not only as a technical breakthrough to address the drawbacks of heavyweight and low efficiency in traditional anchor windlasses, but also as an inevitable choice for the low-carbon transformation, quality improvement and efficiency enhancement of the shipbuilding industry. Its significance lies not only in the weight reduction of a single piece of equipment, but also in the value improvement of the entire ship, the full life cycle and the whole industrial chain, and it is of great strategic significance for promoting the green, intelligent and high-quality development of the shipping industry.
2. Establishment and analysis of parametric finite element coupling model
2.1. The design of the channel model
To ensure the safety and flexibility of the windlass, the structure of the designed winch drum is shown in Fig. 1, which is composed of a cylinder body, side plates, rib plates, and a braking zone. Flanges are arranged at both ends of the winch drum to fix the ends of the anchor chain, preventing axial movement of the anchor chain during winding and unwinding. The braking zone can be connected to a brake and is equipped with an overload protection function. To adapt to the winch drum that bears heavy anchor chains and operates at high winding and unwinding speeds, reinforcing ribs are adopted to enhance structural strength and stiffness. Additionally, the design of the long shaft of the winch drum is intended to prevent the anchor chain from deviating during transmission. Considering the effects of each component on mass and mechanical properties, and on the premise of no structural interference or impact on assembly, the initial design values and value limits of five parametric dimensions are defined and presented in Table 1.
Fig. 1Overall structure and parameter definition of anchor winch drum
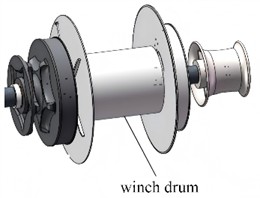
a) Windlass transmission structure
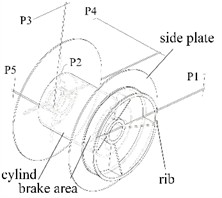
b) Parametric dimensions
Table 1Parameterized structural dimension setting
Parameter | Initial value/mm | Upper limit percentage / % | Lower limit percentage / % |
P1 | 16 | 25 | 25 |
P2 | 18 | 33.3 | 33.3 |
P3 | 16 | 25 | 25 |
P4 | 15 | 20 | 33.3 |
P5 | 18 | 33.3 | 33.3 |
To ensure strength and toughness, the winch drum is made of Q235 steel, which can withstand large tensile forces. When parametric modeling is performed in SolidWorks, a prefix “DS” needs to be added before the names of dimensional parameters to ensure these parameters can be recognized by ANSYS, enabling synchronous data update.
Fig. 2Parameterized model coupling flowchart
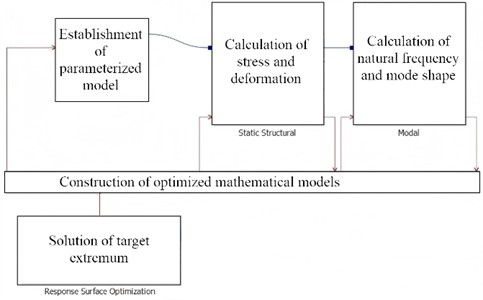
In ANSYS, the coupling between modality and strength is usually achieved by setting multi-field coupling relationships [9, 10]. Relevant modules in ANSYS Workbench (such as System Coupling) can be utilized to define this coupling relationship, as shown in Fig. 2. Specifically, it is necessary to correlate the structural vibration characteristics obtained from modal analysis (e.g., natural frequencies and mode shapes of each order) with the structural stress and deformation characteristics derived from strength analysis (e.g., deformation and stress values). This correlation is intended to clarify how deformation caused by vibration affects stress distribution and how stress distribution, in turn, influences vibration characteristics during structural vibration.
2.2. Loads and boundary conditions
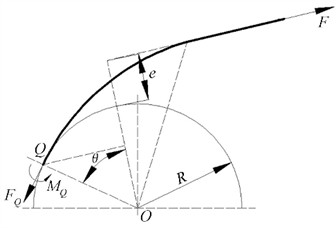
The external loads acting on the anchor winch drum during operation mainly include the gravitational load, which is composed of the weight of the drum's own structure and the stored chain, the tension force exerted by the chain tensioning device, and the starting inertial load generated during the starting and braking phases of the winch. At a specific winding angle of the chain on the drum, the chain tension can be orthogonally decomposed into the tangential direction and the radial direction relative to the drum. The tangential force is mainly used to drive the drum rotation, while the radial force directly acts on the surface of the drum barrel, forming the radial load on the drum. As the chain is continuously wound on the drum, due to the differences in contact arc length and friction coefficient between each layer of the chain and the drum, the tension load distribution of different layers exhibits significant nonlinear characteristics. To accurately analyze the stress state of the drum, it is necessary to comprehensively consider factors such as the chain conveying angle and friction characteristics, and establish a force analysis model for the chain winding around the anchor winch drum, as shown in Fig. 3. Let the chain pulling force be , at the contact point , the moment acting on the anchor winch drum is:
The tangential force can be calculated as:
Fig. 3Mechanical analysis model
When the anchor winch drum is started, the chain needs to be accelerated from a static state to a certain operating speed, and inertial forces are thereby generated. Based on the extreme working conditions of the anchor winch, the inertial load can be applied by defining the maximum starting acceleration. The anchor winch drum is mounted using a dual-support configuration, meaning both ends are mounted on the support via bearings. The bearings at both ends restrict the radial displacement of the anchor winch drum, and displacements in the direction perpendicular to its axis are limited, thus can be regarded as radial fixed constraints. For axial constraints, one end restricts axial displacement, while the other allows a certain degree of axial movement.
2.3. Mesh generation and quality verification
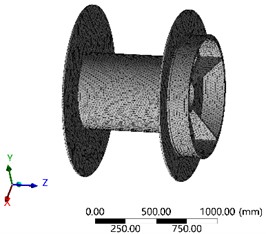
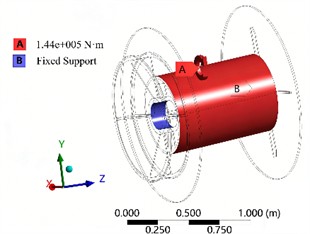
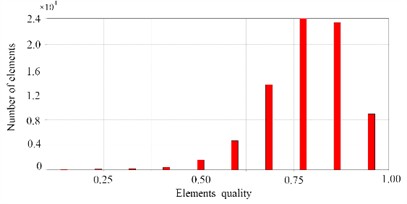
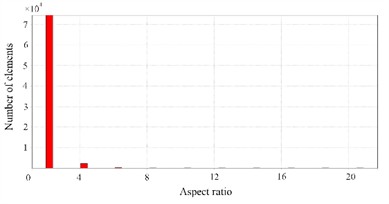
For finite element analysis, the quality of mesh generation exerts a crucial influence on computational accuracy, convergence rate, and result reliability [11]. Given the complex structural characteristics of the anchor winch drum assembly, an adaptive mesh generation technique combining global mesh sizing with local mesh refinement is employed in this study to significantly improve the analytical accuracy of critical stress concentration regions while ensuring computational efficiency. Through this approach, the final model is found to consist of 332,520 elements and 401,895 nodes, with the overall mesh configuration shown in Fig. 4(a). To ensure that the mesh quality meets the requirements of subsequent mechanical analysis, key indicators such as the element quality and aspect ratio are systematically calculated and verified, with the specific results presented in Fig. 4(c-d), respectively. According to Eq. (1-2), taking into account the gravity factor, the cylindrical surface of the bearing connection inside the drum is defined as a fixed constraint, and the torque on the outer cylindrical surface is set to 1.44×10⁵ N·m, as shown in Fig. 4(b).
The element quality coefficient is a core quantitative indicator for evaluating whether the mesh element size settings and shapes in a finite element model are reasonable and appropriate. The value range of this coefficient is typically from 0 to 1. The closer the value is to 1, the more regular the shape of the mesh element (such as approaching a square or a regular tetrahedron), and the better the mesh quality. The closer the value is to 0, the more deformed the element shape (such as elongated, flat, or severely distorted), and the worse the mesh quality. In engineering practice, to ensure the accuracy and stability of numerical calculations, it is generally required that the average value of the element quality coefficient is not less than 0.7. When the overall coefficient meets this standard, it can be determined that the current mesh size setting is feasible.
Fig. 4Mesh verification and boundary condition setting
a) Boundary condition setting
d) Boundary condition setting
b) The division of the finite element mesh
c) Distribution of element quality coefficients
The aspect ratio is another key mesh quality indicator, which is defined as the ratio of the length of the longest side to the shortest side of an element. This ratio directly reflects the geometric shape characteristics of the element. For triangular elements, the ideal aspect ratio is 0.577. For quadrilateral elements, the ideal aspect ratio is 1. Typically, the more the element shape deviates from an equilateral triangle or a square, the larger its aspect ratio becomes. In the default settings of finite element analysis software, when the aspect ratio of an element reaches 20, a warning message will be issued, prompting the user that there may be problems with the mesh quality in this area and that it needs to be checked or adjusted. When the aspect ratio exceeds 106, an error message will be directly popped up, forcing the calculation to be interrupted, as the element shape will have been severely distorted at this point, which can lead to the divergence of the numerical solution or the unreliability of the results.
2.4. Convergence verification of finite element model
Convergence verification is a core step for ensuring that the constructed finite element model can accurately and stably simulate actual physical phenomena. This process involves systematically varying key computational parameters such as mesh density and time step size, and tracking and analyzing core response indicators output by the model (such as maximum residual force, maximum degree of freedom increment, and stress/displacement distribution), to determine whether they tend to a stable and accurate value with the optimization and adjustment of parameters. This verification can not only evaluate the numerical stability of the model itself and the effectiveness of the solution algorithm, but also fundamentally ensure the reliability and physical meaning of the final calculation results, making it an indispensable quality control link in engineering simulation and scientific computing.
The variation laws of maximum residual force and maximum degree of freedom increment with the number of iterations are shown in Fig. 5. From the curves in the figure, it can be clearly observed that with the increase of the number of iterations, both of these two indicators show an obvious downward trend and eventually tend to be flat without significant changes. At the same time, by calculating the relative error between the results of two adjacent iterations and comparing it with the preset convergence criterion, it is found that the relative error also meets the convergence requirements. The above phenomena collectively indicate that under the current calculation settings, the selection of the time step is appropriate, the calculation process has reached a convergent state, and the calculation results of the model have sufficient accuracy and reliability to be used for subsequent engineering analysis and decision-making.
Fig. 5Convergence verification curves
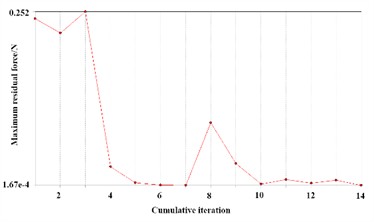
a) Verification results of maximum residual force
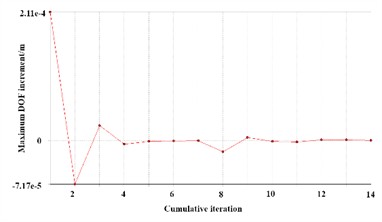
b) Verification results of maximum degree of freedom increment
2.5. Strength and modal analysis
Under the condition where the anchor chain reaches its maximum design tension, the final strength analysis results are obtained through iterative calculations, as shown in Fig. 6. From the obtained stress cloud and displacement cloud diagrams, it can be clearly observed that: the anchor winch drum maintains a relatively high safety factor under this extreme load, with its maximum stress value being much lower than the yield strength of the selected material, indicating sufficient load-bearing margin of the material; meanwhile, no obvious stress concentration problem occurs in the key parts of the structural design scheme, further verifying the rationality and reliability of the design. In terms of displacement response, the maximum displacement of the anchor winch drum model is only 0.33 mm, indicating that the structure has good stiffness when subjected to extreme loads and can effectively meet the safety requirements of ship mooring operations.
Fig. 6Static structural analysis results
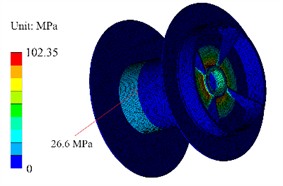
a) Stress results
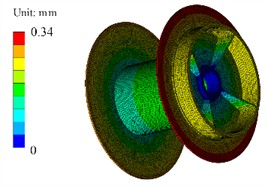
b) Displacement results
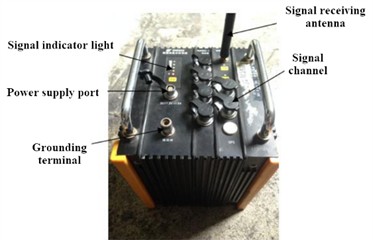
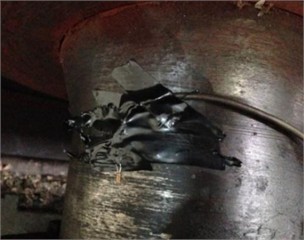
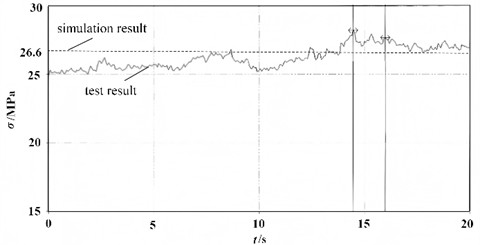
To verify the consistency between the established finite element model and the actual working conditions and ensure the reliability of numerical simulation results, the DH5902 data acquisition and analysis system was adopted in this study, and high-precision strain gauges were used to conduct synchronous and long-term dynamic stress tests on the critical stress areas of the anchor winch drum side plate. The test data were systematically compared with the finite element simulation results, and the specific test and comparison process and results are shown in Fig. 7. The photographs used for experimental verification were taken by Guangqian Zhou on December 20, 2025, in Chengdu city. The DH5902 dynamic signal test and analysis system is a professional test equipment with a wide range of applications. Its core advantage lies in the powerful ability of multi-channel parallel synchronous high-speed long-term continuous sampling, which can collect high-precision data with extremely high reliability and stability in complex dynamic loading environments. Under the same loading conditions as the simulation, the test points were arranged 200mm inward from the anchor winch drum side plate to capture the real stress response of this area under extreme working conditions.
Fig. 7Experimental verification of the finite element model
a) Data acquisition system
b) The installation position of strain gauges
c) Tested and simulated stress values
From the comparative analysis results in Fig. 7(c), it can be clearly observed that when the load is maintained at 14.5 s, the stress response value rises rapidly and finally tends to a stable state, with an average stress value of 27.9 MPa after stabilization. A quantitative comparison was made between the measured value of this steady-state stress and the finite element simulation results (26.6 MPa) as shown in Fig. 6(a), and it was found that the deviation between the two is only 4.7 %, which is within the engineering acceptable range. The above results collectively prove that the finite element model established in this study has good computational accuracy and predictive ability, and fully meets the accuracy requirements for subsequent engineering analysis and applications.
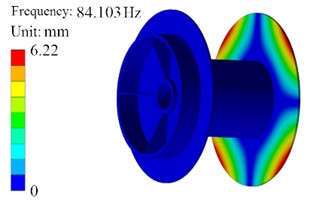
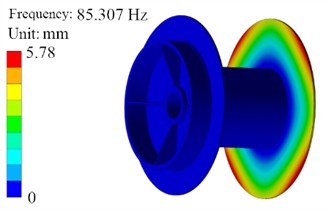
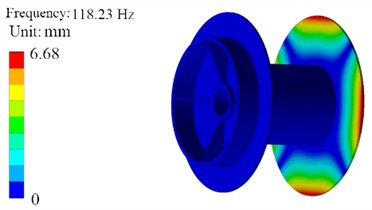
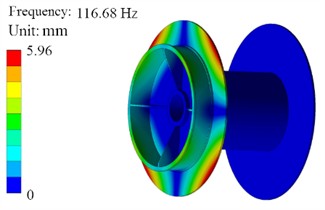
Through the simulation calculation of the coupled strength and modal model, the first two-order natural frequencies and mode shape contour plots of the anchor winch drum under the influence of structural loads are obtained, as shown in Fig. 8. It can be seen that the first-order and second-order natural frequencies are in the range of about 80-85 Hz, and the main vibration is located on the side flange plate. According to the extreme speed range of the driving and transmission components of the anchor windlass, such as the excitation components, the external maximum excitation frequency (about 27-60 Hz) is lower than the low-order natural frequencies of the anchor winch drum. Therefore, there will be no significant resonance problem in this structural design.
Fig. 8Results of the first four order modal analysis
a) The first order mode shape contour plot
b) The second order mode shape contour plot
c) The third order mode shape contour plot
d) The fourth order mode shape contour plot
3. Optimization design based on surrogate models
3.1. Combination of discrete design variables
The combination of discrete design variables serves as the foundation for establishing an optimization mathematical model, requiring an appropriate sample size [12, 13]. If the sample size is too small, the relationship between parameter variations and objectives may not be accurately reflected, leading to significant deviations in results. Conversely, an excessively large sample size will increase experimental costs and time consumption. According to the parametric dimension limits shown in Table 1, the value ranges of the vast majority of design variables exhibit a symmetric distribution. Therefore, the adoption of the Central Composite Design (CCD) method for parameter sample design can not only fully account for the interaction effects between different parameters but also achieve high surrogate model fitting accuracy with fewer sample data points.
Assuming that the objective function of the optimization calculation is and the optimization variables are (1, 2, 3, 4, 5), the local sensitivity can be expressed as:
The first-order natural frequency is defined as P6, the mass is defined as P7, the stress peak value is defined as P8, the maximum deformation is defined as P9, and the relative stiffness coefficient is defined as P10, where P10 = P6·P6·P7. The local sensitivity can express the magnitude of the rate of change of different design variables with respect to the optimization objective. The analysis results of the local sensitivity are shown in Fig. 9. It can be seen that the selected design variables are all parameters that have a critical impact on the mechanical properties, and the sensitivity trends of strength and natural frequency are opposite. Therefore, in lightweight design, design variables that simultaneously satisfy the optimization objective can be sought. The parametric combination results of the five design variables are presented in Fig. 10. It can be observed that the interactive influence between different parameters is significant, and no obvious duplicate or invalid sample data is generated. Consequently, the proposed sample design scheme is deemed feasible.
Fig. 9Results of sensitivity analysis
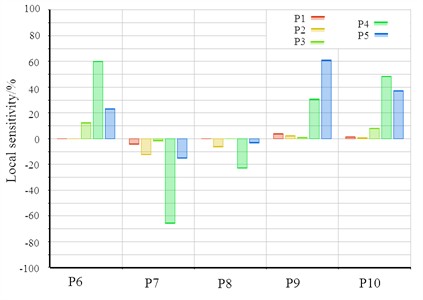
Fig. 10Interaction results of design variables
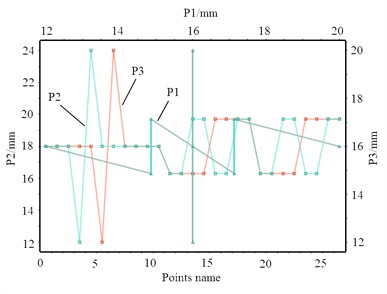
a) P1, P2 and P3
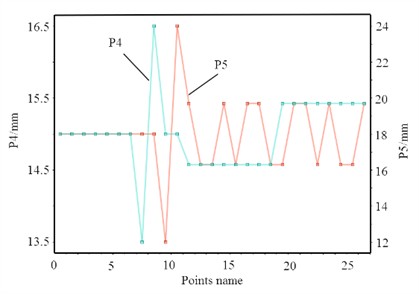
b) P4 and P5
3.2. Construction and error verification of surrogate models
Response surface functions are capable of accurately interpreting and predicting the performance and structure of the anchor winch drum by establishing mathematical relationships between input variables and output responses [14]. Therefore, this method is adopted in this study for the construction of surrogate models. To ensure the reliability of the surrogate models, the response surface functions are constructed using the Genetic Algorithm (GA), Neural Network (NN), and Kriging (K) methods, respectively.
In the construction of the response surface function using the Genetic Algorithm, a set of initial parameter combinations is determined as population individuals. By calculating the corresponding objective function values of the individuals and undergoing multiple iterations, the optimal form and parameters of the response surface function are gradually approached. In the construction of the response surface function using the Neural Network method, the mapping relationship between input and output is learned by adjusting the weights of connections between neurons, thereby constructing a response surface function that can better fit the actual data. In the construction of the response surface function using the Kriging method, the values of unknown points are predicted mainly based on the spatial distribution characteristics and correlations of known data points. A model that can reflect this spatial correlation is constructed, and then the model is used to predict unknown points, thereby forming the response surface function [15].
Fig. 11Construction of the surrogate model
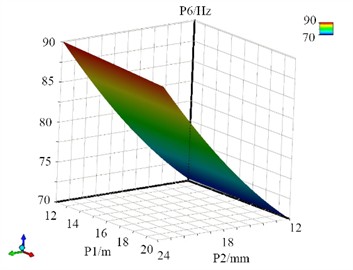
a) The response surface of P1 and P2 for P6
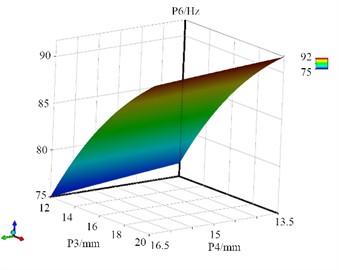
b) The response surface of P3 and P4 for P6
c) The response surface of P1 and P2 for P7
d) The response surface of P3 and P4 for P7
e) The response surface of P1 and P2 for P8
f) The response surface of P3 and P4 for P8
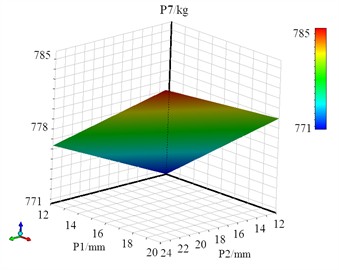
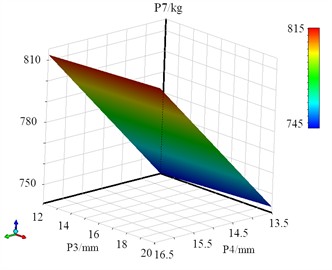
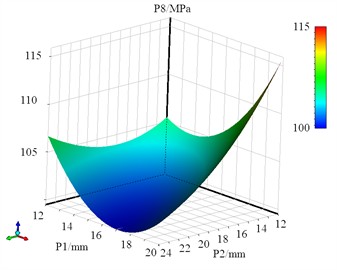
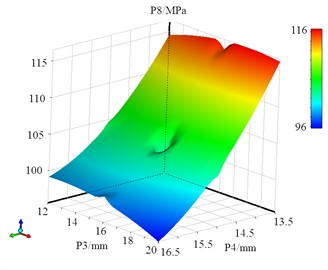
The fitting accuracies of the three response surface functions are compared. The error determination results are presented in Table 2, with the coefficient of determination (the optimal value is 1), the root mean square error RMS (the optimal value is 0), the relative maximum absolute error RMAE (the optimal value is 0), and the relative average absolute error RAAE (the optimal value is 0) as the evaluation criteria. It can be seen that both the Kriging model and the GA model can achieve high fitting accuracy. Due to the relatively small sample data of the design variables, the GA model is prioritized as the construction scheme for the surrogate model. The response surface fitting results of the first-order natural frequency, mass, and peak stress are presented in Fig. 11. It can be observed that the surrogate model belongs to a typical nonlinear function, and no singular values appear within the domain.
Table 2Verification of fitting error
Objective | Algorithm | RMS | RMAE | RAAE | |
P6 | GA | 1 | 0.005 | 0.616 | 0.15 |
NN | 1 | 0.03 | 5.02 | 1.21 | |
K | 1 | 3.86e-9 | 0 | 0 | |
P7 | GA | 1 | 1.71e-7 | 1.25 | 3.11 |
NN | 1 | 9.2e-5 | 2.05 | 0.77 | |
K | 1 | 5.33e-9 | 0 | 0 | |
P8 | GA | 1 | 0.008 | 0.54 | 0.54 |
NN | 1 | 0.001 | 0.011 | 0 | |
K | 1 | 1.26e-13 | 0 | 0 |
3.3. Solution of optimization mathematical model
To ensure that the strength and stiffness of the winch drum are not reduced after lightweight design, the target parameters P6 and P8 are converted into boundary conditions. With the minimum mass of the winch drum as the objective function, the constraints include the strength not being lower than the design value, the stiffness meeting the vibration frequency requirement, and the stability limit [12, 16-18]. The response surface method is adopted to achieve the balance between structural lightweight and performance. According to the performance requirements of the winch drum, an optimization mathematical model is established as:
where is the design variable matrix of the winch drum, is the initial value of the first order natural frequency, is the initial value of the stress peak, and are the minimum and maximum values of each design variable, respectively.
Due to the presence of nonlinear expressions in the objective function or constraints, the nonlinear programming method is adopted to solve the model. Nonlinear programming is relatively complex and requires continuous iteration to find the optimal value of the objective function. There are certain differences in the extreme value search obtained by different algorithms. To ensure the convergence, accuracy, and efficiency of nonlinear calculations, the sequential quadratic programming algorithm is adopted. This algorithm can reconstruct the model to search for the extreme value of a single objective function when dealing with multi-objective optimization functions. According to the results of strength analysis, the stress peak of the winch drum under the ultimate load is much smaller than the yield limit. To adjust the redundancy, two schemes are adopted for lightweight design. Scheme A sets the initial value of P8 as the boundary value, i.e., P8 ≤ 102.35 MPa. Scheme B sets the boundary value as 1.5 times the initial value of P8, i.e., P8 ≤ 153.53 MPa. The optimization objective remains unchanged. Based on the sequential quadratic programming algorithm, the parameter variables and objective extreme values of the two optimization schemes can be obtained, which are shown in Tables 3 and 4, respectively. It can be seen that Scheme A can reduce the weight of the winch drum by 17.4 % while keeping the maximum stress unchanged and slightly increasing the natural frequency. Scheme B can reduce the weight of the winch drum by 27.6 % with a maximum stress of 150.37 MPa and keep the natural frequency unchanged. Taking the two lightweight schemes as the selection basis for parts of winch drums with different power can significantly improve the cost performance of products and achieve good energy saving and consumption reduction effects.
Table 3Values of parameter variables
P1 / mm | P2 / mm | P3 / mm | P4 / mm | P5 / mm | |
Initial value | 16 | 18 | 16 | 15 | 18 |
Scheme A | 12.5 | 21.7 | 18.9 | 12.9 | 13.6 |
Scheme B | 13.3 | 22.3 | 14.1 | 13.1 | 12.0 |
Table 4Results of optimization objectives
P6 / Hz | P8 / MPa | P7 / kg | Weight loss rate / % | |
Initial value | 84.10 | 102.35 | 446.17 | – |
Scheme A | 86.27 | 94.020 | 368.25 | 17.4 |
Scheme B | 83.70 | 150.37 | 323.08 | 27.6 |
4. Conclusions
The strength and modal coupled analysis based on the finite element method enables the accurate and efficient calculation of the stress and natural frequencies of the parametric model of the anchor winch drum, providing reliable data for the surrogate model between the optimization objectives and the design variables. In this paper, the Central Composite Design method is adopted to convert the discretized finite element analysis results into a mathematical model. By comparing the extreme value solutions under different constraint conditions, a multi-objective lightweight design is effectively achieved. The main research conclusions are as follows:
1) The reliability and accuracy of the anchor winch drum simulation model are effectively ensured through the verification of the mesh quality and convergence of the finite element model, combined with stress testing. The first-order natural frequency of the anchor winch drum is 84.10 Hz, with no resonance problem occurring. The maximum stress under the allowable load of the anchor winch drum is only 102.35 MPa, which is much lower than the minimum yield strength of 235 MPa.
2) Based on the error verification results of the three different surrogate models, the Genetic Algorithm (GA) is selected to construct the response surface functions for natural frequency, mass, and peak stress. When the peak stress is constrained to a single value, a weight reduction of 14.1 % can be achieved, and when constrained to 1.5 times the peak stress, a weight reduction of 27.6 % can be achieved, with no reduction in natural frequency.
3) The research on the anchor winch drum mainly focuses on the response under extreme tension load conditions, which can effectively ensure the safety of the anchor windlass. In the future, the influence of complex environments and material nonlinearity on the load can be further considered. Besides, advanced artificial intelligence algorithms will be adopted to increase the number of sample points in subsequent research. It is expected that surrogate models with higher fitting accuracy can be established, thereby reducing computational cost and improving the overall efficiency of the optimization process.
References
-
A. Lovera, T. Coquio, and C. Peyrard, “Analysis of loads applied on floating wind turbines shared anchors,” Ocean Engineering, Vol. 324, No. 1, p. 120627, Apr. 2025, https://doi.org/10.1016/j.oceaneng.2025.120627
-
G. Chen, G. Wang, S. Liu, J. Zhu, X. Niu, and Y. Wang, “The development of a fillet design tool based on light-weight marine diesel engine crankshafts,” Journal of Marine Science and Engineering, Vol. 12, No. 10, p. 1806, Oct. 2024, https://doi.org/10.3390/jmse12101806
-
F. D. Bayramov and B. F. Bayramov, “Hydraulic systems and hydraulic drives with automatic controllers of fluid consumption and investigation of their operation,” Journal of Machinery Manufacture and Reliability, Vol. 51, No. 8, pp. 800–808, Jan. 2023, https://doi.org/10.3103/s1052618822080040
-
H. Sun, J. Wang, and W. Chi, “Modal analysis and lightweight design of key components of the anchor windlass,” Vibroengineering Procedia, Vol. 57, pp. 126–132, Dec. 2024, https://doi.org/10.21595/vp.2024.24601
-
Y. Pi, J. Zhang, X. Tang, and J. Zhu, “Three-dimensional dynamic modeling and simulation of a multi-cable winding hoister system considering bidirectional coupling between cage and flexible guides,” Journal of Vibration and Control, Vol. 29, No. 7-8, pp. 1678–1699, Mar. 2022, https://doi.org/10.1177/10775463211068901
-
S. M. Radu, F. D. Popescu, A. Andraș, Z. Virág, I. Brînaș, and M.-I. Draica, “A thermo-mechanical stress based fatigue life evaluation of a mine hoist drum brake system using COMSOL multiphysics,” Materials, Vol. 15, No. 19, p. 6558, Sep. 2022, https://doi.org/10.3390/ma15196558
-
O. Jassinbekov, M. Isametova, and G. Kaldan, “Development of a technique for computer simulation of the stress state of the drive drum shell of a belt conveyor to optimize its design parameters,” Eastern-European Journal of Enterprise Technologies, Vol. 2, No. 7 (110), pp. 31–39, Apr. 2021, https://doi.org/10.15587/1729-4061.2021.229213
-
L. Quynh, Z. Jianrun, N. Liem, B. Cuong, L. X. Long, and D. T. Phuong, “Experimental modal analysis and optimal design of cab’s isolation system for a single drum vibratory roller,” Vibroengineering Procedia, Vol. 31, pp. 52–56, May 2020, https://doi.org/10.21595/vp.2020.21325
-
D. C. Simone, A. Messina, and L. Soria, “Modal analysis through response-based FRFS: additional modes for local diagnoses,” Journal of Sound and Vibration, Vol. 549, No. 1, p. 117574, Apr. 2023, https://doi.org/10.1016/j.jsv.2023.117574
-
R. Talebitooti, M. Zarastvand, and H. Darvishgohari, “Multi-objective optimization approach on diffuse sound transmission through poroelastic composite sandwich structure,” Journal of Sandwich Structures and Materials, Vol. 23, No. 4, pp. 1221–1252, Apr. 2019, https://doi.org/10.1177/1099636219854748
-
R. Talebitooti, H. D. Gohari, and M. R. Zarastvand, “Multi objective optimization of sound transmission across laminated composite cylindrical shell lined with porous core investigating non-dominated sorting genetic algorithm,” Aerospace Science and Technology, Vol. 69, No. 1, pp. 269–280, Oct. 2017, https://doi.org/10.1016/j.ast.2017.06.008
-
H. D. Chalak, A. M. Zenkour, and A. Garg, “Free vibration and modal stress analysis of FG-CNTRC beams under hygrothermal conditions using zigzag theory,” Mechanics Based Design of Structures and Machines, Vol. 51, No. 8, pp. 4709–4730, Aug. 2023, https://doi.org/10.1080/15397734.2021.1977659
-
A. Daşdemir, “A modal analysis of forced vibration of a piezoelectric plate with initial stress by the finite-element simulation,” Mechanics of Composite Materials, Vol. 58, No. 1, pp. 69–80, Mar. 2022, https://doi.org/10.1007/s11029-022-10012-7
-
C. Wu, S. Wang, J. Long, and Q. Liu, “Research on modular design and manufacturing of ship anchor winch structure under artificial intelligence optimisation,” International Journal of Wireless and Mobile Computing, Vol. 22, No. 2, p. 148, Jan. 2022, https://doi.org/10.1504/ijwmc.2022.123315
-
R. N. Ferreira, J. C. Falleiros, P. R. Zampieri, J. V. Ferreira, and M. L. Bittencourt, “Experimental and numerical fatigue evaluation of lightweight crankshafts,” Results in Engineering, Vol. 23, p. 102730, Sep. 2024, https://doi.org/10.1016/j.rineng.2024.102730
-
H. K. Celik, I. Akinci, N. Caglayan, and A. E. W. Rennie, “Structural strength analysis of a rotary drum mower in transportation position,” Applied Sciences, Vol. 13, No. 20, p. 11338, Oct. 2023, https://doi.org/10.3390/app132011338
-
J. Wang, C. Xu, Y. Xu, X. Qi, Z. Liu, and H. Tang, “Vibration analysis and parameter optimization of the longitudinal axial flow threshing cylinder,” Symmetry, Vol. 13, No. 4, p. 571, Mar. 2021, https://doi.org/10.3390/sym13040571
-
R. K. Bhamu, A. Shukla, S. C. Sharma, and S. P. Harsha, “Vibration response of steam turbine healthy and cracked blade under the stress stiffening and spin softening effects,” Proceedings of the Institution of Mechanical Engineers, Part K: Journal of Multi-body Dynamics, Vol. 236, No. 2, pp. 224–243, Feb. 2022, https://doi.org/10.1177/14644193221078656
About this article

The paper is supported by Provincial Key Research and Development Program Project (2024YFG0155).
The datasets generated during and/or analyzed during the current study are available from the corresponding author on reasonable request.
Guangqian Zhou and Lihong Guo are responsible for experimental operations and data analysis. Guangqian Zhou and Xuehong Huang are responsible for project supervision and summarizing and writing important academic content of the manuscript.
The authors declare that they have no conflict of interest.

