Abstract
Cable dome is a special flexible structure made of cable strut beam and membrane. Non-fully symmetric Geiger cable dome is a new Geiger cable dome with the characteristics of eighth symmetry and octagon plane. Membrane and initial prestress are the important portions of a cable dome and determined its dynamic properties. In this paper two aspects are analyzed to illustrate the dynamics properties of the non-fully symmetric Geiger cable dome. Firstly the natural vibration characteristics of three models (cable-strut-beam model, cable-membrane model and cable-strut-beam-membrane model) are comparatively analyzed. These researches indicate that membrane and initial prestress are proved to be the major effects on the natural vibration of the cable dome. Next, using linear filter Auto-Regressive (AR) method, the horizontal and vertical fluctuating wind velocity time-history curves of the cable dome are obtained. At the same time the shape coefficient of the cable dome is simulated by CFD method. The wind-induced response of cable-strut-beam-membrane model is analyzed by Newmark method. These results show that this cable dome is sensitive to the fluctuating wind load and this structure has deeper geometrical nonlinearity. These studies are valuable to the design of the non-fully symmetric Geiger cable dome.
1. Introduction
Cable dome is a particular flexible structure made up of cable-strut-beam and membrane. It has features of large span capacity, lightweight, simple form, low cost and short construction period. Geiger cable dome is the earliest cable dome used in large span roof and attracted extensive researches since its appearance. The natural vibration frequency of the cable-membrane structure is low and closer, so this structure is very flexible and sensitive to the wind load (Zhang, 1985 [1]; Shen, 2006 [2]).
Many studies have been done about dynamic analysis of the flexible structure. Grutndig et al. (1988) [3] test the frequency of a cable dome. Gluck et al. (2003) [4] analyse the wind vibration of the cable-strut structure considering fluid-structure coupling. Zhang (2001) [5] simulates the fluctuating wind velocity time-history curve and analyses the fluctuating wind induced response of the cable-strut cable dome. Hu (2003) [6] studies the stable analysis of the cable-strut-membrane with mean wind pressure by CFD method. On the other hand, many studies about wind-induced response analysis and dynamics analysis (Wu, 2003 [7]; Barnard, 2000 [8]; He et al., 2003 [9]; Li et al., 2001 [10]; Yasushi et al., 1997 [11]) of space structures have been done also.
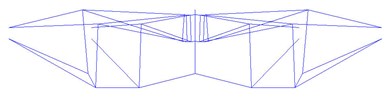
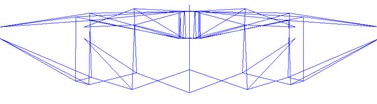
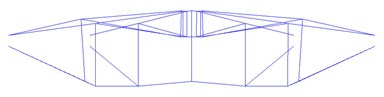
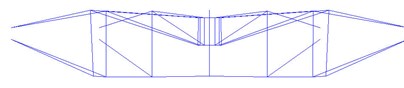
Non-fully symmetric Geiger cable dome is a new Geiger cable dome with eighth symmetry (see Fig. 1). Now the dynamic properties research of the cable dome focuses on the cable-strut structure, the cable dome is really a cable-strut-beam structure, so the cable-strut-beam model was considered as the analysis model in this paper. At the same time the effects of the membrane are taken into account simultaneously.
This paper is organized as follows: firstly the model of the non-fully symmetric Geiger cable dome is introduced. Next the natural vibration properties of three models (cable-strut-beam model, cable-membrane structure and cable-strut-beam-membrane (see Fig. 2)) are studied. At the same time, the effects on the natural vibration properties from the initial pre-stress of the membrane were analyzed also. Then, using AR method, the many points of horizontal and vertical fluctuating wind velocity time-history curve of this structure were simulated. The wind-induced response analysis of the non-fully symmetric Geiger cable dome is carried out by Newmark method. Finally the conclusion is summarized about the natural vibration characteristics and wind-induced response properties of the non-fully symmetric Geiger cable dome.
2. Non-fully symmetric Geiger cable dome
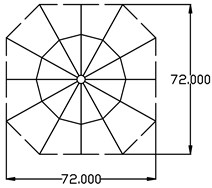
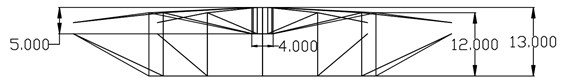
Fig. 1The plain and elevation of non-fully symmetric Geiger cable dome (m)
(a)
(b)
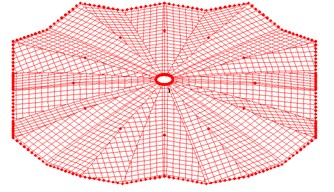
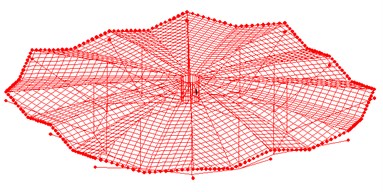
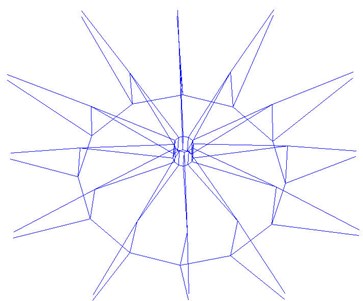
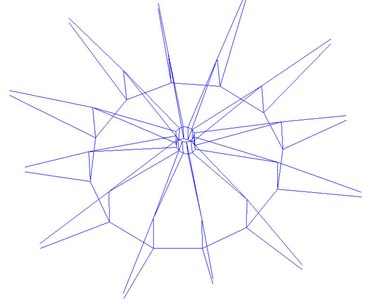
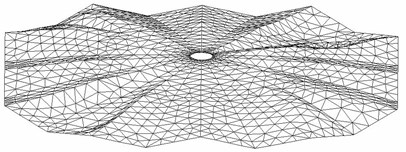
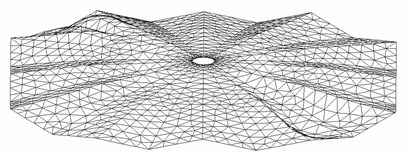
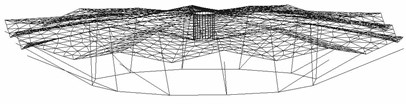
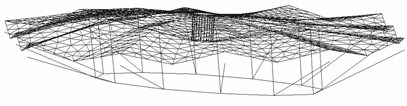
Fig. 2Cable-membrane model and cable-strut-beam-membrane model of the cable dome
(a)
(b)
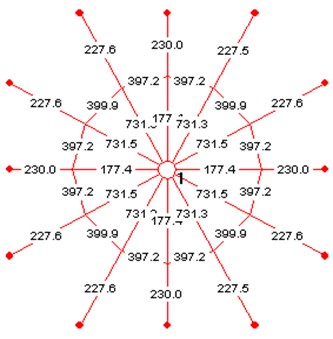
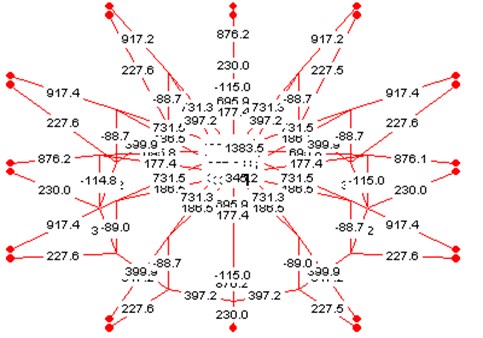
Fig. 1 describes the plain view and the elevation view of the non-fully symmetric Geiger cable dome and the sizes of this structure are also illustrated. The plane of this structure is octagon and the span is 72 m, 13 m high. Fig. 2 shows the upper cable membrane model of the cable dome and the integrated non-fully symmetric Geiger cable dome. The initial pre-stress of the cable and strut are illustrated in Fig. 3.
Fig. 3The initial pre-stress of the cable and strut
3. Natural vibration analysis
Based on the Hamilton fluctuating theory, the free vibration equation without damper is given by:
where , are the mass and stiffness matrices, is the nodal displacement vector. If is the circular frequency of the structure, then:
where is the eigenmode. Solving Eqn. (2) the frequency and mode of vibration can be obtained. Next the frequency and mode of vibration of the cable-strut-beam model, the cable-membrane model and the cable-strut-beam-membrane model will be illustrated.
4. Mode analysis of the cable-strut-beam model
The first natural frequency is 0.6458 Hz, so the structure is very flexible. The first twenty natural vibration modes all occur in the integral torsion along hoop (see Fig. 4a and 4b); the 21st, 23rd, 26th, 30th modes show vertical vibration. These characteristics indicate that the torsional stiffness of the cable-strut-beam model is weak, while the vertical stiffness is strong reversely.
Fig. 4Mode of vibration of the cable-strut-beam model
(a) 1st mode ( 0.6458 Hz)
(b) 4th mode ( 1.4524 Hz)
(c) 21st mode ( 2.0672 Hz)
(d) 23rd mode ( 2.2335 Hz)
(e) 26th mode ( 2.7983 Hz)
(f) 30th mode ( 5.7392 Hz)
5. Mode analysis of the cable-membrane model
The calculation model displays in Fig. 2a. The boundary of this membrane is fixed; the initial stress of the membrane considered is of two kinds: 4 kN/m and 6 kN/m; the thickness of this membrane is 0.001 m.
Table 1The 1st–10th natural frequencies (Hz)
1 | 2 | 3 | 4 | 5 | |
4 kN/m | 3.2059 | 3.2064 | 3.2064 | 3.2071 | 3.6753 |
6 kN/m | 3.6088 | 3.6091 | 3.6091 | 3.6094 | 4.1883 |
6 | 7 | 8 | 9 | 10 | |
4 kN/m | 3.7521 | 3.7703 | 3.7743 | 3.7901 | 3.7901 |
6 kN/m | 4.1964 | 4.1964 | 4.2085 | 4.2468 | 4.2603 |
These results indicate that: the mode of vibration displays vertical vibration (Fig. 5); the frequency will increase with the initial stress of the membrane increasing. So the initial stress of the membrane can reinforce the vertical stiffness of the membrane.
Fig. 5The 1st and 2nd mode of vibration of the membrane
(a) 1st mode
(b) 2nd mode
6. Mode analysis of the cable-strut-beam-membrane model
This calculation model adopts the model in Fig. 2b. The initial stress of membrane respectively is set to two kinds: 4 kN/m and 6 kN/m.
Table 2The 1st-10th natural frequencies (Hz)
1 | 2 | 3 | 4 | 5 | |
4 kN/m | 0.9254 | 1.28 | 1.28 | 2.1153 | 2.2849 |
6 kN/m | 1.2784 | 1.2784 | 2.0990 | 2.1270 | 2.6814 |
6 | 7 | 8 | 9 | 10 | |
4 kN/m | 2.7569 | 2.9179 | 2.9179 | 2.9402 | 2.9577 |
6 kN/m | 2.8056 | 2.9449 | 2.9449 | 2.9536 | 3.0173 |
The first frequencies of the cable-strut-beam-membrane model and the cable-strut-beam model are very close when the initial stress of the membrane is 4 kN/m. In the 1st and 2nd modes of vibrations simultaneously occur torsion and vertical vibration (Fig. 6), while the first twenty vibration modes of the cable-strut-beam model display torsion only. So the membrane can reinforce the torsional capacity of the cable-strut intersection. At the same time the torsional capacity augments 40 % with the initial stress of the membrane increasing. So the vibration properties of the whole structure are determined by the topological relation, the pre-stress level of the structure. The membrane is the necessary component of the cable dome.
Fig. 6The 1st and 2nd modes of vibrations of the integral model
(1) 1st mode
(2) 2nd mode
From these studies the natural frequency of the cable-strut-beam-membrane model is very low, so this structure is flexible and sensitive to the wind load and the wind-induced response analysis of this structure will be carried out. In this analysis the wind velocity time-history curve of the structure will be simulated by AR method. Then, solving the nonlinear dynamic equation using the Newmark method, the wind-induced response of the cable dome will be obtained.
7. Wind velocity time-history curve
7.1. Wind velocity spectrum
In this paper Davenport spectrum and Pannofy spectrum are used to simulate horizontal and vertical wind velocity of the cable dome. Davenport spectrum is given by:
where is the roughness coefficient, is the mean wind velocity of ten-meters high, is the frequency.
Pannofy spectrum is given by:
where is the latitude of the wind load working point.
7.2. Simulation of the fluctuating wind velocity time-history curve
The wind velocity of random point includes two parts: the mean wind velocity and the fluctuating wind velocity , namely:
The fluctuating wind velocity can be simulated by AR method.
7.3. Wind velocity time-history curve of the cable dome
The wind velocity time-history curves of 24 nodes are simulated by AR method and the center node wind velocity of every area is used to represent 1–24 area. On the assumption that roughness of terrain is 0.16, mean wind velocity is 25 m/s, regression number is 4, interval of time is 0.1 s and the time of the wind velocity time-history curve is 200 s. Based on the geometrical properties of cable dome the wind velocity time-history curves of nodes 1–4 represent the whole structure.
Fig. 7Area and node numbers of cable dome
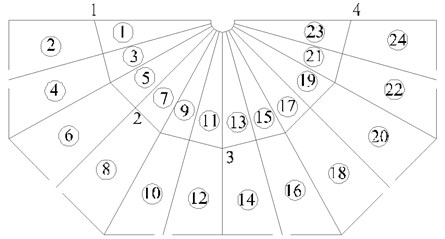
Fig. 8Horizontal wind velocity time-history curves of nodes 1 and 2
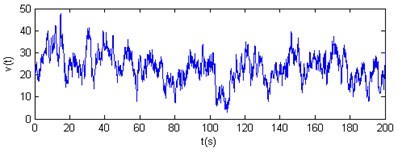
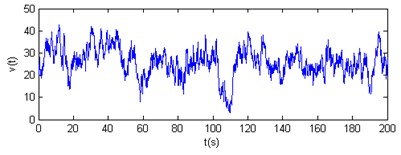
Fig. 9Horizontal wind velocity time-history curves of nodes 3 and 4
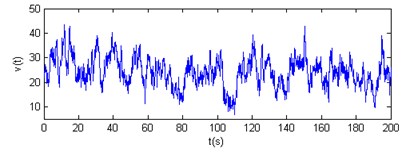
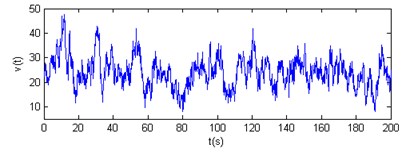
Fig. 10Contrast of horizontal velocity power spectrum and Davenport spectrum
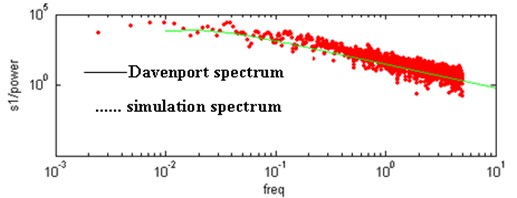
Fig. 11Vertical wind velocity time-history curves of nodes 1 and 2
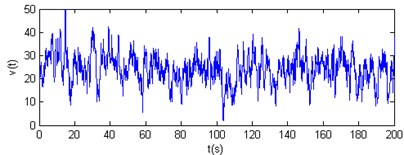
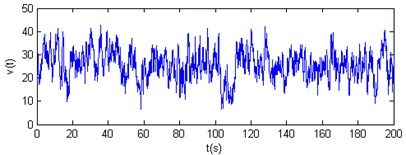
Fig. 12Vertical wind velocity time-history curves of nodes 3 and 4
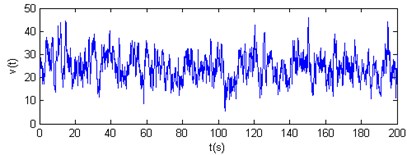
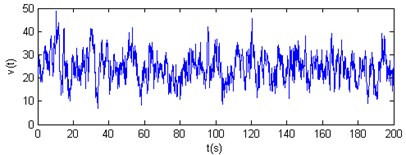
Fig. 13Contrast of vertical velocity power spectrum and Pannofy spectrum
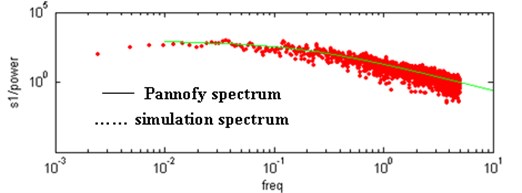
The results show that the horizontal and vertical velocity simulation spectrums are engaged in the Davenport spectrum and Pannofy spectrum. So these wind velocity time-history curves will be used to analyse the wind-induced response of the cable dome.
8. Wind-induced response analysis
8.1. The method of wind-induced response analysis
The fluctuating wind load can be written as:
where is wind load, is the ground category height factor (using 1.48 in this paper), is the structure size factor (simulated by CFD method, see Fig. 15), is mass density of the air (1.25 kg/m3 in this paper). This load can be obtained based on the fluctuating wind velocity time-history curves.
The nonlinear dynamic equation can be written as:
where , , are the mass, damping and stiffness matrixes, is the residual load. Solving Eqn. (7) by Newmark method, the wind-induced response analysis will be achieved.
8.2. Wind-induced response of the cable dome
The wind-induced response analysis model adopts the structure in Fig. 2b. In this paper the wind load acts along 0° direction and the horizontal structure size factor is simulated by CFD method (see Fig. 15). The wind-induced response shows the displacement of the intersection points of ridge cable and strut (see Fig. 7) and the points of membrane (see Fig. 14). Figs. 16-19 show the and direction displacements of 1–4 nodes when the initial stress of the membrane is 4 kN/m. Figs. 20, 21 show the direction displacement of 9–11 nodes when the initial stress of the membrane is 4 kN/m. Fig. 22 illustrates the displacement peak value contrast of the initial stress of 4 kN/m and 6 kN/m. Fig. 23 expresses the first principal stress of membrane in wind compression and suction area with initial stress 4 kN/m. Fig. 24 expresses the first principal stress of membrane in wind compression and suction area with initial stress 6 kN/m. Table 3 illustrates the variation of the internal force.
Fig. 14Node distribution of the membrane
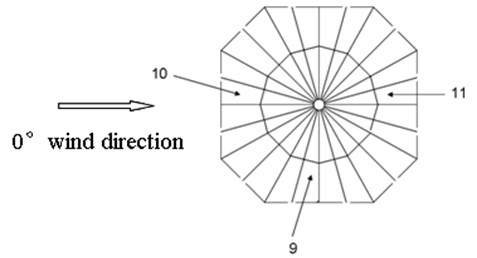
Fig. 15Horizontal shape factor of wind load
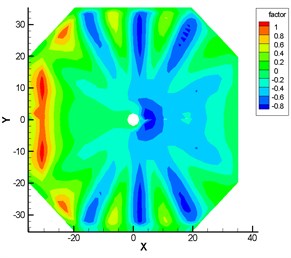
These results show that: (1) The displacement peak values of the intersection nodes of the struts and cables are bigger than the displacements and the maximum value arrives at 0.4 m. (2) The displacements of the membrane nodes 9–11 vary visibly. The peak value of wind compression area reaches –1 m and the peak value of wind suction area arrives at 0.8 m. The displacement peak values of the membrane nodes are 2.5 times bigger than the intersection nodes of the struts and cables. (3) Fig. 22 indicates that when the initial stress of the membrane is 6 kN/m, the displacement peak value descents 0.2 m, so increasing the initial stress of the membrane can prove the antivibration capacity of the structure. (4) The vibration fades gradually after 120 s, so the structure has good dynamic stability when the wind velocity is 25 m/s.
Fig. 16x-direction displacement history curves of nodes 1 and 2
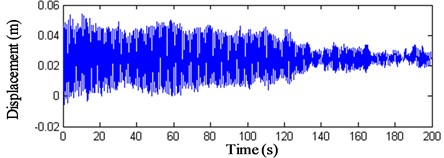
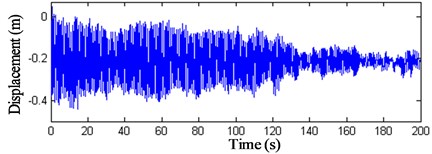
Fig. 17x-direction displacement history curves of nodes 3 and 4
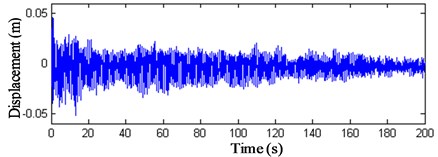
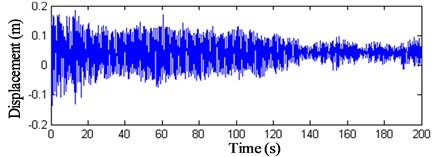
Fig. 18z-direction displacement history curves of nodes 1 and 2
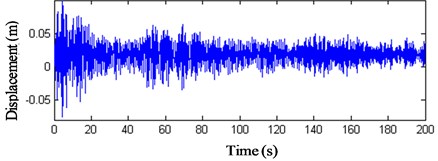
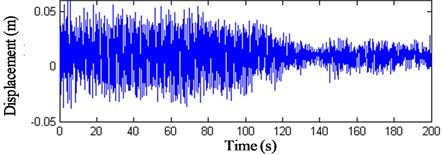
Fig. 19z-direction displacement history curves of nodes 3 and 4
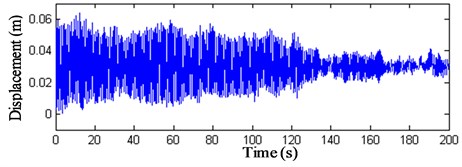
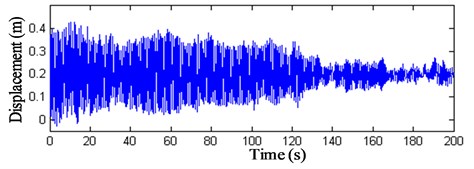
Fig. 20z-direction displacement history curves of nodes 9 and 10
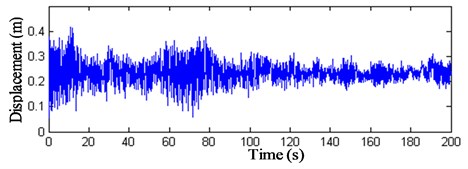
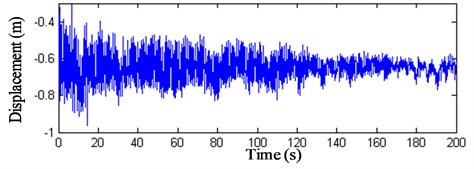
Fig. 21z-direction displacement history curve of node 11
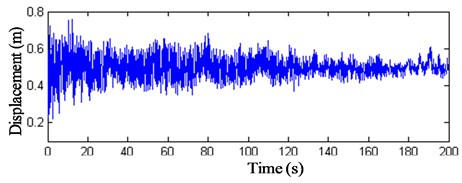
Fig. 22Contrast of the displacement peak values
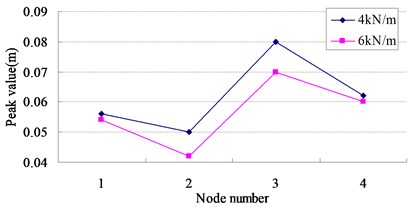
(a) direction
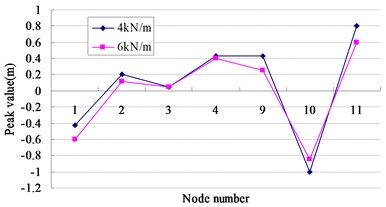
(b) direction
Table 3Variation of the internal force (kN)
Internal force | Inner ridge cable | Outer ridge cable | Inner diagonal cable | Outer diagonal cable | Hoop cable | Strut | Valley cable |
4 kN/m | 529~620 | 793~915 | 216~370 | 255~361 | 434~628 | –174~–113 | 232~385 |
6 kN/m | 514~590 | 766~894 | 219~378 | 277~355 | 483~622 | –142~–108 | 320~394 |
Fig. 23The first principal stress of membrane in wind compression and suction area (initial stress 4 kN/m)
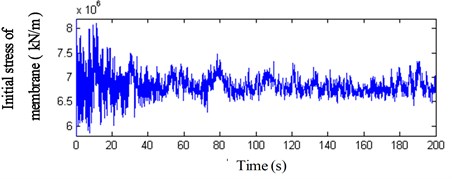
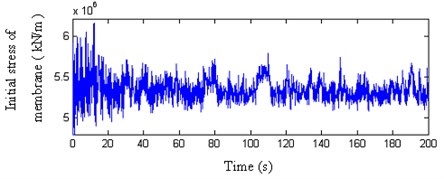
Fig. 24The first principal stress of membrane in wind compression and suction area (initial stress 6 kN/m)
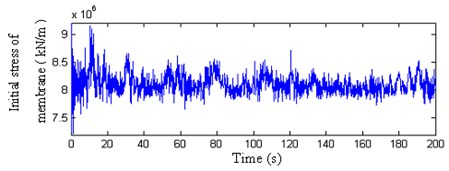
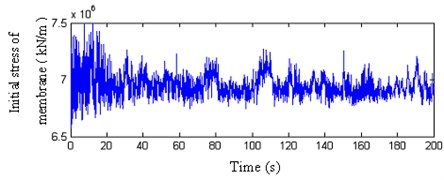
These results indicate that: (1) The variation of the membrane stress arrives at 4 kN/m and is 1.5–2 times bigger than the initial stress when loading fluctuating wind load, so the fluctuating wind load is the controlling load of the membrane. (2) The peak value variances of membrane stress between wind compression area and the wind suction area denote that the wind-induced response has complicated spatial characters. (3) The internal force variations of cable and strut are very small, so the internal forces of components are controlled by initial pre-stress.
9. Conclusions
(1) The natural frequencies of the cable-strut-beam model and the cable-strut-beam-membrane model of the cable dome are low and closer, so the structure is flexible. The first twenty vibration modes of the cable-strut-beam model are all torsion, while the vertical vibration modes appear from the twenty-first vibration mode. This phenomenon indicates that the torsional stiffness of the cable-strut-beam structure is small.
(2) Adding the membrane, the first vibration modes of the cable-strut-beam-membrane model show torsion and vertical vibration simultaneously. So the membrane can reinforce the torsional capacity of the cable-strut intersection. At the same time the integral stiffness augments gradually with the initial stress increasing in the membrane. So the membrane is the necessary component to the design of the cable dome.
(3) In this paper the 200 s wind velocity time-history curves of the cable dome can be simulated by AR method. Using these curves the wind-induced response analysis of the cable dome is calculated by Newmark method.
(4) The vertical displacement peak value is bigger than the horizontal displacement peak value with the fluctuating wind load. And different points have different displacement peak values, so the cable dome has complicated spatial characters. With the initial stress increasing in the membrane, the fluctuation of the node displacement peak value gradually reduces, so the structure has strong geometric nonlinearity. In summary the cable dome is sensitive to the wind load and it is very important to analyse the wind-induced response of the cable dome.
References
-
Zhang Xiang-Ting Calculation of the Wind Compression and Wind Vibration. Tongji University Press, Shanghai, 1985.
-
Shen Shi-Zhao Structural Analysis of Suspended Cable. China Architecture & Building Press, Beijing, 2006.
-
L. Grutndig, J. Bahndorf The design of wide-span roof structures using micro-computers. Computers & Structures, Vol. 30, Issue 3, 1988, p. 495-501.
-
M. Gluck, M. Breuer, F. Durst Computation of wind-induced vibrations of flexible shells and membranous structures. Journal of Fluids and Structures, Vol. 17, Issue 1, 2003, p. 739-765.
-
Zhang Li-Xin Key Problems on Erection Process and Wind Induced Vibration of Cable Domes. Ph. D. Dissertation, Tongji University, 2001.
-
Hu Ning Cooperative Analysis Theory and Wind-Induced Vibration of Cable-Strut-Membrane Space Structures. Ph. D. Dissertation, Zhangjiang University, 2003.
-
Wu Yao Wind-Induced Vibration Analysis for Tension Structures with Consideration of Dynamic Fluid-Structure. Ph. D. Dissertation, Harbin Institute of Technology, 2003.
-
R. H. Barnard Predicting dynamic wind loading on cantilevered canopy roof structures. Journal of Wind Engineering and Industrial Aerodynamics, Vol. 85, Issue 1, 2000, p. 47-57.
-
He Yan-Li, Chen Wu-Jun The dynamic stability analysis of guyed masts under random wind loads. An International Journal of Wind & Structures, Vol. 6, Issue 2, 2003, p. 151-164.
-
Li Yuan-Qi, Dong Shi-Lin The characteristics of wind load and wind-induced vibration of roofing membrane structures by wind tunnel experiments. Spatial Structures, Vol. 7, Issue 3, 2001, p. 3-11.
-
Yasushi Uematsu, Motohiko Yamada, Akira Inoue Wind loads and wind-induced dynamic behavior of a single-layer latticed dome. Journal of Wind Engineering and Industrial Aerodynamics, Vol. 66, Issue 1, 1997, p. 227-248.
About this article

This work appreciates very much the Natural Science Foundation of China (NSFC) (No. 51278299 and No. 50878128) and Doctor Chen Wujun from SSRC of Shanghai Jiaotong University. At the same time, this research also thanks Start-up Capital of Hebei University of Technology Ph. D. (No. QD200940).
