Abstract
The Baltic region is characterised by a low seismic activity. The recent Kaliningrad earthquake of magnitude 5.0 in 2004 persuades that the previous estimates of the seismic hazard of the Baltic region were underrated. It urges the re-assessment of characteristics of the maximum possible earthquake that may take place elsewhere in the Baltic region. The Kaliningrad earthquake scenario was modelled for Vilnius city area. It is motivated by occurrence of several moderate historical earthquakes that took place close to the city, also the presence of some large-scale fault zones in proximity to the city. The maximum probable earthquake of magnitude 5.0 and hypocentral depth of 15 km was modelled to take place in Vilnius city area. The modelled seismic response spectra are dominated by low frequencies 2-5 Hz that is accounted to soft soil effect. The peak ground acceleration (PGA) was modelled to range from 1.05 m/s2 to 1.40 m/s2 depending on soil type, i.e. moraine dominated and sand/technosoil dominated, and on stress-strain relationship (linear vs. non-linear soil behaviour). Estimated PGA corresponds to macroseismic intensity 7 (MSK-64) implying only minor building damages. The modelled seismic signal implies that 2-10 store buildings are subject to the highest (though modest) seismic risk.
1. Introduction
Lithuania is situated in the western part of the East European Platform characterised by low seismic activity. However, several dozens of strong earthquakes of intensity up to 6-7 (MSK-64) were reported from the Baltic region and neighbouring Belarus that implies high probability of occurrence of moderate destructive earthquakes in the future. The instrumentally registered strongest earthquakes are Osmussaare (1976) and Kaliningrad (2004) earthquakes of magnitudes, respectively, 4.75 and 5.0. Both earthquakes took place within the same geological feature, i.e. the Baltic sedimentary basin.
Vilnius city is situated on the eastern flank of the Baltic sedimentary basin. The basin flank is dissected by only scarce fault network compared to more tectonised west Lithuania, Latvia, and Kaliningrad District. Yet, two earthquakes (Gudogai and Bystrica) of magnitudes, respectively, 4.6 and 4.0 took place just 30 km to the east of Vilnius city in 1908 [1] (Fig. 1). There are also some evidences of contemporaneous earthquake in Bezdonys area. These seismic events are not related to any well defined fault. It persuades that earthquakes can take place elsewhere in the Baltic region and prognosis of location of future seismic events is still an unresolved problem.
Until recently, the magnitude of the largest probable earthquake in the Baltic region was considered less than 4.6 [2]. The Kaliningrad earthquake of magnitude 5.0 [3-5] indicates that this prognosis underestimated the seismic potential of the region. The earthquake resulted in some damages in the Kaliningrad district, also in neighbouring Lithuania and north Poland; some damages were reported from Latvia. Its effect was felt to as far away as Saint-Petersburg.
Fig. 1Major faults defined in the sedimentary cover of the Baltic sedimentary basin and documented earthquake epicentres (according to [1] with some modifications)
![Major faults defined in the sedimentary cover of the Baltic sedimentary basin and documented earthquake epicentres (according to [1] with some modifications)](https://static-01.extrica.com/articles/14418/14418-img1.jpg)
The present paper considers the seismic ground shaking characteristics in case of hypothetical earthquake in Vilnius area assuming similar seismic potential as that in Kaliningrad district in order to make prognosis of its consequences.
2. Method and data
The hypothetical earthquake of magnitude 5.0, as that as in Kaliningrad district in 2004, was assumed to take place in Vilnius area (or close to the city). The ground motion was modelled for two different soil types. Such scenario is motivated by occurrence of moderate historical earthquakes (Gudogai, Bystrica, Bezdonys) at the distance of several dozens of kilometres away from Vilnius city. Furthermore, several large-scale fault zones are defined in proximity to the city, e.g. west-east trending Vilkaviškis-Birštonas-Vilnius fault zone [6] that can be considered as the eastern continuation of the Kaliningrad fault zone which induced the Kaliningrad earthquake in 2004 [4].
Different parameters contribute to the seismic signal characteristics. The seismic properties of a soil are important for the site-specific seismic hazard assessment [7-11]. Numerous studies have shown that, for the same earthquake, ground motion at sites composed of soft materials is greater than at sites composed of stiff materials. There are two physical mechanisms responsible for amplification of ground motion at soft sites. The dominant mechanism is conservation of energy. Because the wave propagation velocity decreases toward the surface of a soft site the wave amplitude must increase to conserve energy. The second mechanism is related to resonance of interfering up- and down-going waves in the top soil layer.
Abundant data have been collected on the geomechanical soil properties in the Vilnius area [12]. The seismic characterization of the soil is, however, missing. Yet, consistent studies of soil seismic properties have been carried out in Ignalina NPP area [13] that is characterized by similar geological conditions. Both areas are situated in the eastern periphery of the Baltic sedimentary basin within the same Baltic High belt composed of marginal moraine and ice melt-water deposits [14, 15]. Alluvial sediments compose a significant part of Vilnius city. The shear-wave (s-wave) velocities were measured during the seismic microzoning survey based on seismic profiling in Ignalina NPP area. Also, vertical seismic profiling (VSP) measurements were carried out in 20 wells as deep as 10-20 m. Those studies were carried out in order to evaluate the seismic risk of the nuclear plant [16].
No data on seismic properties of deeper sediments are available in Vilnius area either. Yet, measurements of seismic velocities of sediments of the whole sedimentary cover were performed in several deep wells down to the crystalline basement in Ignalina NPP area [17]. VSP method was employed to measure p-wave velocities that were converted to s-wave velocities. The geological section of the sedimentary cover is very close to that of Vilnius area, except for some smaller sedimentary cover thickness in the latter area (~720 m thick in Ignalina NPP, while ~500 m thick in Vilnius). Seismic properties of geological layers of the same age were assumed to be adequate in both areas.
The maximum probable earthquake of magnitude 5.0 and hypocentral depth of 15 km was modelled in the present study, similarly to that of Kaliningrad earthquake of 2004. The modelling approach is based on the fact that seismic signal passing through different geological layers experiences significant transformations. Therefore it is essential to assess those modifications for a site-specific geological section. The seismic wave propagating from the crystalline basement through the sedimentary cover to the surface was calculated in three steps.
Step 1. The free field ground response spectrum was calculated at the top of the crystalline basement affected by the earthquake of magnitude 5.0 and hypocentral depth 15 km. The site affected by the earthquake was assumed to be located at the distance of 1 km from the epicentre. It should be noted that there are only miserable changes in the seismic signal within the epicentral distance of 1-10 km. The effect of overburden by overlying sediments to the seismic response at the top of the basement was not taken into consideration in Step 1.
Step 2. The synthetic seismic wave accelerogram (seismic signal) corresponding to the calculated basement seismic ground response spectrum was modelled using EERA2000 programme [18]. The free-field seismic signal was modified to overburden conditions.
Step 3. When propagating through the overlying sediments, the seismic wave transforms, essentially in the uppermost part of the section. The wave transformation was modelled using EERA2000 [18] and NERA [19] programmes that apply, respectively, linear and non-linear soil behaviour relationships. Two types of the soil (soft soil and soil) were evaluated. Seismic response spectra were calculated for free-field conditions (e.g. at the surface) and the depth of 5 m.
3. Results
3.1. Seismic properties of the geological section
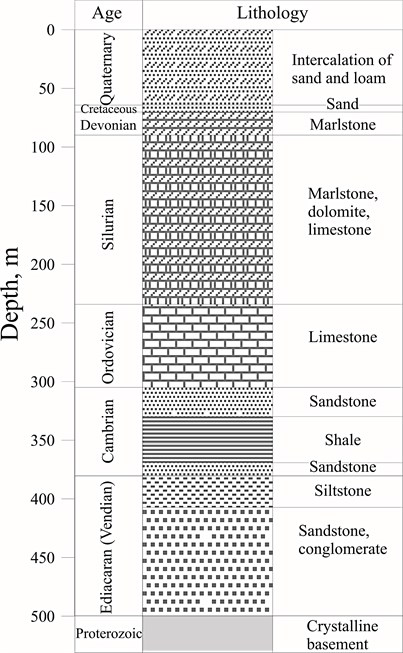
There are several deep wells reaching (or nearly reaching) the crystalline basement in Vilnius area (wells Vilnius-1, Jačionys-299, A. Paneriai, Šiaudinė-707) that provide quite good knowledge on the geological section of the whole sedimentary cover and underlying basement rocks. The sedimentary cover is of about 500 m thick here. It is composed by (from top to bottom) Quaternary, Lower Cretaceous, Middle Devonian, Lower Silurian, Ordovician, Lower Cambrian, and Ediacarian (Vendian) sediments of different composition (Fig. 2). The Quaternary section is composed of alternating sandy and clayey lithologies. Carbonaceous lithologies (marlstone, limestone, and dolomite) predominate in the upper part of the Pre-Quaternary section, while terrigenous sediments (shale, sandstone, conglomerate) compose the lower part of the Pre-Quaternary sedimentary cover. The basement is represented by highly metamorphosed crystalline rocks, mainly granulites.
Vilnius city is characterised by dissected landscape composed of marginal moraine with overlying and intercalating sandy/clayey deposits. Due to intense urbanisation a large part of the city soil is composed of the technosoil [20].
Fig. 2Composite geological section of Vilnius area
The impact of two marginal types of the soil, i.e. technosoil/sandy soil and moraine (sandy and clayey loam), were modelled to evaluate the seismic ground motion. According to measurements of Ignalina NPP area sandy soil and technosoil are characterised by lower s-wave velocities compared to undisturbed moraine clayey lithologies that inevitably influence the seismic reaction of the ground. The model parameters of the two soil types are presented in Table 1. The soil of Vilnius city is characterised by highly variable composition owing to complex nature of Quaternary sedimentation and urbanisation that also results in variations of seismic properties. For the first approach the two end-member conditions were assumed in the present study.
Table 1Assumed s-wave velocities of soil (interval 0-20 m) of two different types, Vilnius area
Interval | Soil type | |||
Technosoil/sand | Moraine (sandy and clayey loam) | |||
S-wave velocity, m/s | Density, kg/m3 | S-wave velocity, m/s | Density, kg/m3 | |
0.0–5.0 | 150 | 1750 | 230 | 1900 |
5.0–10.0 | 200 | 1800 | 270 | 2000 |
10.0–15.0 | 260 | 2000 | 310 | 2050 |
15.0–20.0 | 300 | 2050 | 380 | 2010 |
According to seismic velocity measurements of Ignalina NPP area [13] s-wave velocities generally increase with depth. In the model, s-wave velocities of top interval of 20 m thick range from 150 m/s to 300 m/s for technosoil/sandy soil and from 230 m/s to 380 m/s for moraine soil. Also, the rock densities were measured in shallow and deep wells of Ignalina NPP area and were used in the present study (Table 1).
The s-wave velocities increase with depth owing mainly to rock compaction. The lowest values are measured in the Quaternary section, while they are considerably higher in the Pre-Quaternary succession (Table 2). There are significant variations in velocities against the general depth-related trend that are accounted to lithological variations. The highest velocities in excess of 2000 m/s are measured in Ordovician carbonaceous (limestones and dolomites) layer, while most of the Pre-Quaternary layers have velocities within the range of 1500-2000 m/s. Seismic s-wave velocities dramatically increase to more than 3000 m/s in the crystalline basement underlying the sedimentary cover.
Table 2Assumed s-wave velocities of different geological layers of sedimentary cover and crystalline basement, Vilnius area
Age | Dominating lithologies | Depth, m | S-wave velocity, m/s | Density, kg/m3 |
Q | Sand, moraine | 20–65 | 450 | 2200 |
K1 | Sand | 65–70 | 700 | 2200 |
D2nr | Marlstone | 70–90 | 1389 | 2350 |
S1 | Marlstone | 90–234 | 1579 | 2400 |
O | Limestone | 234–305 | 1842 | 2450 |
Cm2ts | Sandstone | 305–330 | 1852 | 2450 |
Cm1ln | Shale | 330–353 | 1122 | 2200 |
Cm1lm | Sandstone | 353–380 | 2198 | 2450 |
V2 | Siltstone | 380–407 | 1650 | 2400 |
V2 | Sandstone | 407–500 | 1792 | 2400 |
PR1 | Cryst. rocks | > 500 | 3200 | 2800 |
3.2. Free-field ground response spectrum
As described above, in the Step 1 the ground response spectrum was calculated for the crystalline basement using seismic attenuation equation developed by [21]:
here is taken as a closest distance to the surface projection of the fault (1 km), is the earthquake magnitude ( 5.0), are frequency related regression coefficients as presented in [21] (see Appendix 1).
This seismic attenuation function was derived based on abundant seismic instrumental registrations of shallow earthquakes of moderate magnitude from the exposed hard rock regions of USA characterised by similar to Lithuania geological setting.
The spectrum calculated for the earthquake of magnitude 5.0 is presented in Fig. 3. The peak ground acceleration (PGA) is calculated 0.43 m/s2 (for outcrop conditions). The maximum spectral acceleration values were obtained for frequency domain 10-50 Hz with a peak at 30-40 Hz. Predominance of high frequencies is typical for hard rock type ground [22]. The in-situ PGA value is lower (0.33 m/s2) due to overburden.
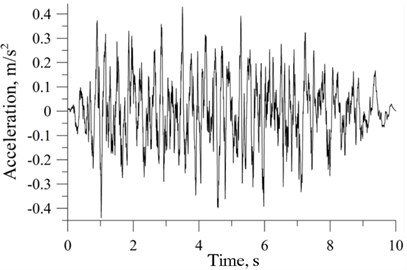
Based on the calculated free-field ground response spectrum the synthetic accelerogram was modelled for the basement rocks as the initial seismic signal (Step 2). The seismic events are of different duration that primarily depends on the magnitude of the earthquake [23]. The enveloping function of the synthetic accelerogram was applied as that recommended by ASCE 4-98 [24], i.e. duration of the ground shaking 10 s with 1 s of rise phase and 3 s of decay phase for an earthquake of magnitude 5.0 [24]. The damping value was assumed 5 %. The modelled time history is presented in Fig. 4.
The seismic wave when passing through the overlying sediments transforms, essentially in the uppermost part of the section that accounts mainly to drastic deceleration of s-wave velocities (Fig. 5), which leads to amplification of a wave acceleration (amplitude, velocity) due to energy conservation. This transformation was evaluated in Step 3. The transformation of s-waves passing through the sedimentary cover was alternatively calculated using (1) programme EERA2000 (Equivalent Linear Earthquake Response Analysis) that implements the concepts of equivalent linear earthquake site response analysis and (2) NERA non-linear site response analysis program that is based on non-linear stress-strain relationships developed by [25, 26]. Seismic observations show that the linear models are in better agreement to registered weak seismic motions, while strong motions (acceleration > 1.5 m/s2) are more accurately modelled assuming non-linear soil behaviour [27]. The hypothetical Vilnius earthquake is classified as a moderate seismic event; therefore both models should be taken into consideration.
Fig. 3Free-field ground response spectra calculated for hard-rock basement, earthquake M= 5.0, hypocentral depth 15 km
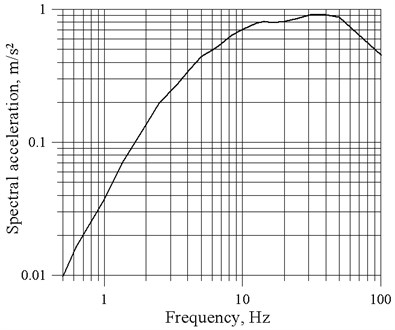
Fig. 4Synthetic accelerogram modelled for hard-rock basement, earthquake M= 5.0, hypocentral depth 15 m
The wave transformation depends on the seismic properties of the geological layers. Apart of seismic wave velocities, the shear modulus is one of the basic parameters [28]. This parameter was modelled using EERA2000 programme (Fig. 6).
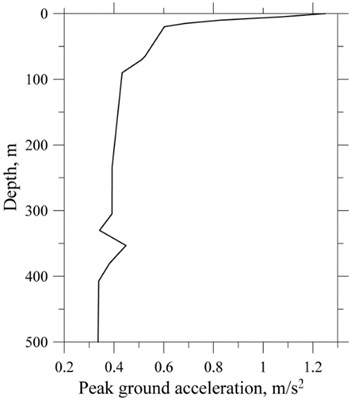
The peak ground acceleration (PGA) only little changes across the depth interval of Palaeozoic and Ediacarian (Vendian) rocks (Fig. 5). The most considerable increase in PGA values occurs in the Quaternary succession, essentially in its uppermost part.
Four free-field ground response spectra were derived from the initial seismic signal passing from the crystalline basement to the surface of two different soil types (Fig. 7). The linear and non-linear models were applied for comparative analysis. The modelled surface spectra (Fig. 7) are considerably different from the basement spectrum (Fig. 2). Assuming linear soil behaviour PGA increases to 1.25 m/s2 (maximum relative velocity 0.08 m/s, maximum relative displacement 0.009 m, maximum stress 5.2 kPa) and 1.40 m/s2 for moraine and sandy soils, respectively. The non-linear modelling shows somewhat lower PGA values 1.02 m/s2 for moraine soil and 1.21 m/s2 for sandy soil.
Fig. 5Profiles of maximum shear modulus and s-wave velocities of sedimentary cover, moraine soil, Vilnius area
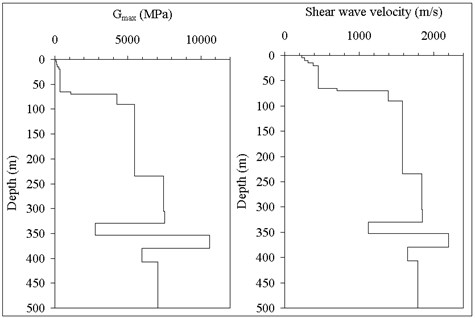
Fig. 6PGA depth profile of the sedimentary cover (moraine soil type of uppermost part of the section), Vilnius area
The shape of surface spectra is considerably different from the basement spectrum, showing shifting of maximum spectral acceleration values from high frequencies (peak 40 Hz) to low frequencies (Fig. 7). In the linear model the maximum spectral acceleration values are identified in the frequency domain 1-2 Hz with a peak value at 1.1-1.2 Hz. The non-linear modelling obtains maximum spectral acceleration values at frequencies 2-5 Hz with a peak value at 3-4 Hz. Shifting from high-frequency dominated to low-frequency dominated ground shaking is characteristic for transition from hard-rock to soft-soil [29].
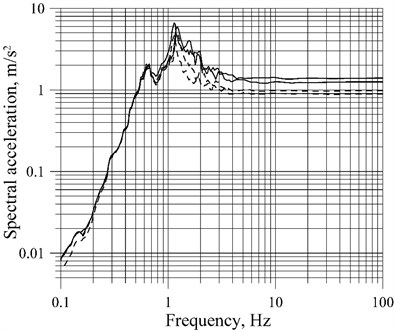
The acceleration (velocity, amplitude) decreases with depth owing to overburden and increasing s-wave velocities. Therefore the foundation embedment depth is an important parameter in seismic risk analysis. A comparison of free-field ground response spectra and response spectra at the depth of 5 m is presented in Fig. 8. PGA values for the depth of 5 m were calculated as low as 0.89 m/s2 and 0.98 m/s2 for, respectively, moraine and sandy soils (linear models), which are much lower than acceleration for free field conditions. No discernable changes are recognised in the shape of response spectra.
Fig. 7Free field ground response spectra modelled for moraine and sandy soils. Bold lines correspond to linear soil behaviour models, dashed lines correspond to non-linear models
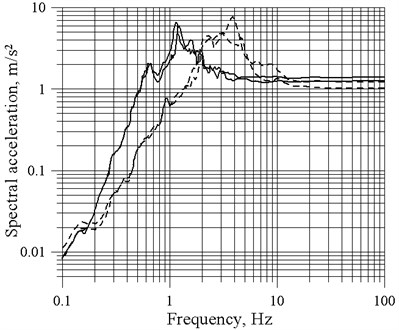
Fig. 8Free field ground response spectra compared to spectra inside the layer at the depth of 5 m (linear soil behaviour model). Bold lines are the same as in Fig. 7, dashed lines show spectra calculated at depth 5 m (sand/technosoil and moraine soils, linear soil behaviour models)
3.3. Discussion
The most important (for buildings reaction) parameters of earthquake ground motions are shaking duration, acceleration (amplitude of displacement and velocity) and frequency of the ground motion.
Modelling of the seismic ground motion of the most probable maximum earthquake of Vilnius area compatible to Kaliningrad earthquake in 2004 infers PGA values as high as 1.25-1.4 m/s2 (non-linear model 1.02-1.21 m/s2). These values correspond to macroseismic intensity 7 (MSK-64) [30, 31], e.g. minor damages of buildings can be expected. This intensity estimate is in concert to epicentral intensity 6.5-7 defined by macroseismic observations of the Kaliningrad earthquake [32]. The modelled free-field ground response spectrum is dominated by low frequencies in the range of 1-2 Hz for linear soil behaviour, while 2-5 Hz for non-linear stress-strain relationship. Predominance of low frequencies is primarily related to low seismic velocities of soil lithologies. The half-kilometre thick sedimentary cover of type A (rock, Eurocode 8 [33]) only little affects the seismic signal passing upwards from the basements, PGA values are in the range of 0.34-0.45 m/s2 (overburden conditions). The main seismic wave modification takes place in the uppermost part of the Quaternary succession classified as soil of type B and C (soil and soft soil, Eurocode 8).
In terms of the seismic risk there is a correlation between the seismic frequencies and building height via the shaking resonance. Different buildings may respond in a different way to the same earthquake ground motion depending on its characteristics. Taller buildings have longer natural periods compared to low buildings (Table 3), also the building construction is of importance [34-36].
Table 3Building heights and typical natural frequencies
Building height | Typical natural frequency, Hz |
2 story | 5 |
5 story | 2 |
10 story | 1 |
20 story | 0.5 |
30 story | 0.3 |
50 story | 0.2 |
Vilnius free-field seismic ground response spectra are dominated by low frequencies in the range of 1-5 Hz. It implies that local earthquake will most strongly affect 2-10 store buildings.
4. Conclusions
Kaliningrad earthquake of magnitude 5.0 registered in 2004 persuades that previous estimates of the seismic hazard of the Baltic region were underrated. The earthquake led to some building damages, destruction of railway track-beds, and other damages (e.g. surface collapse in cemeteries). It urges re-assessment of the seismic risk caused by such seismic events that may take place elsewhere in the Baltic region. The Kaliningrad earthquake scenario was modelled for the Vilnius city. It is motivated by occurrence of several moderate historical earthquakes that took place close to the city, also by presence of some large-scale fault zones in proximity to the city.
The hypothetical earthquake of magnitude 5.0 and hypocentral depth of 15 km was modelled. The seismic motion characteristics were first defined at the top of the crystalline basement. The seismic response spectrum of the basement is dominated by high frequencies owing to high s-wave velocities of basement rocks, shallow hypocentral depth and minor earthquake magnitude. The transformation of the seismic wave propagating through the sedimentary pile of 500 m thick was evaluated. The decrease in seismic velocities that is essentially drastic in the uppermost part of the geological section of the sedimentary cover results in considerable amplification of the acceleration (energy conservation effect) and shifting of maximum spectral acceleration values from low- (40 Hz) to high-frequency domain (1-5 Hz). The peak ground acceleration (PGA) ranges from 1.25 m/s2 to 1.40 m/s2 depending on soil type, i.e. sand/technosoil dominated and moraine dominated. The non-linear models show somewhat lower PGA values (1.02 m/s2 and 1.21 m/s2). Those values correspond to the macroseismic intensity 7 implying only minor damages of buildings, unless the liquefaction of soil takes place under specific conditions.
The modelled ground response spectra suggest that 2-10 store buildings would be subject to the highest seismic risk. The establishment of the correlation between the geomechanical and seismic properties for Lithuanian soils is in progress [37] that will allow more precise site-specific seismic risk assessment of Vilnius area based on the approach provided in the present study.
References
-
Šliaupa S., Pačėsa A. Seismic activity and seismic catalogue of the East Baltic region. Geologija, Vol. 75, 2011, p. 134-146.
-
Aizberg R., Garetsky R., Aronov A., Karabanov A., Safronov O. Seismotectonics of Belarus and the Baltic region. Technika Roszukiwań Geologisznych, Geosynoptika i Getermia, Vol. 38, 1999, p. 28-37.
-
Aronov A. G., Seroglazov R. R., Aronova T. I. Kaliningrad earthquake of September 21, 2004 and seismic hazard forecast in the Belorussian–Baltic Region. Science and Technology for Safe Development of Lifeline Systems, October 24-25, 2005, Bratislava, Slovak Republic, p. 1-7.
-
Pačėsa A., Šliaupa S., Satkūnas J. New earthquakes in the Baltic region and seismic monitoring of Lithuania. Geologija, Vol. 51, 2005, p. 8-18.
-
Gregersen S., Wiejacz P., Debski W., Domanski B., Assinovskaya B., Gutterch B., Mantiniemi P., Nikulin V., Pačėsa A., Puura V., Aronov A. G., Aronova T. I., Grunthal G., Husebye E. S., Šliaupa S. The exceptional earthquakes in Kaliningrad district, Russia on September 21. Physics of the Earth and Planetatry Interiors, Vol. 164, 2008, p. 63-74.
-
Šliaupa A. Tectonics of South Lithuania. Synopsis of Ph. D. Thesis, Institute of Geology, Vilnius, 1997, 35 p., (in Russian).
-
Lu L., Yamazaki F., Katayama T. Soil amplification based on seismometer array and microtremor observations in Chiba, Japan. Earthq. Engng. Struct. Dyn., Vol. 21, 1992, p. 95-108.
-
Şafak E. Discrete-time analysis of seismic site amplification. Journal of Engineering Mechanics, ASCE, Vol. 121, No. 7, 1995, p. 801-809.
-
Elgamal A.-W., Zeghal M., Parra E., Gunturi R., Tang H. T., Stepp J. C. Identification and modelling of earthquake ground response – I. Site amplification. Soil Dynamics and Earthquake Engineering, Vol. 22, No. 4, 1996, p. 499-522.
-
Bauer R. A., Kiefer J., Hester N. Soil amplification maps for estimating earthquake ground motions in the Central US. Engineering Geology, Vol. 62, 2001, p. 7-17.
-
Zembaty Z., Rutenberg A. Spatial response spectra and site amplification effects. Engineering Structures, Vol. 24, 2002, p. 1485-1496.
-
Dundulis K., Kaczyński R. R., Krauźlis K. S., Žaržojus G. Engineering geological properties of Vilnius and Warsaw region tills as building subsoils. Geologija, Vol. 50, 2008, p. 11-15.
-
Instrumental Seismic Microzoning of Ignalina NPP Site. NPO Stroyizyskania, Project 568, 1981, Moscow, (in Russian).
-
Guobytė R. Quaternary geological map of Lithuania. Geologijos akiračiai, Vol. 1, 1999, p. 7-16, (in Lithuanian with English summary).
-
Guobytė R. New geomorphological map of Lithuania, scale 1:200 000. Geological Survey of Lithuania, Report of Activities in 2000, 2001, Vilnius, p. 21-23.
-
Šliaupa S., Kačianauskas R., Markauskas D., Dundulis G., Ušpuras E. Design basis earthquake of the Ignalina Nuclear Power Plant. Geologija, Vol. 54, 2006, p. 19-30.
-
Marcinkevičius V. Report on conducted complex geological – hydrogeological and engineering – geological photographing of the scale 1:50000 in the region of the Ignalina NPP in the Republic of Lithuania, Republic of Latvia and Republic of Byelorussia. Geological Survey of Lithuania, Vilnius, 22 books, 1995, 3923 p., (in Russian).
-
Bardet J. P., Ichii K., Lin C. H. EERA A Computer Program for Equivalent-Linear Earthquake Site Response Analyses of Layered Soil Deposits. University of Southern California, Department of Civil Engineering, August 2000.
-
Bardet J. P., Tobita T. NERA A Computer Program for Nonlinear Earthquake site Response Analyses of Layered Soil Deposits. University of Southern California, Department of Civil Engineering, April 2001.
-
Satkūnas J., Gregorauskienė V., Kanopienė R., Mikulėnas V., Minkevičius V., Šačkus V., Šlauteris A. Man-made formations and geopollution: state of knowledge in Lithuania. Geologija, Vol. 53, 2011, p. 36-44.
-
Silva W., Gregor N., Darragh R. Development of Regional Hard Rock Attenuation Relations for Central and Eastern North America, Mid-Continent and Gulf Coast Areas. Report, August 13, 2003, http://www.pacificengineering.org/rpts_page1.shtml.
-
Seismic Design Criteria Version 1.4. California Department of Transportation, Sacramento, CA., 2006.
-
Hernandez B., Cotton F. Empirical determination of the ground shaking duration due to an earthquake using strong motion accelerograms for engineering applications. 12th World Conference on Earthquake Engineering, Auckland, New Zealand, 30 January – 4 February 2000, Book of Abstracts, New Zealand Society for Earthquake Engineering.
-
Seismic Analysis of Safety-Related Nuclear Structures and Commentary. ASCE4-98, Reston, VA, USA, 1999.
-
Iwan W. D. On a class of models for the yielding behavior of continuous and composite systems. Journal of Applied Mechanics, ASME, Vol. 34, 1967, p. 612-617.
-
Mróz Z. On the description of anisotropic workhardening. Journal of Mechanics and Physics of Solids, Vol. 15, 1967, p. 163-175.
-
Huang H. C., Shieh C. S., Chiu H. C. Linear and nonlinear behaviors on a soil site using Lotung downhole array in Taiwan. 12th World Conference on Earthquake Engineering, Auckland, New Zealand, 30 January – 4 February 2000, Book of Abstracts, New Zealand Society for Earthquake Engineering, p. 1705.
-
Hardin B. O., Drnevich V. P. Shear modulus and damping in soils: I. Measurement and parameter effects. Journal of Soil Mechanics and Foundation Division, ASCE, Vol. 98, No. 6, 1972, p. 603-624.
-
Sokolov V., Loh C.-H, Wen K.-L. Site-dependent design input ground motion estimations for the Taipei area: a probabilistic approach. Probabilistic Engineering Mechanics, Vol. 16, 2001, p. 177-191.
-
Kostov M. K. Site specific estimation of cumulative absolute velocity. 18th International Conference on Structural Mechanics in Reactor Technology (SMiRT 18), Beijing, China, August 7-12, 2005.
-
Ambraseys N. N. Seismic ground accelerations via intensity. Seismic Hazard Determination in Areas with Moderate Seismicity, Proceedings of the international conference held Oct. 22-23, 1991, at Saint-Rémy-Lès-Chevreuse, France, p. 101-109.
-
Ulomov V., Akatova K. N., Medvedeva N. S. Estimation of seismic hazard in the Kaliningrad region. Izvestiya, Physics of the Solid Earth, Vol. 44, No. 9, 2008, p. 691-705.
-
Eurocode 8. Design of Structures for Earthquake Resistance, 1998.
-
Goel R. K., Chopra A. K. Period formulas for moment-resisting frame buildings. J. Struct. Engrg., Vol. 123, No. 11, 1997, p. 1454-1461.
-
Amanat K. M., Hoque E. A rationale for determining the natural period of RC building frames having infill. Engineering Structures, Vol. 28, No. 4, 2006, p. 495-502.
-
American Society of Civil Engineers (ASCE). Minimum Design Loads for Buildings and Other Structures, 2005, ASCE/SEI 7-05, Reston, VA.
-
Gadeikis S., Dundulis K., Žaržojus G., Gadeikytė S., Urbaitis D., Gribulis D., Šliaupa S. Correlation of shear-wave velocities and cone resistance of quaternary glacial sandy soils defined by Seismic Cone Penetration Test (SCPT). Journal of Vibroengineering, Vol. 14, No. 2, 2012, p. 715-722.
About this article

The study was supported by the Research Council of Lithuania (Project No. MIP 11319). The author is grateful to reviewers for improvement of the paper.
