Abstract
Composite laminates are widely used due to the advantages of low density, high specific modulus and specific strength, strong internal damping and excellent chemical stability. Invisible damage by impact and fatigue such as matrix crack, internal delamination and fiber break may lead to sharp decline of structural strength and stability and finally makes composite structural failure. This paper proposes a damage index weighted average localization algorithm (DIA), which can realize a quick damage identification and damage localization of high accuracy. The proposed algorithm does not require damage imaging, and thus has the potential of realizing Structural Health Monitoring on line and in situ. Pre-experiments of real impact damages and artificial bonded bolt are done on composite laminates of small sizes. At last, to reduce experiment cost, the bolts are bonded on laminates to replace real impact damage for validation of DIA. Damage identification is successfully realized with damage localization error lower than 5 mm. A regular PZT arrangement with fewer sensors verifies that 6 sensors are enough for localization error of 20 mm and a random PZT arrangement with one or two sensors missing from the initial sensor array will not influence the localization accuracy.
1. Introduction
With the advantages of low density, high specific modulus and specific strength, strong internal damping and excellent chemical stability, composites have been widely used in a lot of areas. Due to good heat stability, high specific strength and stiffness, more and more composites are being applied to aircraft in order to reduce the structural weight and improve the structural performance [1]. However, during the manufacturing and application, damage is inevitable, especially those invisible damages by impact and fatigue such as matrix crack, internal delamination and fiber break, which leads to possible sharp decline of structural strength and stability and finally makes structural failure.
With the continuous accumulation of damage, there will be a strong influence on the structural security and useful life. If possible damage is not detected in time, the consequence brought by damage may be disastrous, which makes the Structural Health Monitoring (SHM) necessary [2-5]. Because of the high sensitivity to structural damages and the ability of regional monitoring, stress wave is frequently used in the SHM research to monitor small damages such as fatigue cracks and delaminations [6-8]. Some representative algorithms include damage index (DI) [9-11], time reversal [12, 13], those using Time-of-Flight [14], statistical modeling [15-17] and damage imaging algorithms [18-20]. Among the stress wave based SHM, stress wave based damage monitoring is frequently studied. When structures are intact, piezoelectric sensors (PZTs) surface bonded on or integrated into structures are acted by voltage signals, then other PZTs acquire stress wave response signals as baseline signals. When structures are being monitored, the above process is repeated to obtain the monitored signals. Measuring the differences between monitored signals and baseline signals by damage index, when damage index exceeds a certain threshold, the structure is identified with damage occurring. Since cracks often occur at locations with stress concentration, PZTs can be placed where the actuator-sensor channel passes the location with possible crack occurring, which makes this method often used for crack detection.
In spite of the fact that damage index based method is frequently used for damage identification, it is seldom applied to further damage characteristic recognition. Ihn and Chang monitored the crack initiation and propagation around riveted joints with piezoelectric sensor-actuator network [9, 10]. The crack length corresponds to the value of damage index. Qing applied damage index algorithm to monitor corrosion damage in pipes [11]. Their researches focus on discussion of damage identification and rough damage localization.
In this context, this paper proposes a damage index weighted average localization algorithm (DIA), which can realize a quick damage identification and damage localization of high accuracy. The proposed algorithm does not require damage imaging, and thus has the potential of realizing Structural Health Monitoring on line and in situ.
The main creative points and jobs are as follows.
First DIA is proposed to realize damage identification and localization. Then experiments of real impact damage and artificial bonded bolt on composites of small sizes are performed to study their influence on monitored signals. To reduce experiment cost, artificial bolts M8 and M14 instead of impact damage are used for validation of the proposed algorithm. At last, parameter study is continued for further algorithm optimization.
2. Damage index weighted average localization algorithm
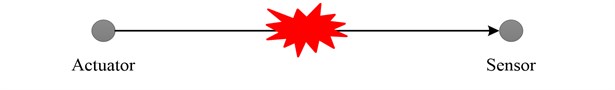
The principle of damage identification if damage occurs on a certain actuator-sensor channel is shown in Fig. 1. When damage occurs on the corresponding actuator-sensor channel, the monitored signals and baseline signals are compared and measured with damage index. A lot of damage indices are proposed for stress wave based SHM, both the simple damage index of scalar such as mean square root and complex damage index of vector such as wavelet analysis. The criteria should be that the chosen damage index is simple, effective, of high reliability, requiring little calculation and not easily influenced by environmental variation [4, 6].
Fig. 1Damage identification by comparison of monitored signal and baseline signal
Gabor wavelet function is chosen in this paper to perform wavelet transform of monitored signals and baselines signals. The local time-energy density characteristics of both signals are extracted and compared, which obtains the damage index (DI) defined as follows:
where is the baseline signals when the structure is intact, is the monitored signals when the structure is under monitoring, is the local time-energy density corresponding to the scale parameter and time parameter is the signal time duration for wavelet analysis.
The proposed SHM algorithm supposes that damage is the main factor leading to the signal differences before and after damage occurs. Thus, if in Eq. (1) is large, damage may occur. The larger is, the larger possibility that damage occurs. However, this method can only realize damage identification in the corresponding actuator-sensor channel and cannot obtain the accurate quantitative location of damage.
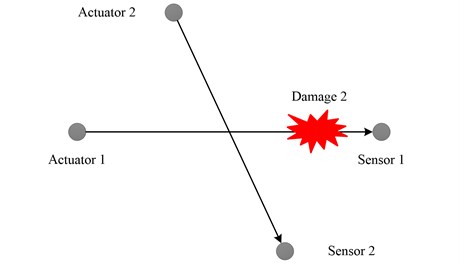
To realize quantitative damage localization, further discussion continues. When damage occurs at the intersection of two channels as shown in Fig. 2, both the two on the two channels will be large. In the similar way, when damage occurs close to one channel but away from the other channel as shown in Fig. 3, on channel 1 is large, but on channel 2 is small. Thus it is concluded that the minor value of the two reflects the distance from damage to the intersection of the two channels. Based on the conclusion, damage index weighted average localization algorithm () is proposed.
Fig. 2Damage occurring at the intersection of two channels
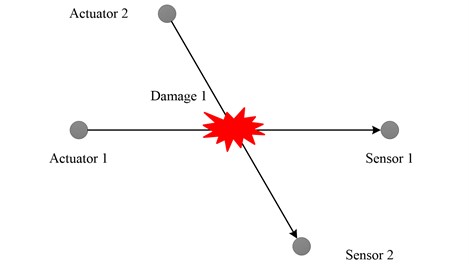
Fig. 3Damage occurring on only one channel
When an area is monitored by PZTs, the total number of actuator-sensor channels is:
The above channels will form many intersections, the weights of which are the minor values on the corresponding two channels. Thus the localization result can be expressed as:
where denotes the final localization coordination result, denotes the intersection coordination of two actuator-sensor channels, is the corresponding weight expressed as:
where and denote the two corresponding to the two actuator-sensor channels and min denotes the minor value of the two .
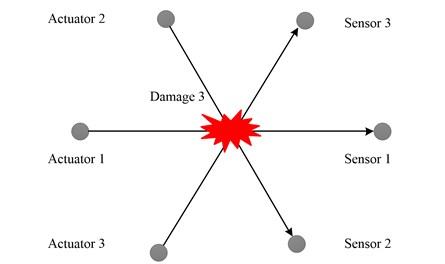
When three actuator-sensor channels intersect at the same point as shown in Fig. 4, there are three intersections at the same location according to Eq. (3). If the three are , and , the corresponding weights are and In this case, even though the three values are small, three calculations for the same intersection will make the damage localization result close to the intersection.
Fig. 4Damage occurring at the intersection of three channels
To avoid the influence on localization error by the above case, the proposed algorithm deserves a further optimization. First, values on all the channels are calculated. Second, the coordination and weight of every intersection is obtained. Third, a weight average process is used so that those repeated intersections will only be calculated once. Fourth, localization is done according to Eq. (3). At the third step, for the th intersection, its weight is calculated as:
where denotes the th weight corresponding to the th intersection.
Damage localization is realized through the above algorithm. Based on the algorithm, damage identification can also be realized. When a structure is monitored by a dense PZT network, the location where damage occurs must be close to one intersection of two actuator-sensor channels. Thus if there exist two channels that intersect with each other and whose minor value exceeds a setting threshold, damage must occur near the intersection point.
Another factor is that the noise by measurement system and environment may make the values on some channels large, which will influence the localization result. Thus a weight coefficient ranging between is introduced, and Eq. (3) can be further denoted as:
where notes the maximum value of all the weights.
3. Pre-experiments
To reduce experiment cost, some pre-experiments are done to testify the influence on stress wave by real impact damage and bonded bolt. Some carbon fiber composite laminate specimens of small sizes are classified into two groups. The first group includes five laminates impacted by energy of 3 J, 5 J, 7 J, 8 J and 10 J, respectively. The impact will produce real delamination damage. The second group includes two laminates bonded with bolts of M8 and M14, respectively. The experiment system is shown in Fig. 5. The NI-PXI measurement system includes PXI-6115 high speed data acquisition card, PXI-5412 arbitrary wave generator and KH-7600 power amplifier from Krohn-Hite.
Fig. 5Experiment system and composite specimen
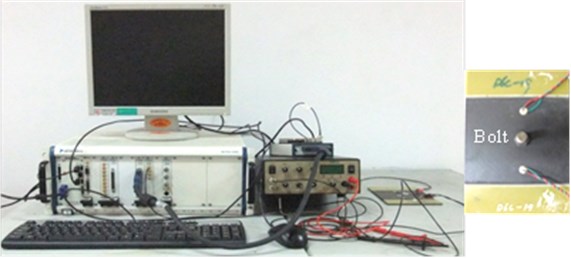
In the experiment, the NI-PXI measurement system controls the wave generator to produce required signals and then the signals are amplified by the power amplifier. The amplified signals excite PZTs to generate stress wave propagating in structures. Finally, the diagnostic stress wave signals are acquired by other PZTs. In the experiment, the modulated sine signal of 5 cycles whose central frequency is 300 kHz is used. The sampling frequency is 8 MHz and the sampling point number is 5000.
The C scans of the first group of specimens are shown in Fig. 6.
Fig. 6C scan of the first group of specimen
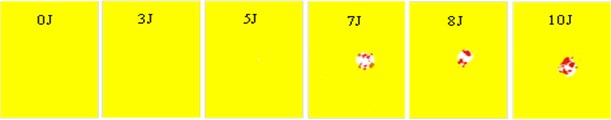
The C scans show that the impact energy of 0 J and 3 J to laminate specimen produce no damage. One bad data point surfaces with the impact energy of 5 J. When the energy exceeds 5 J and continues to increase, the delamination damage occurs and becomes more severe. Fig. 7 gives the stress wave signals under different impact energy. When damage occurs, considerable signal differences can be noticed between the monitored signals and the baseline signals. Thus damage identification and localization can be realized by quantifying these changes with DI.
Fig. 7Stress wave signals under different impact energy
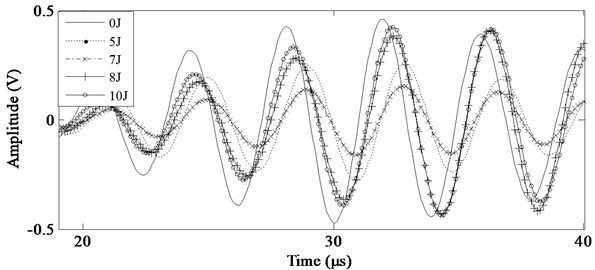
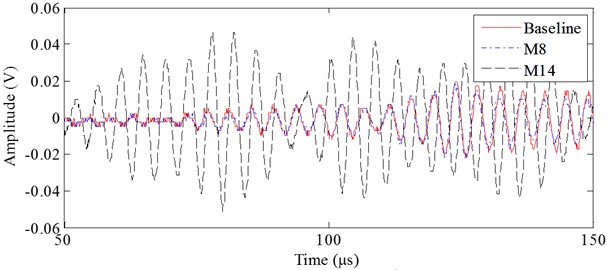
Fig. 8 shows the stress wave signals with bonded bolts of M8 and M14. Similar to the real impact damage, the monitored signals change a lot in amplitudes and phases compared to the baseline signals. Thus the real impact damage can be replaced by bonded bolts in this paper to reduce experiment cost.
Fig. 8Stress wave signals with bonded bolts of M8 and M14
4. Experiment validation
4.1. Experiment setup
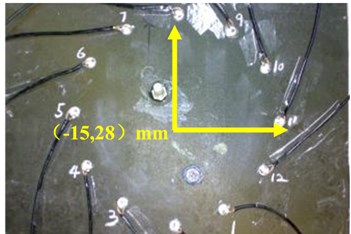
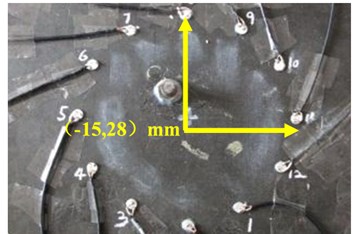
To validate the feasibility and effectiveness of the proposed algorithm , experiments are followed. An SHM validation system is built for validation experiments on a carbon fiber composite laminate as shown in Fig. 9. The laminate with the dimension of 350 mm×300 mm×3 mm is bonded with 12 PZTs forming a monitoring circle whose radius is 100 mm. Two bolts M8 and M14 are surface bonded on the laminate separately as shown in Fig. 10.
Fig. 9Composite laminate for validation
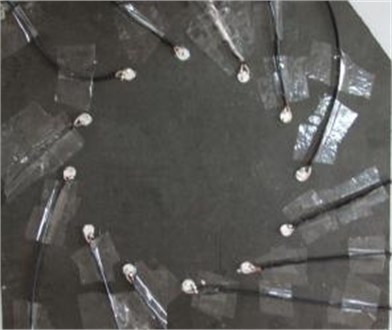
The PZT index and actuator-sensor channels are shown in Fig. 11. The scan is carried out as follows: first PZT 1 is the actuator and all the other 11 PZTs act as the sensors. Then PZT 2 is the actuator and PZT 3 ~ PZT 12 as the sensors. The process repeats until PZT 11 acts as the actuator. In total, there are 66 actuator-sensor channels shown in Fig. 11.
Every half hour, a group of baseline signals are acquired when the laminate is intact. Ten groups of stress wave signals are obtained and averaged as the baseline signal. Take the bolt M14 as the example. After bolt M14 is bonded on the laminate, 10 groups of monitored signals are acquired every half hour. The baseline and monitored stress wave signals on channels 3-8 and 4-11 are shown in Fig. 12. Since bolt M14 is placed on channel 3-8, the signal difference between the baseline and monitored signals on channel 3-8 is larger than that on channel 4-11.
Fig. 10Displacement of bolts M8 and M14
a)
b)
4.2. Damage index
Still take bolt M14 as the example. The scale parameter in Eq. (1) is chosen as [150 kHz, 450 kHz]. Wavelet transforms of both the baseline signals and monitored signals on channels 3-8 and 4-11 are shown in Fig. 13. Considering that M14 is placed on channel 3-8, the signal difference between the baseline and monitored signals on channel 3-8 is larger than that on channel 4-11.
The time duration in Eq. (1) is chosen as [0, 400 us]. The calculated average DIs for M8 and M14 on all the 66 channels are listed in Table 1 and Table 2.
The distributions of are shown in Fig. 14. Several channels have much larger than other channels. Take bolt M14 as the example, Fig. 15 shows those channels whose are larger than 0.3 with red color. These channels all intersect around the true damage location, which explains the effectiveness of the proposed damage localization algorithm.
Fig. 11PZT index and actuator-sensor channels
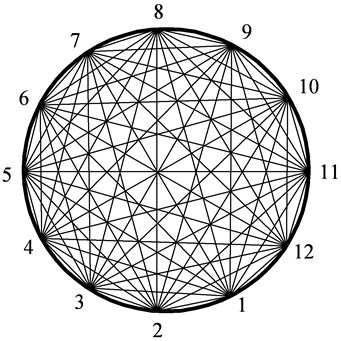
Fig. 12Baseline and monitored signals on channels 3-8 and 4-11
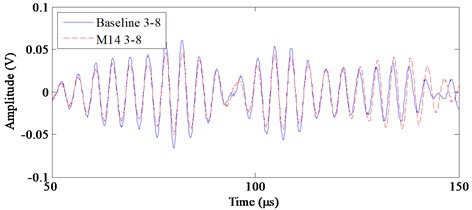
a) Baseline and monitored signals on channel 3-8
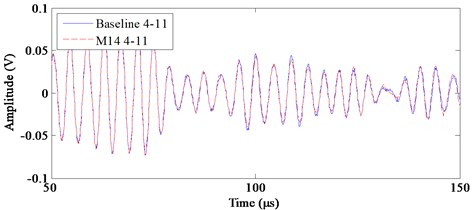
b) Baseline and monitored signals on channel 4-11
Fig. 13Time-energy density of baseline and monitored signals on channels 3-8 and 4-11
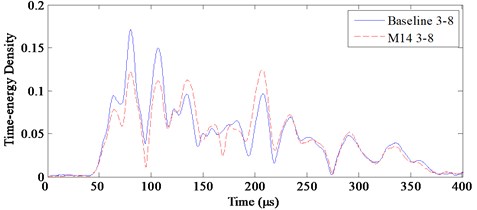
a) Channel 3-8
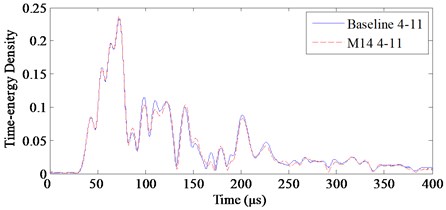
b) Channel 4-11
Fig. 14Average DIs distribution on all the 66 channels for M8 and M14
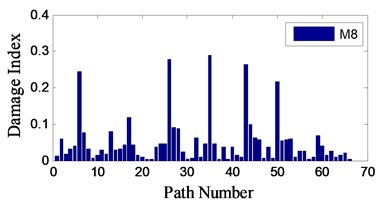
a)
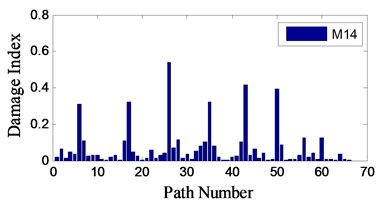
b)
Table 1Average DIs for M8
Channel | PZT | DI | Channel | PZT | DI | Channel | PZT | DI | Channel | PZT | DI |
1 | 1-2 | 0.0116 | 18 | 2-9 | 0.042 | 35 | 4-9 | 0.2894 | 52 | 7-8 | 0.0561 |
2 | 1-3 | 0.059 | 19 | 2-10 | 0.0145 | 36 | 4-10 | 0.0470 | 53 | 7-9 | 0.0604 |
3 | 1-4 | 0.0175 | 20 | 2-11 | 0.0098 | 37 | 4-11 | 0.0036 | 54 | 7-10 | 0.009 |
4 | 1-5 | 0.0317 | 21 | 2-12 | 0.0051 | 38 | 4-12 | 0.0383 | 55 | 7-11 | 0.0255 |
5 | 1-6 | 0.0408 | 22 | 3-4 | 0.0051 | 39 | 5-6 | 0.0037 | 56 | 7-12 | 0.0277 |
6 | 1-7 | 0.2458 | 23 | 3-5 | 0.0367 | 40 | 5-7 | 0.0375 | 57 | 8-9 | 0.0049 |
7 | 1-8 | 0.0764 | 24 | 3-6 | 0.0452 | 41 | 5-8 | 0.0165 | 58 | 8-10 | 0.0089 |
8 | 1-9 | 0.0328 | 25 | 3-7 | 0.0456 | 42 | 5-9 | 0.0088 | 59 | 8-11 | 0.0676 |
9 | 1-10 | 0.0078 | 26 | 3-8 | 0.2786 | 43 | 5-10 | 0.2639 | 60 | 8-12 | 0.0397 |
10 | 1-11 | 0.0144 | 27 | 3-9 | 0.0896 | 44 | 5-11 | 0.0988 | 61 | 9-10 | 0.0147 |
11 | 1-12 | 0.0296 | 28 | 3-10 | 0.0876 | 45 | 5-12 | 0.0638 | 62 | 9-11 | 0.026 |
12 | 2-3 | 0.018 | 29 | 3-11 | 0.0238 | 46 | 6-7 | 0.0561 | 63 | 9-12 | 0.0107 |
13 | 2-4 | 0.08 | 30 | 3-12 | 0.0035 | 47 | 6-8 | 0.0076 | 64 | 10-11 | 0.0166 |
14 | 2-5 | 0.0292 | 31 | 4-5 | 0.0068 | 48 | 6-9 | 0.0386 | 65 | 10-12 | 0.0197 |
15 | 2-6 | 0.031 | 32 | 4-6 | 0.0618 | 49 | 6-10 | 0.0058 | 66 | 11-12 | 0.003 |
16 | 2-7 | 0.0422 | 33 | 4-7 | 0.0108 | 50 | 6-11 | 0.2159 | |||
17 | 2-8 | 0.12002 | 34 | 4-8 | 0.0448 | 51 | 6-12 | 0.0553 |
Table 2Average DIs for M14
Channel | PZT | DI | Channel | PZT | DI | Channel | PZT | DI | Channel | PZT | DI |
1 | 1-2 | 0.0184 | 18 | 2-9 | 0.0483 | 35 | 4-9 | 0.3237 | 52 | 7-8 | 0.0047 |
2 | 1-3 | 0.0665 | 19 | 2-10 | 0.0265 | 36 | 4-10 | 0.081 | 53 | 7-9 | 0.0057 |
3 | 1-4 | 0.0119 | 20 | 2-11 | 0.0048 | 37 | 4-11 | 0.0204 | 54 | 7-10 | 0.0082 |
4 | 1-5 | 0.0502 | 21 | 2-12 | 0.0129 | 38 | 4-12 | 0.0003 | 55 | 7-11 | 0.0282 |
5 | 1-6 | 0.0338 | 22 | 3-4 | 0.0608 | 39 | 5-6 | 0.0029 | 56 | 7-12 | 0.1238 |
6 | 1-7 | 0.3118 | 23 | 3-5 | 0.0116 | 40 | 5-7 | 0.02 | 57 | 8-9 | 0.0202 |
7 | 1-8 | 0.109 | 24 | 3-6 | 0.0316 | 41 | 5-8 | 0.0276 | 58 | 8-10 | 0.04 |
8 | 1-9 | 0.0234 | 25 | 3-7 | 0.0436 | 42 | 5-9 | 0.1034 | 59 | 8-11 | 0.0093 |
9 | 1-10 | 0.0309 | 26 | 3-8 | 0.5404 | 43 | 5-10 | 0.4168 | 60 | 8-12 | 0.1232 |
10 | 1-11 | 0.0306 | 27 | 3-9 | 0.0726 | 44 | 5-11 | 0.0315 | 61 | 9-10 | 0.0098 |
11 | 1-12 | 0.0064 | 28 | 3-10 | 0.1121 | 45 | 5-12 | 0.0669 | 62 | 9-11 | 0.0066 |
12 | 2-3 | 0.0024 | 29 | 3-11 | 0.0139 | 46 | 6-7 | 0.0148 | 63 | 9-12 | 0.004 |
13 | 2-4 | 0.0178 | 30 | 3-12 | 0.0383 | 47 | 6-8 | 0.04 | 64 | 10-11 | 0.0354 |
14 | 2-5 | 0.0327 | 31 | 4-5 | 0.0085 | 48 | 6-9 | 0.0044 | 65 | 10-12 | 0.0062 |
15 | 2-6 | 0.0022 | 32 | 4-6 | 0.0511 | 49 | 6-10 | 0.0106 | 66 | 11-12 | 0.0026 |
16 | 2-7 | 0.1067 | 33 | 4-7 | 0.0833 | 50 | 6-11 | 0.3952 | |||
17 | 2-8 | 0.3195 | 34 | 4-8 | 0.1041 | 51 | 6-12 | 0.0881 |
4.3. Damage localization
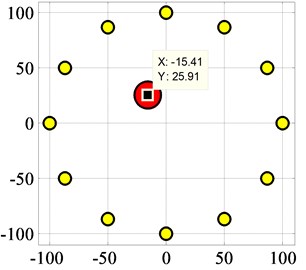
The proposed algorithm is used for damage identification and localization according to Eq. (6), where the threshold for damage identification 0.1 and weight coefficient 0.5. Fig. 16 (a) and (b) are the localization results of M14 and M8, which are (-13, 26) and (-15, 26), respectively. The localization errors are 3 mm and 2 mm, respectively.
By comparing the localization result and the actual localization, the proposed can realize damage identification and localization.
To further optimize the algorithm to reduce localization error, the weight coefficient is set as 0, 0.1, 0.2, 0.3, 0.4, 0.5, 0.6, 0.7, 0.8, 0.9 and the corresponding localization errors are listed in Table 3.
Fig. 15Channels with DI larger than 0.3 for M14
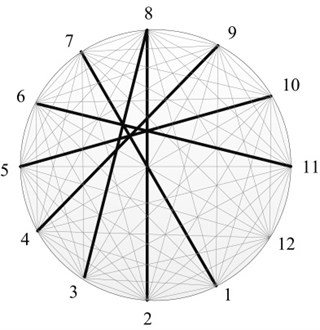
Fig. 16Localization result for both M8 and M14
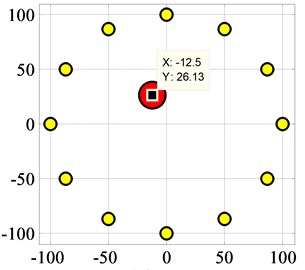
a)
b)
From Table 3 it is concluded that when 0.4, localization errors are all 10 mm, especially when ranges in 0.5~0.8, the localization errors are all < 5 mm. The main reason is when 0.4, the influence of environmental and measurement system noise is nearly excluded. When 0.9, it is likely that only one intersection will be used for damage localization. In this way the final localization result is the intersection, which will increase the localization error.
A circle with the radius of 100 mm is monitored by 12 PZTs evenly spaced in the above experiment. To further validate the effectiveness of the proposed , the PZT arrangement is changed at two aspects. One is a regular PZT arrangement with fewer sensors and the other is a random PZT arrangement.
Table 3Localization errors with different weight coefficient R
M8 | M14 | ||||
Localization (mm) | Error (mm) | Localization (mm) | Error (mm) | ||
0 | (-10,3) | 24 | 0 | (-10,7) | 22 |
0.1 | (-17,4) | 24 | 0.1 | (-13,15) | 2 |
0.2 | (-6,10) | 20 | 0.2 | (-8,28) | 7 |
0.3 | (-19,8) | 20 | 0.3 | (-12,26) | 4 |
0.4 | (-16,25) | 3 | 0.4 | (-11,27) | 4 |
0.5 | (-15,26) | 2 | 0.5 | (-13,26) | 3 |
0.6 | (-15,26) | 2 | 0.6 | (-13,26) | 3 |
0.7 | (-15,26) | 2 | 0.7 | (-13,26) | 3 |
0.8 | (-15,26) | 2 | 0.8 | (-14,26) | 2 |
0.9 | (-17,22) | 6 | 0.9 | (-21,21) | 9 |
6 PZTs with even numbers are utilized to testify the localization accuracy of (Fig. 17). As done in the case with 12 PZTs, the weight coefficient is set as 0, 0.1, 0.2, 0.3, 0.4, 0.5, 0.6, 0.7, 0.8, 0.9, the localization errors for both M8 and M14 are shown in Table 4.
Fig. 17PZT index and actuator-sensor channels for the case of 6 PZTs
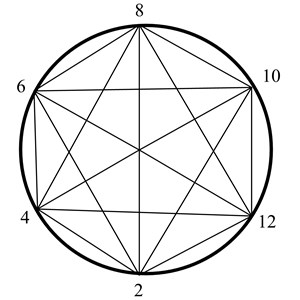
Table 4Localization errors with different weight coefficient R
M8 | M14 | ||||
Localization (mm) | Error (mm) | Localization (mm) | Error (mm) | ||
0 | (-7,2) | 27 | 0 | (6,15) | 25 |
0.1 | (-7,2) | 27 | 0.1 | (7,15) | 25 |
0.2 | (-8,4) | 25 | 0.2 | (8,12) | 28 |
0.3 | (-17,7) | 21 | 0.3 | (8,12) | 28 |
0.4 | (-17,7) | 21 | 0.4 | (-1,17) | 18 |
0.5 | (-17,7) | 21 | 0.5 | (-1,17) | 18 |
0.6 | (-17,7) | 21 | 0.6 | (-1,17) | 18 |
0.7 | (-2,16) | 18 | 0.7 | (-1,17) | 18 |
0.8 | (-21,12) | 17 | 0.8 | (-1,17) | 18 |
0.9 | (-21,12) | 17 | 0.9 | (-1,17) | 18 |
Compared to the localization results with 12 PZTs, the localization errors can only be controlled to be less than 20 mm with 6 PZTs. The main reason is that none of these actuator-sensor channels passes where the damage occurs. However, compared to the case with 12 PZTs, only 1/4 actuator-sensor channels handled indicate a faster response and lower requirement for the SHM system.
The other case is a random PZT arrangement. When a complex structure is monitored or some sensors do not work properly, the working sensors cannot be arranged as regularly as above. In this case, some sensors are randomly excluded from the above 12 PZTs arrangement. Here is set as 0.5 and the localization results are shown in Table 5.
Table 5Localization errors with PZTs excluded
M8 | M14 | ||||
PZT excluded | Localization (mm) | Error (mm) | PZT excluded | Localization (mm) | Error (mm) |
1 | (-11,25) | 5 | 1 | (-10,25) | 6 |
1~2 | (-15,25) | 3 | 1~2 | (-15,25) | 3 |
1~3 | (-8,29) | 7 | 1~3 | (-8,29) | 7 |
1~4 | (-4,60) | 34 | 1~4 | (4,28) | 19 |
1~5 | (14,83) | 62 | 1~5 | (-19,57) | 29 |
When three PZTs 1, 2 and 3 are excluded from the actuator-sensor network, the localization errors are all less than 10 mm, but the errors increase dramatically when PZT 4 is excluded. Localization results in coordination y exceed the actual value a lot for both M8 and M14. The reason for that is the severe spatial unbalance of sensor distribution brought by the missing of 4 PZTs. When PZT 5 is excluded, the localization error can be as large as 62 mm. Therefore in the initial sensor distribution, some attention should be paid to the balanced sensor distribution. Also discovered from the experiment is the fact that one or two sensors missed from the initial sensor array will not change the localization results, which makes sure that the proposed can stand some malfunction of a small number of sensors.
5. Conclusions
The damage index weighted average localization algorithm () is proposed in this paper. first calculates by comparing the monitored signals and baseline signals, then utilizes the channel intersection as the variable and minor value as the weight to realize damage identification and localization.
Some pre-experiments are done on composites laminates to verify that artificial bonded bolts and real impact delamination damage both change the monitored signals. To reduce experiment cost, the validation experiment is carried out by artificial bonded bolts. The experiment validates that the proposed algorithm successfully identifies damage with localization errors less than 5 mm. The weight coefficient is discussed in details to optimize from less influence by environmental and measurement system noise. A regular PZT arrangement with fewer sensors verifies that 6 sensors are enough for localization error of 20 mm and a random PZT arrangement with one or two sensors missed from the initial sensor array will not influence the localization accuracy. All the experiments show as a reliable method for application of SHM in real structures.
References
-
The new-technology Boeing 787 Dreamliner, which makes extensive use of composite materials, promises to revolutionize commercial air travel. Aviation Week and Space Technology Market Supplement, 14 March, 2005, p. S1-31.
-
Chang F. K. Structural Health Monitoring, System Health Management. New York, John Wiley and Sons, Inc., 2011.
-
Przemyslaw K. Two approaches to structural damage identification: model updating versus soft computing. Journal of Intelligent Material Systems and Structures, Vol. 17, 2006, p. 63-79.
-
Monnier T. Stress waves-based impact damage monitoring of a stiffened aircraft panel using piezoelectric transducers. Journal of Intelligent Material Systems and Structures, Vol. 17, 2006, p. 411-421.
-
Yuan S. F., Liang D. K., Shi L. H., Zhao X., Wu J., Li G., Qiu L. Recent progress on distributed structural health monitoring research at NUAA. Journal of Intelligent Material Systems and Structures, Vol. 19, 2008, p. 373-386.
-
Lallart M., Monier T., Guyomar D. Energy-efficient method for embedded in situ structural health monitoring. Structural Health Monitoring, Vol. 9, p. 87-98.
-
Ihn J. B., Chang F. K. Pitch-catch active sensing methods in structural health monitoring for aircraft structures. Structural Health Monitoring, Vol. 7, 2008, p. 5-19.
-
Su Z. Q., Ye L., Lu Y. Guided stress waves for identification of damage in composite structures: a review. Journal of Sound and Vibration, Vol. 295, 2006, p. 753-780.
-
Ihn J. B., Chang F. K. Detection and monitoring of hidden fatigue crack growth using a built-in piezoelectric sensor/actuator network: I. Diagnostics. Smart Materials and Structures, Vol. 13, 2004, p. 609-620.
-
Ihn J. B., Chang F. K. Detection and monitoring of hidden fatigue crack growth using a built-in piezoelectric sensor/actuator network: II. Validation using riveted joints and repair patches. Smart Materials and Structures, Vol. 13, 2004, p. 621-630.
-
Qing X. P., Beard S., Shen S. B., Banerjee S., Bradley I., Salama M. M., Chang F. K. Development of a real-time active pipeline integrity detection system. Smart Materials and Structures, Vol. 18, 2009, p. 115010.
-
Watkins R., Jha R. A modified time reversal method for Lamb wave based diagnostics of composite structures. Mechanical Systems and Signal Processing, Vol. 31, 2012, p. 345-354.
-
Miao X. T., Wang D., Ye L., Lu Y., Li F. C., Meng G. Identification of dual notches based on time-reversal Lamb waves and a damage diagnostic imaging algorithm. Journal of Intelligent Material Systems and Structures, Vol. 22, 2011, p. 1983-1992.
-
Ramadas C., Janardhan Padiyar M., Balasubramaniam K., Joshi M., Krishnamurthy C. V. Delamination size detection using time of flight of anti-symmetric (Ao) and mode converted Ao mode of guided Lamb waves. Journal of Intelligent Material Systems and Structures, Vol. 21, 2010, p. 817-825.
-
Lu Y., Ye L., Su Z. Q., Zhou L. M., Li C. Artificial neural network (ANN)-based crack identification in aluminum plates with Lamb wave signals. Journal of Intelligent Material Systems and Structures, Vol. 20, 2009, p. 39-49.
-
Flynn E. B., Todd M. D. A Bayesian approach to optimal sensor placement for structural health monitoring with application to active sensing. Mechanical Systems and Signal Processing, Vol. 24, 2010, p. 891-903.
-
Banerjee S., Qing X. P., Beard S., Chang F. K. Prediction of progressive damage state at the hot spots using statistical estimation. Journal of Intelligent Material Systems and Structures, Vol. 21(6), 2010, p. 595-605.
-
Wang C. H., Rose J. T., Chang F. K. A synthetic time-reversal imaging algorithm for structural health monitoring. Smart Materials and Structures, Vol. 13, p. 415-423.
-
Michaels J. E. Detection, localization and characterization of damage in plates with an in situ array of spatially distributed ultrasonic sensors. Smart Materials and Structures, Vol. 17, 2008, p. 035035.
-
Cai J., Shi L. H., Yuan S. F., Shao Z. High spatial resolution imaging for structural health monitoring based on virtual time reversal. Smart Materials and Structures, Vol. 20, 2011, p. 055018.
About this article

This research is supported by the National Natural Science Foundation of China (Grant No. 11172128 and Grant No. 61161120323), the Specialized Research Fund for the Doctoral Program of Higher Education of China (Grant No. 20123218110001), the ‘Six Talent Peak’ Project of Jiangsu Province (Grant No. 2010-JZ-004) and a Project Funded by the Priority Academic Program Development of Jiangsu Higher Education Institutions.
