Abstract
Continuous rigid-frame bridges are usually symmetrically designed along the bridge center line for simplicity and clarity purposes. However, the skewed bridges are necessary in case of complex intersections with space constraint in highways. Previous research mainly focuses on the discussion of skewed angle and the interaction between girders and cross frames on I shape section. Box sections are also used for skewed bridge due to large torsion stiffness, which have many problems during service time. This paper analyzed coupled skew and bending effect for the bridge which combines the continuous rigid-frame system and skewed system. For skewed bridges, significant out-of-lane effect occurs in bridges, which is hard to be predicted through linear analysis. For continuous bridges, at the interior supports, negative bending moments exist. In addition, a part of each diaphragm of the bridge is connected to the main girder, and the rest part only carries its self-weight, which makes the girder behavior more complex in the transverse direction. Therefore, the spatial performance of the bridge is very complex. The design cannot only use simple two dimension analysis. In the paper the three dimensional finite element analysis was conducted to find the effect due to dead load, live load, temperature, and brake force to find critical position for monitoring and maintainance. Primary bending normal stress, warping normal stress, coefficient of shearing force lag and stress distribution of consolidation pier were analyzed and output. The behavior of both superstructure and sub structure were investigated. The effect of coupled bending and torsion is significant to the behavior of the bridge. Finally the design recommendations about the skew bridge are given. The critical positions for the further test and monitoring are found.
1. Introduction
The skewed bridges are widely used in highways to meet the demand for complex intersections with space constraint [1-2], such as ramps and highways where lanes are decreased. Previous research and current research mainly focus on the analysis of the skew angles on I shaped sections. The effect of skew is important for skew angles greater than 30º [2-3]. It is found that skewed bridges have smaller vertical deflections and bending moments than the similar right bridges [2-5], but larger torsional rotations, shears and moments exist in the skewed bridges. A lot of studies were conducted about I-shaped girders with cross frames. The interaction between girders and transverse cross frames influences the load distribution. In China, concrete girders with box sections are commonly used due to the high strength and large torsion stiffness. The research on skewed bridges is not as much as steel girders. It is found that higher width-to-span ratio could reduce the vertical displacements and torsional deformations but increase the torsional stresses. When the skew angle increases [3-8], vertical bending moments and deformations decrease, and torsional stresses and deformations increase.
For continuous rigid frame bridges, the abutments and the main girders are rigid connected, which could be used for longer span bridge design. The vertical loading induces negative bending moment at interior supports, which decrease the positive bending moment at middle span and the section geometry dimension is decreased too. For bridges with box sections, the sections have large bending and torsion stiffness, which have large resistance of bending and torsion. If the bridge is also skewed, out-of-plane effect exists, and the structure behavior would be more complex. Currently more box sections skew bridges are built all over the word since box sections have large torsion stiffness, but the design is usually based on two-dimensional analysis. Two-dimensional analysis method cannot predict actual behavior, and nonlinear three-dimensional analysis is necessary for investigation and testing [8]. Most researches focus the skewed bridges and continuous rigid-frame bridges separately [9-11], and many problems were found for the combined skew bridges with box sections. In the paper, a bridge with complex superstructure and substructure were analyzed to find the effect of coupled skew and bending under the combination of dead load and service load.
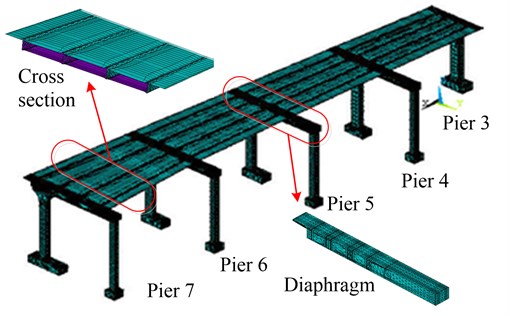
The bridge in the paper is a highway bridge with four spans as of 4×28 m. The main girder has concrete box sections with the width varying from 15.14 to 21.72 m. There are five piers numbering from 3 to 7 along the spans, and the main girder and the piers are rigid connected at pier 4 to pier 7, each of which has a main single-column pier and an auxiliary single-column pier. Pier 3 only has a single pier. The diaphragms at pier 4 to pier 7 are extended to be rigid connected with the auxiliary piers. To investigate the behavior of the bridge and give recommendations for monitoring and design, a detailed 3-D finite element model was conducted to analyze the stresses and deflections.
2. Finite element modeling
ANSYS software was used to develop finite element models [12]. Shell elements are used for main girder with box sections, and solid elements are used for diaphragms and piers. Shell 63 element has four nodes with 6 DOF at each node. Link8 elements are used for the longitudinal and transverse tendons. Figure 1 shows the entire model. The model has a total of 312,341 elements and 92,655 nodes. The self weights of the pavement and barriers are applied at top of girders.
Fig. 1Finite element model of the rigid frame bridge
2.1. Boundary conditions
At the bottom of each pier, fixed boundary conditions are applied as restraints of the vertical, longitudinal and lateral displacements. From pier 4 to 7, the main girder is rigid connected to the main pier, and the cantilever end of diaphragms are rigid connected to auxiliary pier at each support. At pier 3, the main girder is simply supported on the pier, which means only vertical restrains exist between the main girder and the pier.
2.2. Loading conditions
According to General Code for Design of Highway Bridges and Culverts (JTC D60–2004), the dead loads include the self-weight of all structural components of the bridge, the wearing surface of the bridge deck, and the attached appurtenances. According to General Code for Design of Highway Bridges and Culverts (JTC D60–2004), the live load includes the design truck load and design lane load. The arrangement of live loads on the bridge is selected to produce the maximum load effect on the critical sections. The temperature change of global system is considered with a magnitude of 20 Celsius degree, and the temperature gradient along vertical concrete deck direction is considered as 5 Celsius degree [14-16].
The brake force is applied according to Section 2.3.3 of JTG D60-2004. Four sets of settlements are considered as below:
• Set 1: 0.5 cm settlement at pier 3, 5 and 7;
• Set 2: 0.5 cm settlement at pier 4 and 6;
• Set 3: 1.0 cm settlement at pier 3, 5 and 7;
• Set 4: 1.0 cm settlement at pier 4 and pier 6.
In the models, different combinations of loads mentioned above were considered to find the unfavorable stress and deflection during service time [17-19].
2.3. Material and properties
A nonlinear elastic isotropic material model is used for concrete in the elastic range, with an elastic modulus of 35 GPa and Poisson’s ratio of 0.1667. The density of concrete is 26000 N/m3 with expansion coefficient 1.2E-5. For pre-stressed tendon, a linear elastic isotropic material model is used with an elastic modulus of 200 GPa and Poisson’s ratio of 0.3. The density of steel is 78500 N/m3 and the expansion coefficient is considered as 1.2E-5. The nonlinear elastic analysis was developed thereafter.
3. Structural analysis and results
3.1. Normal stress
Normal stress is obtained to find the locations of stress concentration. Since the effects due to temperature changing are very complicated, individual analysis about the temperature was developed first. It is found that the global temperature changing has a little effect to the main girder and diaphragms, but has significant effect to the piers; the temperature of concrete deck has some effects to the main girder and diaphragms in longitudinal direction, but negative effect to the diaphragms transversely, and a little effect to the piers.
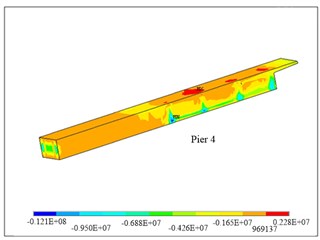
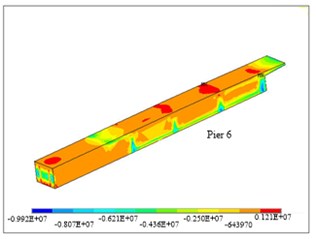
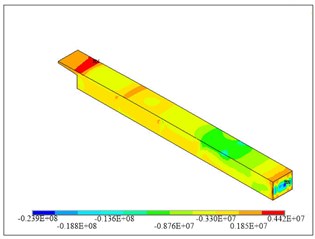
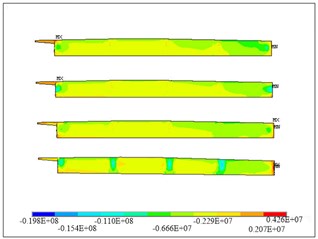
Under the unfavorable combination of the dead load, live load, pre-stress tendon, settlements and temperature, for the main girder, the normal stresses of top plate, bottom plate and web distributed uniformly, and the stresses meet the design criteria. For each diaphragm, at the cantilever part, the tensile stress is big, which needs more pre-stressed tendon and reinforcements. The numbering of diaphragms is corresponding to that of piers. As shown in Fig. 2, diaphragm 4 and diaphragm 6 have larger tensile stress on the top. The maximum tension stress is around 2.3 MPa, and for tension field, more reinforcements are needed to reduce cracks. The reason is that more pre-stressed tendons were arrenged and induced the girder hogging and the first span rotated. The pre-stressed tensons were designed based on 2D analysis, which is not a proper way for the actual behavior of the structure. Diphragm 6 at pier 6 has tension at the cantilever part, where the reinforcements must be enforced. Diaphragms 5 and 7 have less than 1 MPa tension, and most field are in compression.
Fig. 2Normal stress distributions of a) pier 4, b) pier 6
a)
b)
Fig. 3Transverse stress distribution of diaphragm 4: a) diaphragm, b) four layers
a)
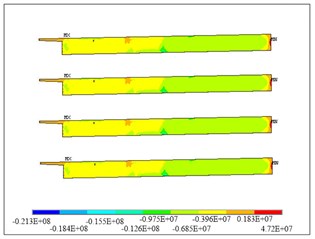
b)
Fig. 4Transverse stress distribution of diaphragm 6: a) diaphragm, b) four layers
a)
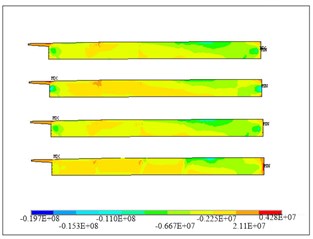
b)
3.2. Transverse stress
Under the unfavorable combination of load, the transverse stresses distribute uniformly and not big at top plate, bottom plate and web. The transverse tensile stresses at interior diaphragms, however, are big, which mainly distributes in the junction area of the diaphragm cantilever and the main girder. This is mainly because of the complicated configurations at this area and hence stress concentrations caused by the self-weight of diaphragms cantilever. Therefore, an enhancement or reinforcement at this location is required based on the finite element analysis.
On pier 4, due to over arrangement of transverse pre-stress tendons, the main girder is hogged and the span between pier 3 and pier 4 has large torsion, causing remarkable local tensile stress. During service time the girder between piers 3 and 4 needs to be monitored to avoid large cracks.
For the unsymmetrical structure in transverse direction, except to make the diaphragms meet design, the amount and the shape of pre-stress tendons are designed considering the torsional effect due to un-symmetrical geometry. The unbalanced forces easily induce torsion in girders.
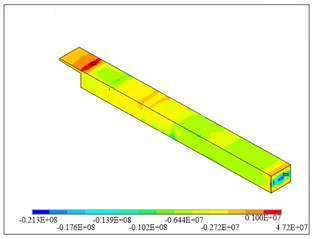
At diaphragm 4, as shown in Fig. 3, the stress at the top of main pier is relatively high due to the pre-stress tendon in the diaphragm, which bends too early on top of the main pier; for this location, there is also relative large bending moment in the transverse direction, which induced more tension at the top of pier; most fields are in compression. At diaphragm 5, the transverse tensile stresses are smaller than that of diaphragm 4. In the similar manner, as shown in Figs. 4 and 5, the transverse tensile stresses at diaphragms 6 and 7 are higher due to the pre-stress tendon design.
Fig. 5Transverse stress distribution of diaphragm 7: a) diaphragm, b) four layers
a)
b)
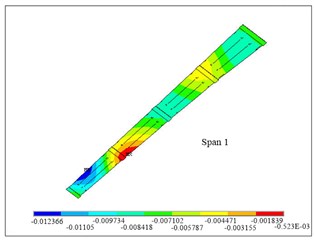
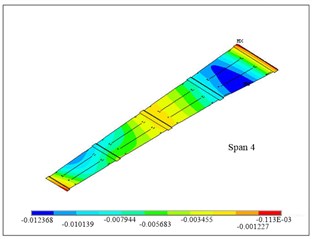
Fig. 6The maximum deflection at bottom plate of a) span 1, b) span 4
a)
b)
3.3. Deflection
For each span under the most unfavorable loading combination, the first and fourth spans have larger deflection than others. The combination of dead load, pre-stressed tendons, and the lane load at first and third spans with truck load at first span cause maximum deflection at first span (between pier 3 and pier 4). The maximum vertical deflection at the top plate is 1.5 cm, and the maximum vertical deflection at the bottom plate is 1.2 cm. The combination of dead load, pre-stressed tendons, and the lane load at second and fourth span with truck load at fourth span causes the maximum deflection at the fourth span. The maximum vertical deflection of top plate is 1.4 cm and 1.2 cm for the bottom plate. Figure 6 shows the deflection at first and fourth span. The maximum deflection at fist span occurs in the right angle line, while the maximum deflection occurs near skewed line.
3.4. Shear lag
According to general beam theory, for wide box section, the normal stress distribution along width is uniform at flanges. Actually when box girders bend, the normal stresses of flanges distribute in a shape of curve due to non-linear distribution of shear deformation, and the normal stress distribution along width is not uniform, which is called shear lag. According to the classical definition, if the normal stress at the flange and web connection is larger than that calculated by the general beam theory, it is called positive shear lag; otherwise, it is called negative shear lag. The coefficient of shear lag is usually to measure the changing of shear lag, which is defined as follows:
where:
maximum normal stress considering shear lag;
normal stress calculated based on the general beam theory.
If the stress is larger than the theoretical value that , it is called positive shear lag; while , it is called negative shear lag.
Tables 1 and 2 show the coefficient of shear lag under dead load and combination of deal load and pre-stressed tendons at the sections of each support and middle sections of each span. From the table, the effect of shear lag is significant at supports. Table 1 shows the coefficient of shear lag under dead load, which varies from 1.06 to 3.06. The effect is barely noticeable at the middle span of span 1 and 4, but significant near pier 4 and 6. Table 2 shows the coefficient of shear lag under dead load and pre-stressed tendons. The coefficient of shear lage is larger pier 4 and 6. The effect of shear lag is more significant than that in the middle span. The girder is in compression at top and bottom plate of both middle span and piers.
Table 1The coefficient of shear lag under dead load
Sections | Middle of span 1 | At pier 4 | Middle of span 4 | At pier 6 | ||||
Top plate | Bottom plate | Top plate | Bottom plate | Top plate | Bottom plate | Top plate | Bottom plate | |
-1.94 | 2.65 | 5.8 | -9.5 | -3.7 | 3.9 | 6.1 | -8.5 | |
-1.72 | 2.5 | 2.66 | -4.09 | -3.2 | 3.76 | 1.99 | -3.15 | |
1.13 | 1.06 | 2.18 | 2.32 | 1.16 | 1.04 | 3.06 | 2.70 | |
Table 2The coefficient of shear lag under dead load + pre-stressed tendons
Sections | Middle of span 1 | At pier 4 | Middle of span 4 | At pier 6 | ||||
Top plate | Bottom plate | Top plate | Bottom plate | Top plate | Bottom plate | Top plate | Bottom plate | |
-3.3 | -3 | -2.3 | -6.2 | -4.7 | -2 | -5.6 | -5.3 | |
-3.01 | -2.15 | -1.0 | -2.97 | -3.91 | -1.54 | -1.41 | -2.34 | |
1.10 | 1.40 | 2.3 | 2.08 | 1.20 | 1.30 | 3.9 | 2.26 | |
3.5. Stress distribution at piers
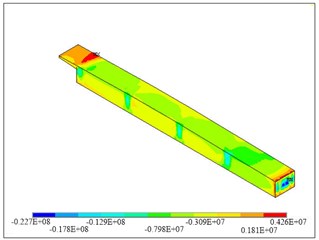
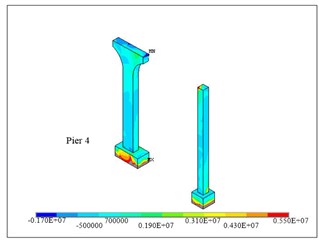
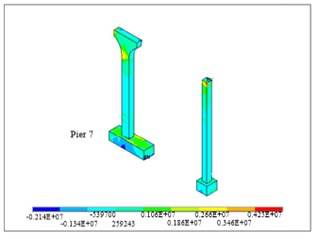
There are two types of piers including main pier and auxiliary pier for each support. Considering the effect due to dead load, live load, and temperature changing, each pier was analyzed accordingly. The piers are rigid connected to the main girders, which also carry bending moment in longitudinal direction and transverse direction. Based on the FE analysis at pier 4, each pier has larger tensile stress under the unfavorable combination. The reason is addressed as in the fact that more transverse pre-stressed tendons are arranged, but the cantilever part is short which has less selfweight. At pier 7, the top of main pier and auxiliary pier have larger tensile stress. Pier 7 only carries one span, but the main girder and piers are rigid connected, where the negative moment is very large. More reinforcements are needed at pier 7. Figure 7 shows that there are large tensile stresses at pier 4 and pier 7.
Fig. 7First principle stress at a) pier 4, b) pier 7
a)
b)
4. Conclusions
In the paper, a continuous skewed bridge with unsymmetrical sections and auxiliary piers was analized using FE analysis to investigate the behavior of the main girders, diaphragms, and piers for an overall optimized design and future monitoring. The main conclusions from the study are summarized as follows:
• The connections of main girder and diaphragm cantilevers require more reinforcements with the non-uniform distribution of self-weight in transverse directions. The unsymmetrical section and the transverse pre-stressed tendons but no longitudinal tendons in the diaphragm cantilevers have tremendous effects to behavior in the longitudinal direction, which causes large tensile stress at diaphragm cantilevers and cause the rotation of the first span, resulting in local stress concentrations.
• Continuous rigid-frame bridges with width varying along spans may have the similar behavior of skewed bridges with large torsion effects. The torsion is coupled with bending along span. The design of tendons for those kinds of bridge needs extra considerations on the torsion effect to reduce the spatial effect.
• The locations of intersections of cantilever part of diaphragms and girders and the girders and piers are critical and hence should be monitored during service load.
References
-
Ebeido T., Kennedy J. B. Girder moments in simply supported skew composite bridges. Canadian Journal of Civil Engineering, Vol. 23, Issue 5, 1996, p. 904-916.
-
While W., Coletti D., Chavel W. NCHRP Report 725 – Guidelines for Analysis Methods and Construction Engineering of Curved and Skewed Steel Girder Bridges, 2012.
-
Gupta Y. P., Kumar A. Structural behavior of interconnected skew slab–girder bridges. Journal of the Institution of Engineers (India), Vol. 64, 1983, p. 119-24.
-
Aggour M. S. Theoretical and Experimental Study of Space Frame Action and Load Distribution in Square and Skew Bridges. Thesis, Cairo University, Egypt, 1947.
-
Ghali A. Analysis of continuous skew concrete girder bridge. First International Symposium on Concrete Bridge Design, American Concrete Institute, 1967.
-
Ibrahim S. I. Harba Effect of skew angle on behavior of simply supported R. C. T-beam bridge decks. ARPN Journal of Engineering and Applied Sciences, Vol. 6, 2011, p. 1-14.
-
Skvireckas R., Kersys A., Kersys R., et al. Research of lateral vibrations of a passenger wagon running along the curved path. Journal of Vibroengineering, Vol. 14, No. 2, 2012, p. 706-714.
-
White W., Coletti D., Chavel W. NCHRP Report 725 – Guidelines for Analysis Methods and Construction Engineering of Curved and Skewed Steel Girder Bridges. 2012.
-
Hutter G. Skew and curved box-girders. Theory and research. Proceedings of the Seventh Congress, International Association for Bridges and Structural Engineering, 1964, p. 615-623.
-
He X. H., Sheng X. W., Scanlon A., Linzell D. G. Skewed concrete box girder bridge static and dynamic testing and analysis. Engineering Structures, 2012, p. 38-49.
-
Aghababaei O., Nahvi H., Ziaei-Rad S. Sensitivity analysis on dynamic responses of geometrically imperfect base excited cantilevered beams. Journal of Vibroengineering, Vol. 13, No. 1, 2011, p. 52-65.
-
ANSYS Software. Release 10, ANSYS Inc.
-
American Association of State Highway and Transportation Officials (AASHTO). LRFD Bridge Design Specifications, 2010.
-
Khaleel M. A., Itani R. Y. Live-load moments for continuous skew bridges. Journal of Structural Engineering, Vol. 116, No. 9, 1996, p. 2361-2373.
-
Ebeido T., Kennedy J. B. Girder moments in continuous skew composite bridges. Journal of Bridge Engineering, Vol. 1, No .1, 1996, p. 37-45.
-
Ebeido T., Kennedy J. B. Shear and reaction distribution in continuous skew composite bridges. Journal of Bridge Engineering, Vol. 1, No. 4, 1996, p. 155-165.
-
Wang J., Liu B. The Structure Behavior and Construction Control of Continuous Rigid Frame Bridges with High Piers. China Harbor Engineering, 2005.
-
Wang Y. J., Wei Q. C., Shi J., Long X. Y. Resonance characteristics of two-span continuous beam under moving high speed trains. Latin American Journal of Solids and Structures, Vol. 7, Issue 2, 2010, p. 185-199.
-
Xia Y., Ma H. Y., Su D. Strain mode based damage assessment for plate like structures. Journal of Vibroengineering, Vol. 15, No. 1, 2013, p. 55-63.
About this article

This paper is supported by the China Postdoctoral Science Foundation Grant No. 2011M500983 and Postdoctoral Science Foundation of Central South University and Freedom Explore Program of Central South University Grant No. 2012QNZT047.
