Abstract
A multispeed multiple frequency correlation method for decoupling aliased spectra when defect frequencies are approximate to integral multiple of the shaft speed is proposed for fault diagnosis of rolling bearing. Firstly, multiple frequencies at various shaft rotation speeds are obtained using the fast Fourier transform (FFT). Secondly, the correlation coefficients between the amplitude growth trend of the multiple frequencies and the expected trend are calculated. Thirdly, correlation coefficients of assumed inner and outer race fault multiple frequencies are acquired by averaging correlation coefficients of possible aliased multiple frequencies for each bearing failure state. Finally, the correlation coefficient curves of different assumed fault multiple frequencies are compared, enabling operational assessment of the rolling bearing. The experimental results show that the multispeed multiple frequency correlation method is an effective tool for decoupling aliased spectra and diagnosing bearing faults.
1. Introduction
Rolling bearings are widely used in rotating machinery due to their powerful carrying capacity and low friction. Defects in these bearings can cause malfunctions and even catastrophic accidents [1]. Accurately detecting defects in rolling bearings is therefore an important step toward improving the reliability and security of machinery [2].
Characteristic frequency identification is a common means of bearing fault diagnosis. Many previous studies have focused on detecting bearing defects using multiple frequency analysis. Kankar et al. [3] predicted a discrete spectrum with characteristic defect frequencies and their harmonics using the FFT. Wang and Chen [4] investigated the frequency spectrum using the short time Fourier transform (STFT), wavelet analysis (WA) and the pseudo Wigner-Ville distribution (PWVD), constructing diagnostics that accounts for variable rotation speeds. Dong and Chen [5] used the Wigner-Ville spectrum and cyclic spectral density to represent the cyclostationary signals while reducing disturbances caused by additive stationary noise. The Hilbert-Huang transform (HHT) introduced by Huang et al. [6] proved to be a robust means of obtaining instantaneous frequencies and processing nonstationary and nonlinear data. Du and Yang [7] improved the empirical mode decomposition (EMD) method by using the local mean to clarify the spectrum for vibration analysis of ball bearings. The FFT spectrum is still widely applied to processing vibration signals because of its simple diagnostic model and high computational efficiency. Identifying multiple frequencies associated with defects in FFT spectrum is a common way of evaluating bearing performance.
It is difficult to distinguish defect frequency when one or more defect multiple frequencies are coupled with basic multiple frequencies. Many studies have attempted to decouple aliased spectra. Wu et al. [8] combined phase correction with spectrum zooming to improve resolution and reduce computational complexity. Hossen and Heute [9] used sub-band decomposition and linear prediction to construct a new spectrum zooming technique with low complexity and good resolution. To zoom in local regions of the frequency spectrum, Sarkar and Fam [10] proposed the interlaced chirp transform as a means of ensuring non-overlapping frequency samples. Wang et al. [11] demonstrated that the dual-tree complex wavelet transform (DTCWT) could reduce spectral aliasing more effectively than the second-generation wavelet transform (SGWT) and EMD. Jiang et al. [12] decomposed vibration signals into a series of narrow frequency bands using ultraviolet packets and applied the ensemble empirical mode decomposition (EEMD) to improve the identification of multiple faults. These studies have focused on zooming in on local regions of the spectrum; however, it is difficult to decouple the aliased spectra and identify defect multiple frequencies when defect multiple frequencies are approximate to integral multiples of the shaft speed.
In this paper, we provide a new method of multispeed multiple frequency correlation to decouple aliased spectra of rolling bearings. The different amplitudes of growth trends in basic and defect frequencies at different speeds are analyzed to assess the operating conditions of a bearing.
2. Multispeed multiple frequency correlation of a rolling bearing
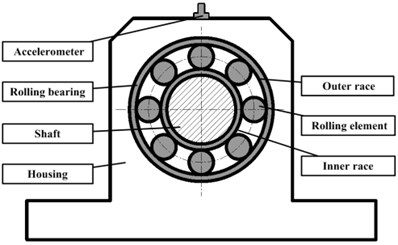
A rolling bearing is composed of an inner race, an outer race, a cage and rolling elements, as shown in Fig. 1. The number of rolling elements in the radial load zone changes with bearing rotation [1], giving rise to basic multiple frequencies (i.e., integral multiples of the shaft speed). Degradation of bearing performance may be associated with fault spots on the outer or inner race. These fault spots will cause additional shocks, which give rise to defect multiple frequencies that are integral multiples of the ball pass frequency outer (BPFO) or ball pass frequency inner (BPFI) (i.e., the frequency with which rolling elements pass fault spots on the outer or inner race) [13]. Defect multiple frequencies are generally recognized as an important symbol for fault diagnosis.
Fig. 1Typical structure of a rolling bearing
The amplitudes of multiple frequencies indicate the bearing vibration energy associated with the normal or failure state. This vibration energy, which is transferred from the rotating shaft to the measurement point through the bearing and housing, is generally reflected by vibration data collected using an accelerometer on the top of the housing. The structure impulse response determines the bearing transfer function, which in turn determines the vibration response [14]. As a result, the energy transmitted from the shaft to the measurement point changes as the state of bearing failure changes. The amplitude growth trend of peaks in the frequency spectrum can be used for bearing detection [15]. Growth trends in the amplitudes of multiple frequencies under different rotation speeds change with bearing failure, and can therefore be used for fault diagnosis.
When approximate to integral multiples of the shaft speed, the defect multiple frequencies are difficult to be distinguished from basic multiple frequencies. We define possible aliased defect multiple frequencies as assumed defect multiple frequencies, namely the defect frequencies of the inner and outer race and their harmonics (determined by the BPFO and the BPFI).
Accordingly, the amplitude growth trends of the assumed defect multiple frequencies associated with the inner race are different from those associated with the outer race under different bearing failure states and rotation speeds. Considering the vibration energy is proportional to the square of the speed, we define the square ratio of the shaft speeds as the expected multiple frequency growth trend, which correlates more strongly with the amplitude growth trends of the basic multiple frequencies than with those of the defect multiple frequencies. Although the defect multiple frequencies remain coupled to the basic multiple frequencies, the correlation between the amplitude growth trends of the assumed defect multiple frequencies and the expected growth trends decreases as the bearing breaks down.
We present multispeed multiple frequency correlation as a means of decoupling the aliased spectra and detecting rolling bearings. The steps of the multispeed multiple frequency correlation analysis are as follows:
1) Simulate different speeds of the rolling bearing and acquire the vibration signals with an accelerometer. The vector of the speeds is denoted by:
where is the bearing speed.
2) Obtain the spectra by processing the vibration signals obtained in step 1 using the FFT, defined as [16]:
where is time, is frequency, is signal.
3) Retrieve the amplitude of each multiple frequency by summing all of the frequency amplitudes within the frequency region:
where the frequency resolution is the ratio of the FFT sampling frequency to the length of the data vector (accounting for errors in the FFT). The multiple frequency amplitudes at different speeds are then:
where is the amplitude of multiple frequency at speed .
4) Acquire the growth trend in the amplitude of each multiple frequency by dividing the multiple frequency amplitude by the amplitude :
5) Define the expected multiple frequency growth trend () as:
Calculate the Pearson correlation [17] coefficients between the amplitude growth trend of each multiple frequency and the as:
6) Draw correlation coefficient curves with multiple frequency range as horizontal axis and correlation coefficients of assumed defect multiple frequencies as vertical axis. To guarantee the validity of the correlation analysis, the multiple frequency is defined to be at least twice of the BPFI. The correlation coefficients of the assumed defect multiple frequencies are obtained by averaging the correlation coefficients of possible aliased multiple frequencies. Various multiple frequency ranges of (1 to )s are analyzed to reduce occasionality and improve reliability.
7) Compare the correlation coefficient curves of different assumed defect multiple frequencies to detect the running conditions of the rolling bearing.
3. Experiment setup
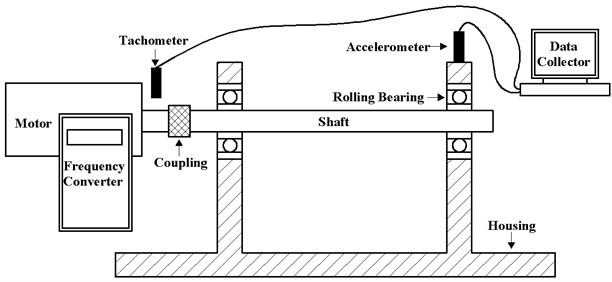
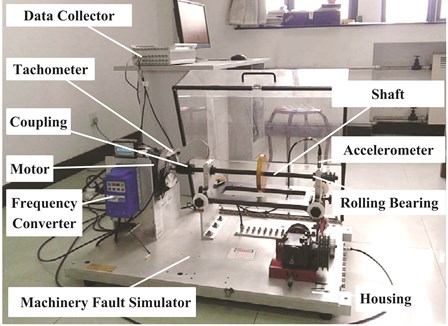
Actual vibration data from a rolling bearing were collected to verify the feasibility of applying multispeed multiple frequency correlation analysis for operational bearing assessment. The vibration data were generated using the Machinery Fault Simulator manufactured by SpectraQuest, Richmond. The rolling bearing was replaced with a bearing with a known fault. The Machinery Fault Simulator (depicted in Fig. 2) was then used to simulate various bearing fault vibrations. The vibration data were collected by an accelerometer installed on the top of the housing over the shaft. A tachometer installed over the shaft was used to monitor the shaft speed. The signals from both the accelerometer and the tachometer were transmitted to a data collector. The parameters of the bearing are as follows: rolling diameter 0.3125 in, bearing pitch diameter 1.318 in, BPFI 3.048×speed, BPFO 4.95×speed and the number of roller elements 8. The manufacturer supplied the defect bearings without detailed information regarding size and geometry of the defects. The experimental data acquisition system is shown in Fig. 3.
Fig. 2Schematic diagram of the rolling bearing fault simulator
Three running conditions (normal, inner race fault and outer race fault) were imposed using the Machinery Fault Simulator. Each simulation was run with a sampling frequency of 2000 Hz and the sampling duration of 1.5 s. To simulate running conditions at multiple speeds, we set the motor to run at speeds of 10 Hz, 15 Hz, 20 Hz, 25 Hz and 30 Hz, respectively. The running conditions for each of the 15 experiments were as follows:
F1: normal at speed 10 Hz,
F2: inner race fault at speed 10 Hz,
F3: outer race fault at speed 10 Hz,
F4: normal at speed 15 Hz,
F5: inner race fault at speed 15 Hz,
F6: outer race fault at speed 15 Hz,
F7: normal at speed 20 Hz,
F8: inner race fault at speed 20 Hz,
F9: outer race fault at speed 20 Hz,
F10: normal at speed 25 Hz,
F11: inner race fault at speed 25 Hz,
F12: outer race fault at speed 25 Hz,
F13: normal at speed 30 Hz,
F14: inner race fault at speed 30 Hz,
F15: outer race fault at speed 30 Hz.
Fig. 3Rolling bearing vibration data acquisition system
4. Experiment results
The raw acceleration signals are shown in Fig. 4. 500 samples are taken from each experiment, with each sample acquired by randomly selecting a continuous time series of 2048 data points from the total data series. The spectrum is obtained by processing these samples using the FFT, and then averaging the FFT results across all 500 samples.
The resulting spectra for experiments F7, F8 and F9 are shown in Fig. 5. The spectrum is limited to the 0-300 Hz frequency range for clarity. At speed of 20 Hz, the basic multiple frequencies are 20 Hz and harmonics, the inner race defect multiple frequencies are and harmonics, and the outer race defect multiple frequencies are and harmonics. In this case, the defect multiple frequencies are coupled with the basic multiple frequencies. Fig. 5 illustrates the difficulty in decoupling the aliased spectra to identify defect multiple frequencies without prior knowledge of the bearing failure.
The for this experiment is . A total of 30 multiple frequencies are considered in this experiment. The correlation coefficient between the amplitude growth trend for each multiple frequency and the is shown in Table 1. Correlation coefficients for the assumed defect multiple frequencies in multiple frequency ranges of (1–10), (1–11), … and (1–30) are adopted. Correlation curves under various running conditions are shown in Fig. 6, Fig. 7 and Fig. 8.
Fig. 4Raw vibration signals from each experiment (F1–F15 as defined in the text)
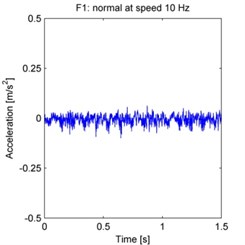
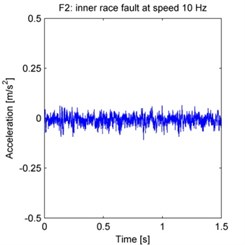
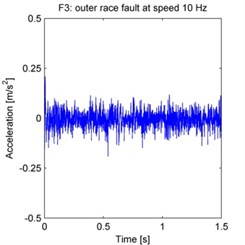
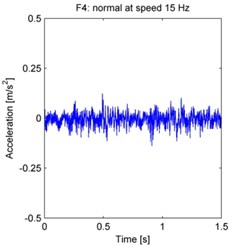
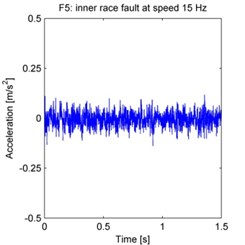
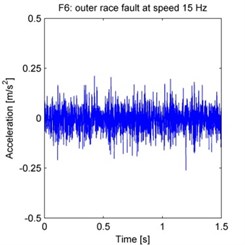
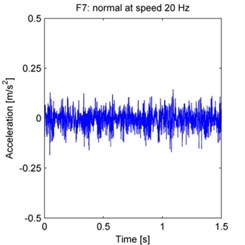
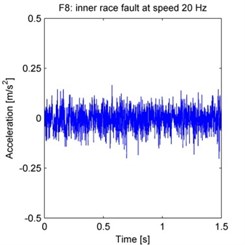
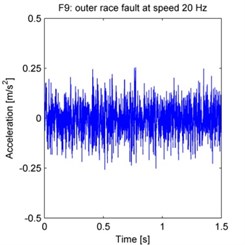
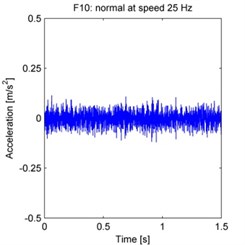
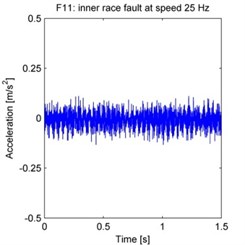
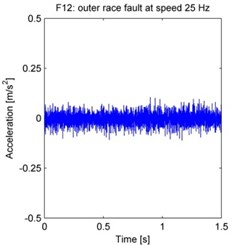
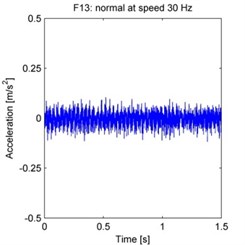
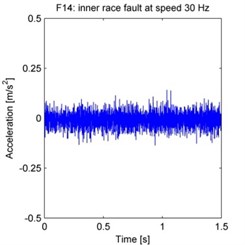
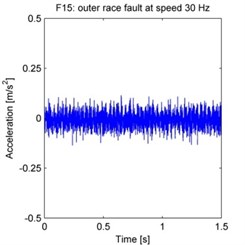
Fig. 5Vibration spectra of the rolling bearing under experiments F7, F8 and F9
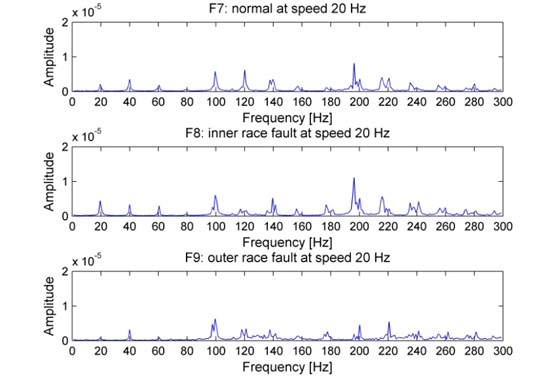
Table 1Correlation coefficients between the amplitude growth trends for multiple frequencies and the GTE
Multiple frequency | Normal | Inner race fault | Outer race fault | Multiple frequency | Normal | Inner race fault | Outer race fault |
1×speed | 0.935 | 0.533 | 0.884 | 16×speed | 0.746 | 0.923 | 0.658 |
2×speed | 0.977 | 0.892 | 0.963 | 17×speed | 0.535 | 0.441 | 0.505 |
3×speed | 0.943 | 0.977 | 0.817 | 18×speed | 0.034 | 0.964 | 0.450 |
4×speed | 0.791 | 0.602 | 0.736 | 19×speed | 0.020 | 0.742 | 0.020 |
5×speed | 0.699 | 0.739 | 0.638 | 20×speed | 0.835 | 0.450 | 0.434 |
6×speed | 0.192 | 0.287 | 0.055 | 21×speed | 0.835 | 0.759 | 0.217 |
7×speed | 0.848 | 0.820 | 0.976 | 22×speed | 0.018 | 0.193 | 0.122 |
8×speed | 0.644 | 0.672 | 0.309 | 23×speed | 0.541 | 0.818 | 0.178 |
9×speed | 0.331 | 0.710 | 0.548 | 24×speed | 0.493 | 0.016 | 0.248 |
10×speed | 0.293 | 0.053 | 0.422 | 25×speed | 0.449 | 0.623 | 0.014 |
11×speed | 0.767 | 0.700 | 0.745 | 26×speed | 0.413 | 0.790 | 0.252 |
12×speed | 0.852 | 0.928 | 0.059 | 27×speed | 0.423 | 0.860 | 0.078 |
13×speed | 0.793 | 0.822 | 0.701 | 28×speed | 0.817 | 0.998 | 0.469 |
14×speed | 0.948 | 0.849 | 0.947 | 29×speed | 0.591 | 0.751 | 0.041 |
15×speed | 0.766 | 0.652 | 0.825 | 30×speed | 0.171 | 0.615 | 0.418 |
Fig. 6Correlation coefficient curves of the assumed defect multiple frequencies under normal condition
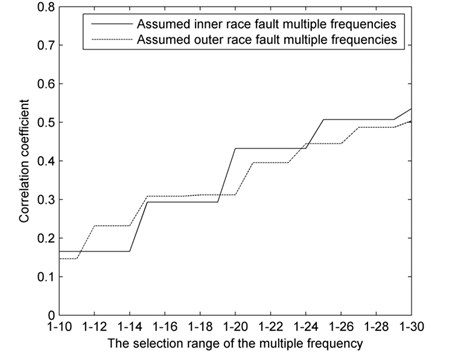
Fig. 7Correlation coefficient curves of the assumed defect multiple frequencies under inner race fault
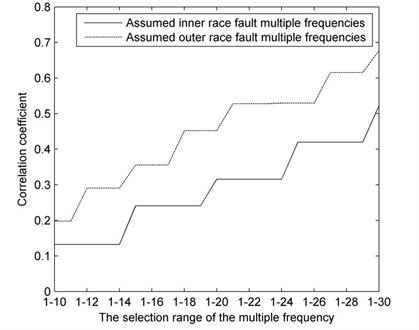
Fig. 8Correlation coefficient curves of the assumed defect multiple frequencies under outer race fault
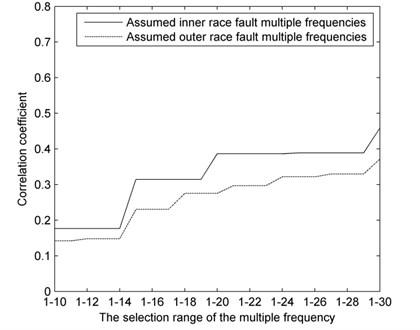
The correlation coefficient curves under normal condition (Fig. 6) overlap and differ little as a rule. By contrast, under fault conditions (Fig. 7 and Fig. 8), the correlation coefficient curves of the assumed defect multiple frequencies are substantially different. The correlation of assumed inner race fault is lower than that of assumed outer race fault conditions when the actual fault is in the inner race, and the converse is true when the actual fault is in the outer race.
Based on this result, we can effectively evaluate the running conditions of the rolling bearing by comparing the correlation coefficient curves with the following rules:
1) When the correlation coefficient curves of an assumed inner and outer race fault multiple frequencies are similar, the bearing is running under normal condition.
2) When the correlation coefficient curve of an assumed inner race fault multiple frequencies is lower than that of an assumed outer race fault, the bearing is operating with a defect in the inner race.
3) When the correlation coefficient curve of an assumed outer race fault multiple frequencies is lower than that of an assumed inner race fault, the bearing is operating with a defect in the outer race.
5. Conclusions
A multispeed multiple frequency correlation analysis method has been proposed for decoupling aliased spectra for detection of rolling bearing without prior knowledge of the bearing failure. The method is particularly useful when the defect frequencies are approximate to integral multiples of the shaft speeds. The correlation coefficient between an assumed inner race fault multiple frequencies and the is lower than that between an assumed outer race fault multiple frequencies and the when a defect develops in the inner race. The converse is true when a defect develops in the outer race. The experimental results show that the multispeed multiple frequency correlation is a powerful tool for decoupling aliased spectra and diagnosing bearing faults.
Decoupling aliased spectra remains a challenging task due to the complexity of vibration mechanism and running conditions. Subsequent research will focus on decoupling the aliased spectra of bearing function mixed with other complicating factors, such as unbalance and misalignment.
References
-
Tandon N., Choudhury A. A review of vibration and acoustic measurement methods for the detection of defects in rolling element bearings. Tribology International, Vol. 32, Issue 8, 1999, p. 469-480.
-
Randall R. B.,Antoni J. Rolling element bearing diagnostics – A tutorial. Mechanical Systems and Signal Processing, Vol. 25, Issue 2, 2011, p. 485-520.
-
Kankar P. K., Sharma S. C., Harsha S. P. Vibration based performance prediction of ball bearings caused by localized defects. Nonlinear Dynamics, Vol. 69, Issue 3, 2012, p. 847-875.
-
Wang H. Q., Chen P. Fuzzy diagnosis method for rotating machinery in variable rotating speed. IEEE Sensors Journal, Vol. 11, Issue 1, 2011, p. 23-34.
-
Dong G. M., Chen J. Noise resistant time frequency analysis and application in fault diagnosis of rolling element bearings. Mechanical Systems and Signal Processing, Vol. 33, 2012, p. 212-236.
-
Huang N. E., Shen Z., Long S. R., et al. The empirical mode decomposition and the Hilbert spectrum for nonlinear and non-stationary time series analysis. Proceedings of the Royal Society of London, Vol. 454, 1998, p. 903-995.
-
Du Q. H., Yang S. N. Application of the EMD method in the vibration analysis of ball bearings. Mechanical Systems and Signal Processing, Vol. 21, Issue 6, 2007, p. 2634-2644.
-
Wu G. B., Zhang L. J., Lu H., et al. A real-time and high-precision algorithm for frequency estimation by fusing multi-segment signals. Procedia Engineering, Vol. 15, 2011, p. 2313-2317.
-
Hossen A., Heute U. Parametric modelling of decomposed subbands: resolution improvement and applications for narrow-band signals. Signal Processing, Vol. 84, Issue 11, 2004, p. 2195-2206.
-
Sarkar I., Fam A. T. The interlaced chirp Z transform. Signal Processing, Vol. 86, Issue 9, 2006, p. 2221-2232.
-
Wang Y. X., He Z. J., Zi Y. Y. Enhancement of signal denoising and multiple fault signatures detecting in rotating machinery using dual-tree complex wavelet transform. Mechanical Systems and Signal Processing, Vol. 24, Issue 1, 2010, p. 119-137.
-
Jiang H. K., Li C. L., Li H. X. An improved EEMD with multiwavelet packet for rotating machinery multi-fault diagnosis. Mechanical Systems and Signal Processing, Vol. 36, Issue 2, 2013, p. 225-239.
-
Scheffer C., Girdhar P. Practical Machinery Vibration Analysis and Predictive Maintenance. Newnes, Burlington, 2004.
-
Kıral Z., Karagülle H. Vibration analysis of rolling element bearings with various defects under the action of an unbalanced force. Mechanical Systems and Signal Processing, Vol. 20, Issue 8, 2006, p. 1967-1991.
-
Ocak H., Loparo K. A. Estimation of the running speed and bearing defect frequencies of an induction motor from vibration data. Mechanical Systems and Signal Processing, Vol. 18, Issue 3, 2004, p. 515-533.
-
Kim H., Melhem H. Fourier and wavelet analyses for fatigue assessment of concrete beams. Experimental Mechanics, Vol. 43, Issue 2, 2003, p. 131-140.
-
Benesty J., Chen J. D., Huang Y. T., et al. Pearson correlation coefficient. Noise Reduction in Speech Processing, Vol. 2, 2009, p. 1-4.
About this article

The research was supported by the National Natural Science Foundation of China (51275513), Fundamental Research Funds for the Central Universities (2012LWB33) and Priority Academic Program Development of Jiangsu Higher Education Institutions (PAPD).
