Abstract
Z-source converter as a kind of power converter will be responsible for the energy transmission and load switching and other important functions, the paper focuses on the nonlinear characteristic analysis of Z-source DC/DC converter, in the continuous conduction mode (CCM), take the Z-source converter with peak current control as the research object, establish stroboscopic mapping model for analyzing its bifurcation and chaos characteristic based on system accurate modeling. According to numerical simulation and analysis, estimate parameter range in which Z-source occur bifurcation and chaos under different design. Considering the change of reference current, input voltage and load impedance, the experiment results prove that Z-source converter stroboscopic mapping model is correct for analyzing its nonlinear behavior, which provides a theoretical basis for optimal design and control.
1. Introduction
The converter is the core of the modern power electronic system, whose operational state directly relates to the whole system performance. Thanks to the devices nonlinear and switching function, the converter using feedback control demonstrates strong non-linear and time-varying. The nonlinear phenomenon such as bifurcation and chaos may be produced during the operating process. In the 90s last century, the researchers at home and abroad have began to analyze converter nonlinear behavior and develop control method [1-5].
Z-source converter as the power converter topology has a single stage topology which can operate in both buck and boost modes; it has the following merits [6-8]: adjusting voltage in large range, high reliability, improving system’s converting efficiency, flexibility et al. Thus, the Z-source structure inverter is especially suit for the situation of output change greatly such as photovoltaic generation [7], Z-source as power conditioning system can output favorable AC voltage and widely used in different fields [8-9]. When Z-source is applied in power converting system, it will reveal the strange and irregular phenomenon during the operation process such as the sudden collapse of the critical operating state, the unknown electromagnetic noise, the system unstable to run and unable work according to the actual needs etc. This is the external manifestation of converter inherent nonlinearity, bifurcation and chaos [12]. The converter working in the chaos state will cause the system to run unpredicted and uncontrolled due to its uncertainty, thus its performance is influenced seriously, and even completely unable work. However, at present the Z-source converter nonlinearity research has not been reported at home and abroad [1-11], so the further research will play important role on improving system operation performance.
Aiming at the nonlinear characteristic, the author mainly researches on the nonlinearity of Z-source DC/DC converter. In the CCM mode, take the converter with peak current control as the research object, establish stroboscopic mapping model for analyzing its bifurcation and chaos characteristic based on system accurate modeling. According to numerical simulation and analysis, estimate parameter range in which Z-source occur bifurcation and chaos under different design.
2. Z-source converter principle
The schematic diagram of Z-source converter with peak-current control mode is shown in Fig. 1, the basic principle as following: the clock signal control the switch, it sets the R-S trigger at regular intervals, when , the switch is turned on at the beginning of the cycle and the switch current increases, as approaches the value of , comparator’s output signal overturn and make R-S trigger reset, , the switch is turned off until the next cycle begins. In this paper, we use the peak current control method to control the Z-source DC/DC converter because it is stable, simple, response rapidly, and can limit the circuit peak current to protect the devices.
Fig. 1Schematic diagram of Z-source converter in peak-current control mode
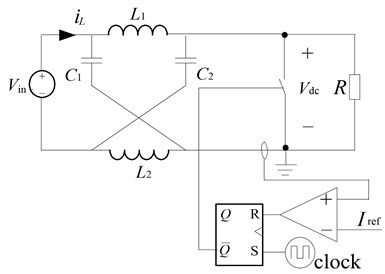
For analyzing easily, assuming that the inductors and and capacitors and have the same inductance and capacitance respectively, the Z-source network becomes symmetrical. Assuming shoot-through zero vector duty cycle is in a switch period, so from literature [8] we obtain the following relationship (1)-(3):
Adjusting can make output voltage/current higher or lower than input side.
3. Z-source DC/DC converter modeling and analyses in peak current control mode
3.1. Modeling of Z-source DC/DC converter
In the Z-source converter, when it works in shoot-through voltage vector state, the inverter can be equivalent to short circuit, as Fig. 2(a) shows; when it works in non-shoot-through voltage vector state, the inverter can be equivalent to a current source[9], as Fig. 2(b) shows, is the clock cycle, the two operating modes as following:
Mode one: (shoot-through state)
Mode two: (non-shoot-through state)
According to (4) and (5), we have the state equation of circuit as follows:
where represents state variable, , , , , .
Fig. 2Equivalent circuit of Z-source DC/DC converter: a) equivalent circuit of inverter, when shoot-through state, b) equivalent circuit of inverter, when non-shoot-through state
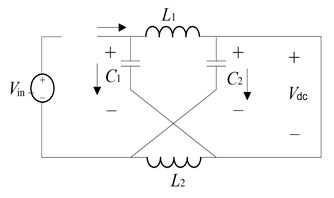
a)
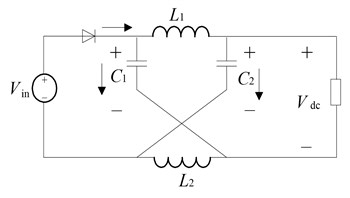
b)
3.2. Stroboscopic mapping model
Assuming is the duty cycle of the th period, , , the other discrete parameters’ definition and so on, the system state equation as (6) and (7) show, we have discrete model of the th period, which can be expressed as following:
where , , .
As a result, simplifying the integral term of the two formulas above, we have:
Substituting (11) into (12) and we obtain the discrete mapping equation:
The converter switches from on state to off state based on the value of the switching function, it is given by:
where , then when , the converter state changes.
4. Jacobian matrix method analyze system stability
Because of the change of system circuit parameter and influence of environment disturbance, the system can operate from former stable mode into instable mode. The Jacobian matrix method as an analytical method has been widely used for researching local bifurcation issue of nonlinear dynamic system. Firstly, set the Jacobian matrix at fixed point.
Supposed the controllable system is steadied at single-cycle state, and that the input voltage and reference voltage keep steady, set , , take and as single cycle solution of the steady-state. Adopting small-signal linearization perturbation to process the equation (8):
According to , it is available:
Thus comes to:
Substituting (17) into equation (15), we have:
In that way, the corresponding Jacobian matrix is:
where:
may be recorded as the eigenvalue of , according to the system stability, when located in unit circle, system is stable. Because the Jacobian matrix here is the ratio which is the quotient of latter iterative small perturbation item and the former, if the ratio is greater than 1, it is indicated that with the increase of iterative number, the amount of disturbance gradually increases, namely the system is unstable; if the ratio is less than 1, then system is in stable. Thus, the system may be unstable when the reference current varies.
Before calculate the eigenvalue of Jacobian matrix, firstly, obtain the steady-state periodic solutions and of the Z-source converter system’s discrete mapping equation. The equilibrium point is the single cycle steady-state solution, whose calculation process as following:
Set according to equation (11) and equation (12), it is available:
According to the two equations above, we obtain the solution:
At the same time, the switch function meets:
Simultaneous equations from (22) to (24), using the numerical calculation to get the steady-state periodic solutions and , then solve the eigenvalue of Jacobian matrix according to the steady-state periodic solution, thereby judge the system stability.
5. Numerical simulation and experimental result analysis
According to Fig. 2, given the circuit parameters as following:
switching frequency is 20 kHz, the inductive current reference value varies from 1 A to 30 A. When given , using numerical computation to solve steady-state periodic solution:
Here, the Jacobian matrix is:
whose eigenvalues , .
Because of and the system is stable when here this moment, the system is in single cycle steady-state. When , the change of maximum modulus eigenvalue of Jacobian matrix as Fig. 3 shows, and respectively changes on the real axis, and changes more quickly than according to Table 1, when equal to the value between 3.4 and 3.6, the will greater than 1, then lead to the system unstable.
When varies in the range of 1~30, the inductive current and capacitor voltage of Z-source networks is shown in Fig. 4. It is evident from the Fig. 4(a) and Table 1, when , the system is in stable operation (one cycle) and the corresponding duty factor ; for the reference current further increase in reference current to 3.5 A, the system bifurcates and exhibits period II operation, here, the system exhibits stable 2 period operation, till the reference current is increased to 6.1 A. After this, the system enters into stable 4 period operation; when the system operates in I period again, till the reference current increases beyond 9.3 A, the system begins to new bifurcation till chaos.
Fig. 3Eigenvalues trajectory of Jacobian matrix when Iref magnify
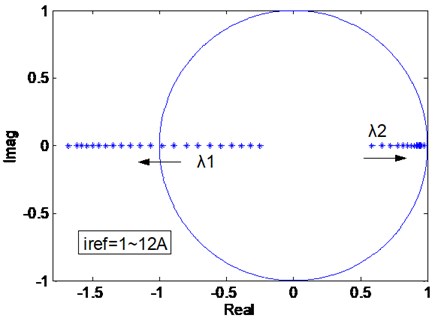
Fig. 4Bifurcation diagram of Z-source network when Iref changes: a) bifurcation diagram of inductive current, b) bifurcation diagram of capacitor voltage
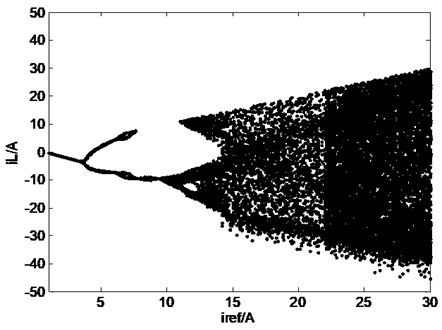
a)
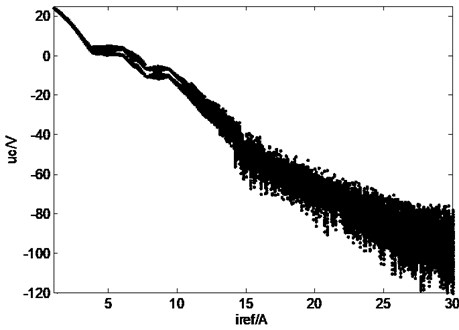
b)
Table 1Eigenvalues trajectory table of Jacobian matrix when Iref changes
1.0 | 0.1381 | -0.2533 | 0.5817 | 3.2 | 0.4512 | 0.8750 | 0.9106 |
1.2 | 0.1661 | 0.2935 | 0.6289 | 3.4 | 0.4678 | 0.9288 | 0.9178 |
1.4 | 0.1939 | 0.3342 | 0.6714 | 3.6 | 0.4969 | 1.0329 | 0.9286 |
1.6 | 0.2212 | 0.3757 | 0.7097 | 3.8 | 0.5096 | 1.0824 | 0.9325 |
1.8 | 0.2480 | 0.4185 | 0.7440 | … | … | … | … |
2.0 | 0.2999 | 0.5093 | 0.8015 | 10 | 0.6011 | 1.5412 | 0.9497 |
2.2 | 0.3247 | 0.5574 | 0.8252 | … | … | … | … |
2.4 | 0.3486 | 0.6074 | 0.8458 | 20 | 0.6618 | 1.9900 | 0.9526 |
2.6 | 0.3716 | 0.6590 | 0.8635 | … | … | … | … |
2.8 | 0.4140 | 0.7660 | 0.8912 | 30 | 0.8270 | 4.8097 | 0.9528 |
3.0 | 0.4333 | 0.8205 | 0.9018 |
The capacitor voltage also indicates its nonlinear characteristic with varies as shown in Fig. 4(b), when , the system is in stable operation (one cycle), when the reference increase from 1.1 A to 3.7 A, the system bifurcates and exhibits period II operation, when the reference varies in the range from 3.7 A to 9.4 A, the system operates in quasi-II period, when the reference current is increased beyond 9.4 A, the system enters into chaos state.
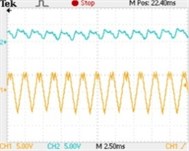
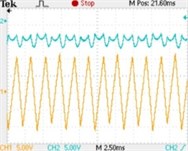
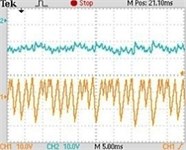
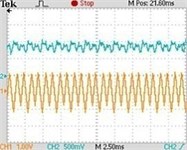
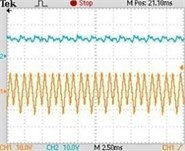
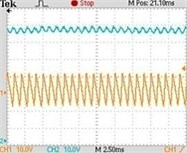
The Fig. 5 shows the typical experimental waveforms of Z-source network. Seen from the Fig. 5(a), when , the system is in stable operation (one period); with the reference current increasing to 5 A, the inductive current bifurcates and indicates 2 period, but the capacitor voltage is irregular, whose change is out of synchronous with the inductive current, its typical waveforms is shown in Fig. 5(b); when , the inductive current varies from 2 period to stable 4 period, till the reference current is increased beyond 30 A, the system enters into chaos state. (Channel 1 represents inductive current and channel 2 represents capacitor voltage ).
Fig. 5Typical experimental waveforms of Z-source network when iref changes: a) iref=1 A (single period), b) iref=5 A (2 period), c) iref=8 A (4 period), d) iref=15 A (chaos state)
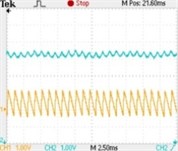
a)
b)
c)
d)
Assuming the given parameter as follows:
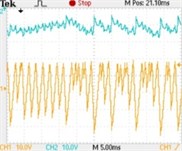
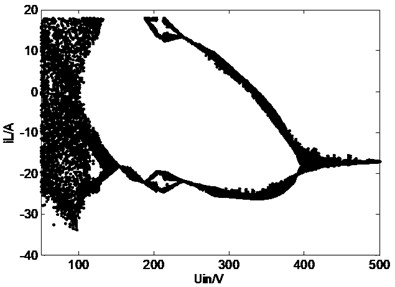
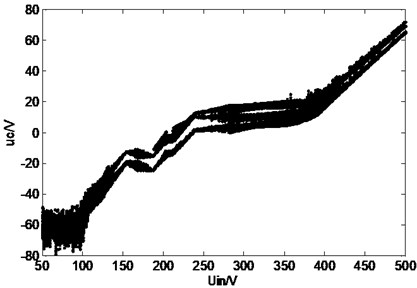
switching frequency is 20 kHz, when the input voltage varies from 50 V to 500 V, the inductive current and capacitor voltage of Z-source networks’ bifurcation diagram is shown in Fig. 6. The Fig. 7(a)~(d) show the different typical waveforms from period to chaos. (Channel 1 represents inductive current and channel 2 represents capacitor voltage ).
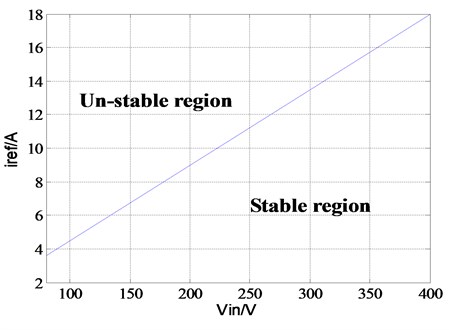
Jacobian matrix method as an analytical method can accurately calculate the location of bifurcation points. In practical application, the Jacobian matrix method is used for locating the bifurcation point, and as a guide for the parameter design in order to ensure that the system works in the stable region. According to the location of bifurcation points, further discuss the influence of circuit parameters on the stability of the quiesent work points. According to the actual situation of photovoltaic power generation system, to select the input voltage and the grid-connected current reference as the basis for analyzing the system stable domain when both changing. Fig. 8 shows the stability boundary curve of the system quiesent work points.
Seen from the Fig. 8, the region below the curve is stable, with the input voltage increase, the quiesent point stable range of grid-reference current increases gradually. Therefore, in the design one is to try to ensure the system work in the stable region.
Fig. 6Bifurcation diagram of Z-source network when input voltage changes: a) bifurcation diagram of inductive current, b) bifurcation diagram of capacitor voltage
a)
b)
Fig. 7Typical experimental waveforms of Z-source network when Vin changes: a) Vin=50 V (chaos state), b) Vin=200 V (2 period), c) Vin=250 V (4 period), d) Vin=500 V (1 period)
a)
b)
c)
d)
Fig. 8Stable region boundary with parameters change
6. Conclusions
In this paper, the stroboscopic mapping method is used for analyzing nonlinear behavior of Z-source DC/DC converter. In CCM, take the Z-source DC/DC converter with peak current control as the research object, establish stroboscopic mapping model for analyzing its bifurcation and chaos characteristic based on accurate system modeling. According to numerical simulation and analysis, estimate parameter range in which Z-source DC/DC converter occur bifurcation and chaos under different design.Considering the change of reference current, input voltage and load impedance, the experiment result proves that Z-source DC/DC converter stroboscopic mapping model is correct for analyzing its nonlinear behavior, which provides a theoretical basis for optimal design and control.
References
-
Banerjee S., Verghese G. Nonlinear Phenomena in Power Electronics: Attractors, Bifurcations, Chaos, and Nonlinear Control. New York: IEEE Press, 2001.
-
Zhang B., Qu Y. Study on the experiment and the precise discrete model of bifurcation and chaos for BUCK DC/DC converter. Proceedings of the CSEE, Vol. 23, Issue 12, 2003, p. 99-103.
-
Ma X. K., Li M., Dai D., et al. Reviews of research on complex behavior of power electronic circuits and systems. Transactions of China Electrotechnical Society, Vol. 21, Issue 12, 2006, p. 1-11.
-
Zhang B. Study of nonlinear chaotic phenomena of power converters and their applications. Transactions of China Electrotechnical Society, Vol. 20, Issue 12, 2005, p. 1-6.
-
Zhang B. Discussion on several fundamental problems necessary to be solved in power electronics. Transactions of China Electrotechnical Society, Vol. 21, Issue 3, 2006, p. 24-35.
-
Peng F. Z. Z-source inverter. IEEE Transactions on Industry Applications, Vol. 39, Issue 2, 2003, p. 504-510.
-
Huang Y., Shen M. S., Peng F. Z., et al. Z-source inverter for residential photovoltaic system. IEEE Transactions on Power Electronics, Vol. 21, Issue 6, 2006, p. 1776-1782.
-
Shen M. S., Joseph A., Wang J., et al. Comparison of traditional inverters and Z-source inverter for fuel cell vehicle. 8th IEEE Workshop on Power Electronics in Transportation, USA, 2004.
-
Peng F. Z., Yuan X. M., Fang X. P., et al. Z-source inverter for adjustable speed drives. IEEE Power Electronics Letters, Vol. 1, Issue 2, 2003, p. 33-35.
-
Gajanayake C. J., Vilathgamuwa D. M., Poh C. L. Small-signal and signal-flow-graph modeling of switched Z-source impedance network. IEEE Power Electronics Letters, Vol. 3, Issue 3, 2005, p. 111-116.
-
Gajanayake C. J., Vilathgamuwa D. M., Poh C. L. Modeling and design of multi-loop closed loop controller for Z-source inverter for distributed generation. IEEE Power Electronics Specialists Conference, South Korea, 2006.
-
Belkhayat M., Cooley R., Abed E. H. Stability and dynamics of power systems with regulated converters. Proc. IEEE Int. Symp.Circuits Systems, Seattle, WA, 1995.
-
Chen Y. F., Chi K. T., Qiu S. S. Coexisting fast-scale and slow-scale instability in current-mode controlled DC/DC converters: analysis, simulation and experimental results. IEEE Transacctions on Circuits and Systems – I, Vol. 55, Issue 10, 2008, p. 3335-3348.
-
Wang X. M., Zhang B. Study of bifurcation and chaos in single-phase SPWM inverter. Transactions of China Electrotechnical Society, Vol. 24, Issue 1, 2009, p. 101-107.
About this article

This study is supported by the Basic and Frontier Research Program of Chongqing Municipality (cstc2013jcyjA0531) and the Science & Technology Special Foundation of Banan District of Chongqing (2012Q120).
