Abstract
The paper presents an assessment of the technical condition of the vehicle shock absorbers built into the vehicle on the basis of the signals recorded during the vibration test. The test was performed on a test stand with kinematic harmonic forcing. The test stand can enforce vibrations in the range of 0-21 Hz and amplitude of 6 mm. The shock absorbers with indicated technical condition were built into the vehicle (the new shock absorber and the one with oil leak). The research was conducted on the twin-tube hydraulic shock with a modified structure that allows to change the amount of the fluid. The study was conducted for the front suspension shock absorber of passenger car with an independent McPherson front suspension. Acceleration was measured using capacitive sensors of accelerations type ADXL. Acceleration was recorded on test stand platform and near the axis of the wheel and on the upper point of attachment of the McPherson strut. Registered acceleration diagrams were subject to further treatment consisting of filtration and analysis. The results were compared for selected technical states.
1. Introduction
Taking into consideration the isolation vibration from road roughness, the vehicle can be divided in two masses, sprung mass (body) and unsprung mass (wheel with tire and partially suspension).
These masses are connected by suspension parts: connectors, damping elements (shock absorber) and spring elements (coil spring) [1, 2]. In the design of automotive suspension, the characteristic of these elements represents a compromise between driving safety and ride comfort. Parameters of those elements have nonlinear characteristics which determine system response as vehicle vibrations from road roughness. Currently produced passive shock absorbers has nonlinear and nonsymmetrical characteristics of damping (asymmetric damping characteristics in compression and rebound are used in order to achieve a better compromise between ride, road-holding, handling and control performance of the vehicle – the dampers provide significantly higher damping force in rebound).
Regarding to many researches, it can be assumed that tire parameters (stiffness and damping) have less influence on vehicle vibrations [3]. So as the most important parameters of vibration isolation the spring and damping characteristics have been declared. The suspension damper modulates the energy dissipation, ensuring any induced oscillation disappearing quickly. It is particularly important to control the technical condition of shock absorber while using modern systems like ABS, ESP, etc. because it directly affects on braking distance.
Common test of shock absorbers methods for vehicle inspection stations based on Boge and Eusama are constantly being developed. Both methods are based on the amplitude depending on the resonance of the damping system. Currently used Boge test stands allow you to determine the coefficient of adhesion in percent. In Eusama plus method also were introduced improvements such as warm-up phase and the precise measurement for a specific frequency range (10-18 Hz). Next modifications were also using the phase angle measurement. There are many researches on application of vibroacoustics signals for modeling, monitoring and diagnosing of machines [4-11, 16, 17].
One of the most important group of machines are means of transport, where the proper analysis of many physical phenomena have to be taken into consideration [12-15]. Nowadays the material properties and production and reparation technologies are very important and have to be taken into consideration [18-21].
2. Test stand and measurement system
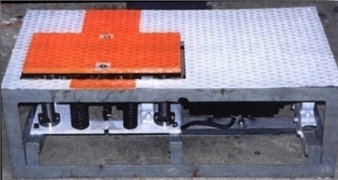
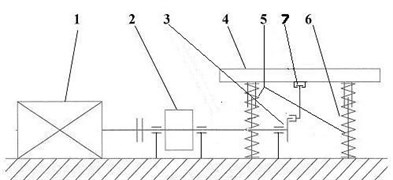
The research on shock absorber built in vehicle was conducted on laboratory test stand (Fig. 1) with vibration excitation. The excitation test stand allows to force vibration with continuous of frequency regulation in 0-21 Hz range, controlled by inverter.
Fig. 1View and scheme of laboratory test stand where: 1. electric engine, 2. rotated mass, 3. crankshaft system, 4. moving platform, 5. hold down springs, 6. vertical slideway, 7. mount of platform
a)
b)
Force excitation process consisted of three phases: increase of frequency, vibration with constant frequency and decrease of frequency. While measuring there were recorded the accelerations of platform, sprung and unsprung mass .The signals were recorded in digital form with 2000 Hz sampling frequency. The scheme of measurement system has been depicted in Fig. 2.
Fig. 2Scheme of measurement system
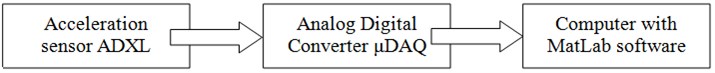
The acceleration of vibration were measured by ADXL 204 and ADXL 321 sensors. Those are modern parametric sensors built in chip. Table 1 shows the parameters of those sensors. For the data acquisition the analog-digital card was used. The μDAQ 30 adapted for use with PC computers support the USB interface. The main technical parameters of the μDAQ 30 are 14-bit resolution, max 250 kHz sampling.
Table 1Parameters of ADXL 204 and ADXL 321 sensors
ADXL 204 | ADXL 321 | |
Measurement range | ±1,7 g | ±18 g |
Nonlinearity | 0,2 % FS | 0,2 % FS |
Sensitivity (typical) | 620 mV/g | 57 mV/g |
Frequency band | 2,5 kHz | 2,5 kHz |
Resonant frequency of sensor | 5,5 kHz | 5,5 kHz |
Temperature range (powered) | –55 … 125°C | –20 … 70°C |
Power supply | 3-6 V | 3-6 V |
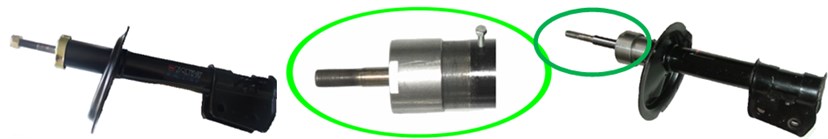
The vibration tests were conducted on passenger car. In the vehicle the front shock absorber with simulated fault (oil leak – the volume of oil was changed in the range 100 % – full oil to 0 % – empty with 20 % step) was built in. The construction of this shock absorber was modified in order to make oil volume variable (Fig. 3) – original closure was replaced with threaded nut to make possible disassembly of the shock absorber, and an hole in the tube allows changing the volume of oil in shock absorber.
Fig. 3Typical front shock absorber (left) and after modification (right)
3. Simulation research
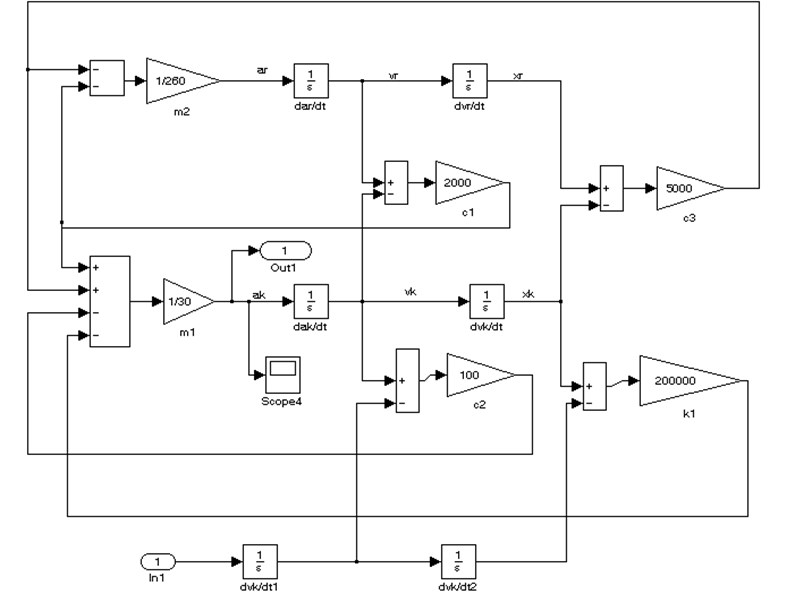
The next step of research was simulation test. The scope of simulation research was analysis of the influence of changeable damping coefficient on phase angle and magnitude. There was used the simple quarter car model with linear spring and damping characteristics created in Matlab/Simulink software (Fig. 3) [14, 15]. The Simulink model was converted on state-space model representations and for this model was made phase and magnitude diagram. Input and output in model were taken analogously as in the real object research: acceleration of test stand platform and wheel (SISO-single input single output model). The Figure 4 presents the influence of damping on magnitude and phase angle (the value of parameter was changing: 100 Ns/m, 1000 Ns/m and 2000 Ns/m) made in LTI Viewer.
Fig. 4Quarter car suspension model with linear spring and damping characteristics (Matlab/Simulink)
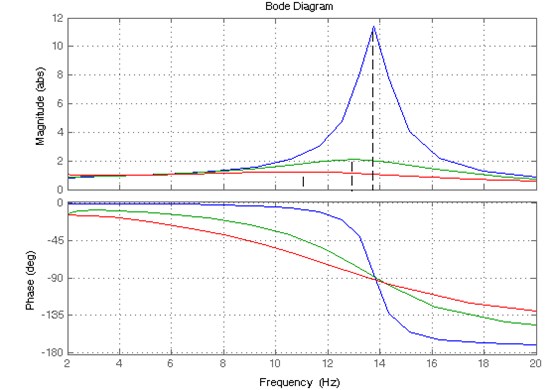
The results of model with small damping (blue line 100 Ns/m) allows to localize visible peak for resonance frequency of unsprung mass. The results of model with higher damping coefficient (values used in car design) shows that peak for resonance frequency of unsprung mass is lower and the vibration are stronger damped (green line 1000 Ns/m and red line 2000 Ns/m) (Fig. 5).
Fig. 5The influence of damping (c1) on magnitude and phase (blue line – 100 Ns/m, green line – 1000 Ns/m and red line – 2000 Ns/m)
4. Methodology of signal processing
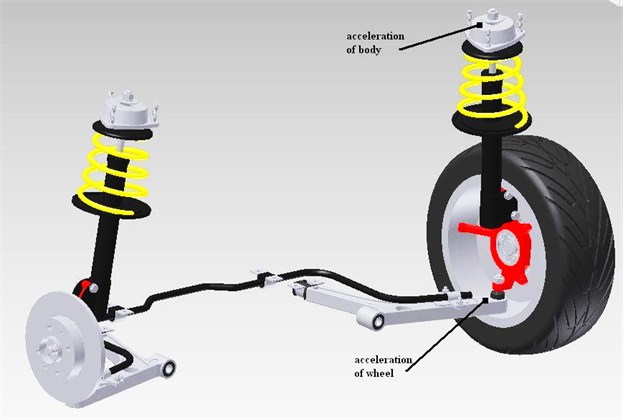
There were analyzed the recorded acceleration of vibration in chosen measure points: vertical accelerations of body, vertical accelerations of wheel and vertical accelerations of test stand platform. View of mounted accelerometers is presented on Fig. 6.
Fig. 6View of mounted accelerometers
During the experiment the vibration excitation was divided into 3 stages (increase of frequency, constant frequency and decrease frequency). The time realization of vibration acceleration of wheel for full and empty shock absorber was presented in Fig. 7 and 8.
For shock absorber with full oil maximum acceleration vibration of wheel are ca. 40 m/s2 and peak for resonance frequency of unsprung mass is almost invisible.
Fig. 7Time realization of vertical acceleration of vibration of wheel – full oil shock absorber (100 %)
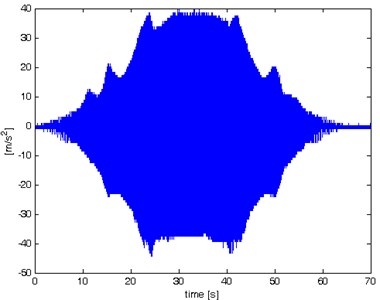
Fig. 8Time realization of vertical acceleration of vibration of wheel – empty shock absorber – 0 %
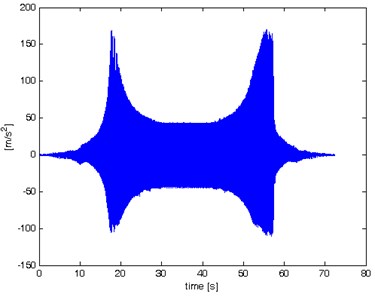
For empty shock absorber maximum acceleration of vibration of wheel are above 150 m/s2 in peak for resonance frequency of unsprung mass.
The signals of vibration acceleration recorded on real object are noisy. Therefore the signals have been flirted by zero phase filter in Matlab software. This filter doesn’t allow for phase changing in filtering signals. Those properties are very important during phase angle analysis. It is “off-line” filter, so it must be used after recording signals. The short part time signal of acceleration before and after filtering have been presented in Fig. 9. For low frequency the amplitude of acceleration is very difficult to filter (for used measurement system) so only the frequency in range 10 Hz to 21 Hz was analysed. For this reason also the body accelerations wasn’t analyzed.
The sampling frequency was set on 2000 Hz. This frequency is enough to keep Nyquist frequency for analyzing signals. For signals after filtering the interpolation (level 10) was made. It was done for concentration of sample numbers in place of sign changing and intensification precision of determining single oscillations frequency (Fig. 10).
Fig. 9Acceleration of vibration before and after filtering
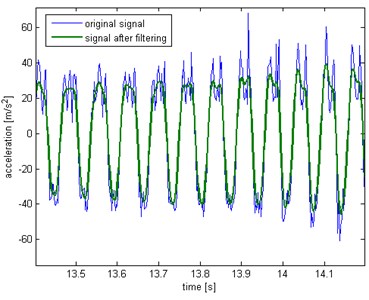
Fig. 10The vibration signals of excitation test stand and wheel, after filtering and interpolation with points of sign changes and maximums
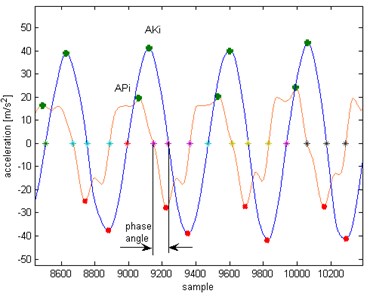
The signal was divided into half periods. In every indexing period () there was determined maximum value of accelerations for signals (wheel AKi, platform APi), period of time (and frequency of oscillation) and phase angle () relative to excitation.
5. Analysis of results
For analysis of research results on the influence of different damping coefficient on magnitude and phase angle the methodology described above were used. The results have been presented in Fig. 11 and 12. The values given in the legend on right corner on Figure 10 and 11 correspond to filling of shock absorber. The phase angle was determined relative to excitation (the oscillation period of platform). The nondimensional magnitude is result of divided maximum value of wheel accelerations to platform accelerations in each period.
The results shows that changes of phase angle from the shock absorber filling are significant after crossing the 50 % of oil filling. For 0-40 % phase angle change in resonant frequency is steep like in model without damping. For 60-100 % phase angle changes are mild.
Fig. 11Phase angle diagram
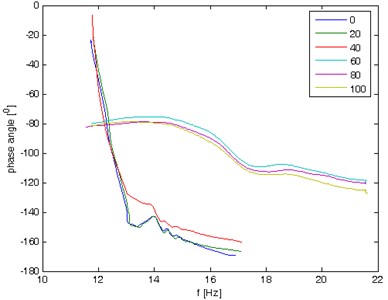
Fig. 12Magnitude diagram
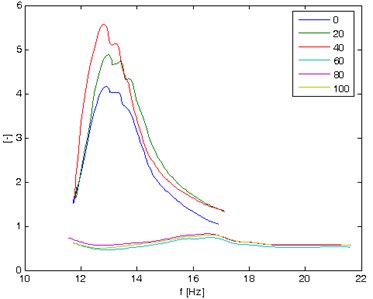
Changes resulting from the shock absorber filling are significant after crossing the 50 %. For 0-40 % is visible peak for resonance frequency of unsprung mass. The amplitude of wheel acceleration in resonance is a few times higher than the amplitude of platform acceleration.
6. Conclusions
The results of the research shows that change of oil leak in shock absorber causes increase of wheel accelerations amplitude and changes of phase angle. The results of phase angle and magnitude are correspondent to results of simulation researches presented on Fig. 5 (results for model with small damping are similar to results of research for 0÷40 % filling, and results for model with higher damping are similar to results of research for 60÷100 % filling). It is very important especially when phase angle is analyzed by the means of used kind of filter. Since the phase characteristics of the filters introduce phase angle changes in filtered signal. In this research signals have been flirted by zero phase filter. In signals recorded on real object there are many analysing problems. The signals of acceleration are noisy and for low frequency the amplitude of acceleration is very difficult to filter. Further research will be aimed at solving these problems.
References
-
Dixon J. C. The Shock Absorber Handbook Society of Automotive Engineers Inc. Warrendale, PA, 1999.
-
Soedel W. Vibrations of Shells and Plates. Second Edition, Marcel Dekker Inc., New York, 1993.
-
Burdzik R., Konieczny Ł. Diagnosing of shock absorbers of car vehicles at changeable pressure in tires. Diagnostyka, Vol. 3, Issue 51, 2009, p. 27-32.
-
Burdzik R. Material vibration propagation in floor pan. Archives of Materials Science and Engineering, Vol. 59, Issue 1, 2013, p. 22-27.
-
Burdzik R. Monitoring system of vibration propagation in vehicles and method of analysing vibration modes. J. Mikulski (ed.): TST 2012, CCIS 329, Springer, Heidelberg, 2012, p. 406-413.
-
Ragulskis K., Kanapeckas K., Jonušas R., Juzėnas K. Applications of torsional vibrations for vibro-driling operations. Mechanika, Vol. 17, Issue 5, 2011, p. 498-502.
-
Bogorosh A., Voronov S., Roizman V., Bubulis A., Vyšniauskiene Ž. Defect diagnostics in devices via acoustic emission. Journal of Vibroengineering, Vol. 11, 2009, p. 676-683.
-
Michalski R., Wierzbicki S. An analysis of degradation of vehicles in operation. Maintenance and Reliability, Vol. 1, Issue 3, 2008, p. 30-32.
-
Tuma J. Gearbox noise and vibration prediction and control. International Journal of Acoustics and Vibration, Vol. 14, Issue 2, 2009, p. 99-108.
-
Grządziela A. Analysis of vibration parameters of ship gas turbine engines. Polish Maritime Research Vol. 2, 2006, p. 22-26.
-
Dąbrowski Z., Deuszkiewicz P. Designing of high-speed machine shafts of carbon composites with highly nonlinear characteristics. Key Engineering Materials, Vol. 490, 2011, p. 76-82.
-
Grzeczka G. The analysis of possibility of using electromagnetic drive for autonomous biomimetic underwater vehicle. Solid State Phenomena, Vol. 196, 2013, p. 82-87.
-
Doleček R., Novak J., Cerny O. Research of conductive currents in traction drive with PMSM. Cybernetic Letters, Vol. 1, Issue 1, 2012.
-
Mencik J. Low-load nanoindentation: Influence of surface forces and adhesion. Chemicke Listy 106, 2012, p. 481-484.
-
Kaźmierczak-Bałata A., Bodzenta J., Trefon-Radziejewska D. Determination of thermal-diffusivity dependence on temperature of transparent samples by thermal wave method. International Journal of Thermophysics, Vol. 31, Issue 1, 2010, p. 180-186.
-
Konieczny Ł., Gardulski J. Application of simulation researches in diagnostic's of vehicle hydropneumatic suspension. Transport Problems, Vol. 2, Issue 1, 2007, p. 13-21.
-
Konieczny Ł., Burdzik R., Łazarz B. Analysis of properties of automotive vehicle suspension arm depending on different materials used in the MSC.Adams environment. Archives of Materials Science and Engineering, Vol. 58, Issue 2, 2012, p. 171-176.
-
Oleksiak B., Blacha-Grzechnik A., Siwiec G. Application of the flotation process in the silver recovery from the wastes generated during the silvery semi-products manufacturing. Metalurgija, Vol. 51, Issue 3, 2012, p. 298-300.
-
Węgrzyn T., Piwnik J., Wieszała R., Hadryś D. Control over the steel welding structure parameters by micro-jet cooling. Archives of Materials and Metallurgy, Vol. 57, Issue 3, 2012, p. 679-685.
-
Kusiński J., Kac S., Kopia A., Radziszewska A., Rozmus-Górnikowska M., Major B., Major L., Marczak J., Lisiecki A. Laser modification of the materials surface layer – a review paper. Bull. Pol. Acad. Sci., Tech. Sci., Vol. 60, Issue 4, 2012, p. 711-728.
-
Blacha L., Burdzik R., Smalcerz A., Matuła T. Effects of pressure on the kinetics of manganese evaporation from the Ot4 Alloy. Archives of Metallurgy and Materials, Vol. 58, Issue 1, 2013, p. 197-201.
About this article

