Abstract
Pressure fluctuation, which impacts on operating security, is the common phenomenon in the pump. In order to study pressure fluctuation phenomenon in the pump, TJ04-ZL-02 axial flow pump model is investigated under different operating conditions by experiment and unsteady calculation based on turbulence model. Numerical results show that the basic frequency amplitude of monitoring points in four sections under small operating condition are larger than that under design operating condition and large operating condition. And there are more random frequency components in each monitoring point, which are low frequency components. Experimental results show that compared with different operating conditions the basic frequency amplitude under design operation condition is not smallest. Under small operating condition the basic frequency amplitude is larger than that under large operating condition. Therefore, running under small operating condition will be easy to cause resonance. Based on this study, it’s recommended that avoiding small operating condition should contribute to improving operational stability.
1. Introduction
When the pump is running, rotating impeller and stationary guide vane interference each other, namely rotator-stator interaction (RSI) [1-3]. Due to the viscosity of fluid, the flow field in the pump appears unstable state, which causes the pressure fluctuation of the flow field in the pump. Pressure fluctuation not only arouses the water noise, but also causes the alternating load on the impeller blades. Alternating load often leads to the vibration. Therefore, to study the pressure fluctuation has a significance to improve the operational stability of pump.
Scholars domestic and overseas have extensively studied pressure fluctuation in the pump [4-8]. Jaeger [9] et al. made unsteady simulations on whole flow passage, and get rotor/stator flowing message and draft tube vortex structure. Wang Fujun [10] et al. predicted pressure fluctuation under different operating conditions based on LES, and found the pressure fluctuation change law with different operating conditions. In experiment study, with constantly updated equipment, internal pressure fluctuation studies for turbomachinery have obtained good results. Iino and Kasai [11] measured centrifugal pump pressure fluctuation and found impeller and guide vane angle is main reason causing the fluctuation, and summarized the basic frequency within the pump. Arndt et al. [12-13] measured 2D centrifugal pump pressure fluctuation and found that maximal fluctuation emerged in the guide vane outlet. And its magnitude was closely related with the number of guide vane and guide vane angles. Through the preliminary study, it was found that the operating condition has a crucial impact on its operational stability.
However, scholars in the past only use separately numerical calculation or experimental method to study the pressure fluctuation in the pump. So far, few papers that combine numerical calculation and the experimental method have been published. Moreover, scholars in the past only care for the pressure fluctuation between the rotor and stator, and monitors are only located in the section between rotor and stator. In this paper, under the premise of experimental verification on the numerical simulation accuracy, pressure fluctuation in TJ04-ZL-02 axial flow pump was studied under different operating conditions by using numerical and experimental methods. Monitors located in different location of not only the section between rotor and stator, but also impeller inlet section, guide vane section. Provide information for clarification the pressure fluctuation characteristics under different operating conditions, and a basis to further control the axial flow pump’s pressure fluctuation.
2. Physical model and numerical calculation method
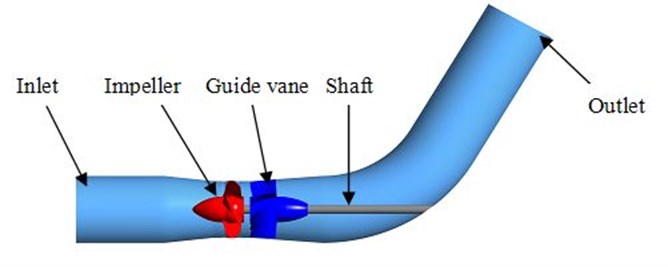
In this paper, an axial flow pump model with specific speed 700 is shown in Fig. 1. It is mainly composed of impeller, guide vane and shaft. Its design parameters are as follows: design flow rate 367.5 L/s, Head 3.2 m, rotation speed 1450 r/min, impeller section sphere diameter 300 mm, impeller diameter 299 mm, tip gap = 0.5 mm, impeller blade number is 4, and guide vane number is 7.
Fig. 1Axial-pump fluid domain
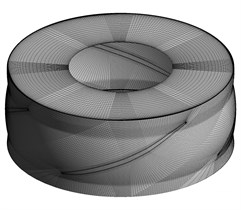
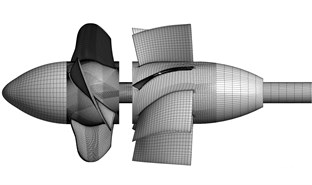
All calculation domains are discrete by structural mesh as shown in Fig. 2. J type topology structure is applied to impeller, and H topology structure is applied to diffuser. O-grid is applied to blade surface region in order to control boundary layer distribution. Mesh refinement is applied to impeller with 20 nodes in tip clearance.
Fig. 2Computational mesh of model pump
a) Impeller domain mesh
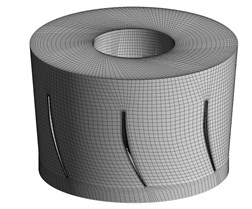
b) Guide vane domain mesh
c) Overall mesh
Based on ANSYS CFX 13.0 software platform, standard turbulent model is used. Mass flow inlet and opening outlet are respectively selected as boundary condition. Steady calculation results are used as the initial condition of the unsteady calculation. And other settings have been shown in Table 1.
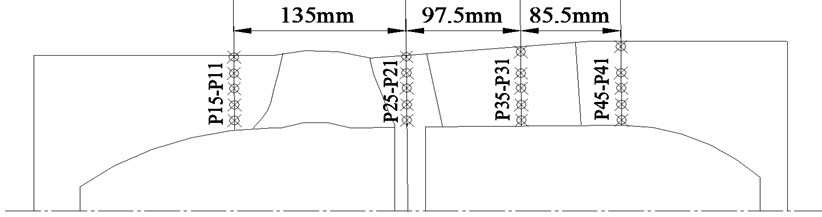
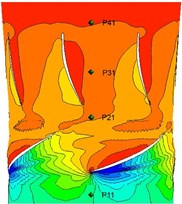
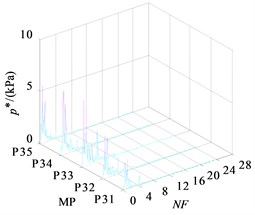
Monitoring points are located in calculating domain on cross section of impeller inlet and outlet guide vane middle part and outlet. Monitoring points P11-P15, P21-P25, P31-P35, P41-P45 are shown in Fig. 3.
Table 1Numerical simulation settings
Main condition | Setting |
Assumption | Incompressible |
Governing equation | RANS |
Inlet | Inlet |
Outlet | Opening |
Wall | No slip |
Near wall region | Standard Wall Function |
Fig. 3Monitoring points’ location
3. Pressure fluctuation analysis of numerical calculation
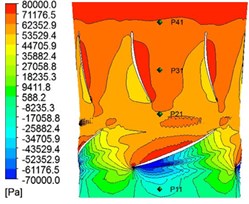
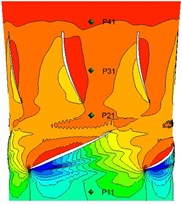
Three operating condition, , and are studied in Rotor/Stator interaction analysis. The time domain figures of static pressure in monitor P21 during a period (0.04138 s) under three operating condition. According to its feature, pressure contours of stream surface containing P21 at a series of typical moment like I, II, III, IV in Fig. 4, which is the pressure contour of inner flow in . The green points in the figures stand for monitor P11, P21, P31 and P41.
Fig. 4Time-domain plot and typical moment static pressure distribution of 1.0Qopt
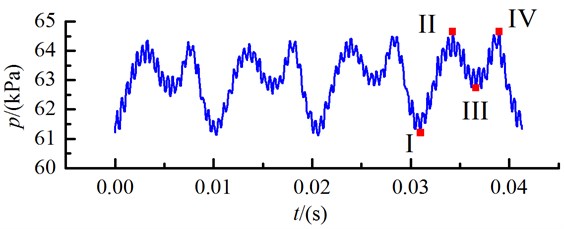
a) Time-domain plot
b) I
c) II
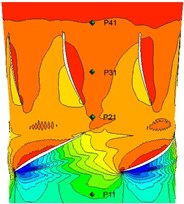
d) III
e) IV
It can be found that there are two peaks and troughs in a quarter of in Fig. 4(a). At I moment, pressure is the lowest. High pressure region haven’t affect monitor P21 when impeller blades’ leading edge just past guide vane circumferentially from Fig. 4(b). When it comes to II moment, high pressure region in impeller blades pressure side and guide vane pressure side effect each other, so a pressure peak emerges. Along with the rotation of the blades, when blades gradually leave guide vane, pressure become decline in moment III because P21 is apart from high pressure region in pressure side. Another pressure peak will be found when the wake in impeller outlet affects the monitor P21 at IV moment. Generally, Pressure fluctuation amplitude is large, and the influence of wake on the pressure fluctuation is very significant.
As frequency domain more truly and clearly reflects pressure fluctuation, this paper focuses on the frequency domain analysis of unsteady calculation results, and 12T data was selected as frequency domain analysis of sample data. To compare the pressure fluctuation in measuring point in different operating conditions, pressure difference indicates the pressure of frequency domain amplitude, and rotating frequency multiples means the frequency size corresponding to each of the pressure.
where: is the Fourier transform of the actual frequency; is the impeller rotation speed; is the pump rotating frequency at design rotation speed. The calculation results are shown from Fig. 5 to Fig. 8.
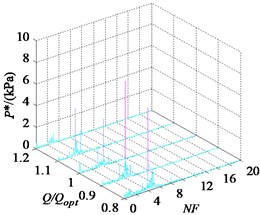
Fig. 5 shows the frequency domain of monitoring points in impeller inlet section under small operating condition , design operating condition and large operating condition Most of the frequency components are blade frequency and blade frequency multiplication. And the basic frequency is blade frequency. The basic frequency amplitude under small operating condition is significantly larger than that under the other operating conditions. The frequency amplitude variation law along the radial direction is consistent under different operating conditions.
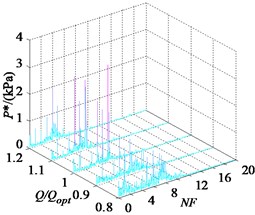
Fig. 6 shows the frequency domain of monitors in impeller outlet section under three operating conditions. It can be seen from figures that pressure fluctuation frequency in this place range from . More low-frequency components appear in , and these frequency components are corresponding to the high frequency division amplitude. Under design operating condition and large operating condition, the basic frequency is blade frequency though a little low-frequency appears too. In terms of the frequency amplitude, the pressure fluctuation frequency amplitude of the monitoring points under design operating condition is the least.
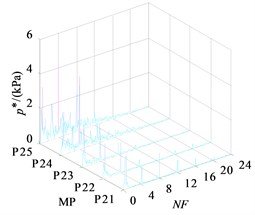
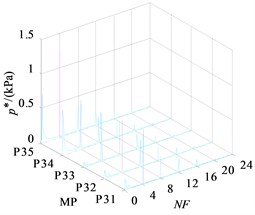
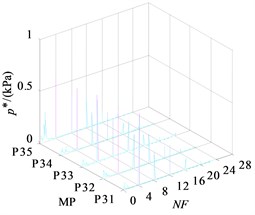
Fig. 7 shows the frequency domain of monitoring points in the middle part section of guide vane under three operating conditions. From these figures it can be found that there are more random frequency components in the middle part section of guide vane under small operating condition than the others, and those random frequency components are smaller than blade frequency. Compared with frequency amplitude in the impeller outlet section, the frequency amplitude in the middle part section of guide vane increases significantly. However, frequency amplitude under design operating condition and large operating condition decrease. And the basic frequency amplitude under small operating condition is significantly greater than that under the other operating conditions.
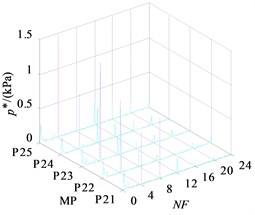
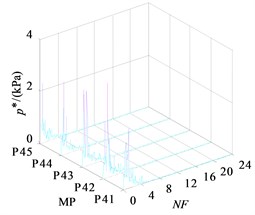
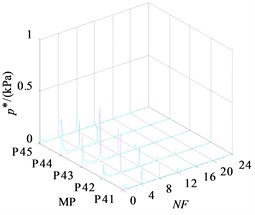
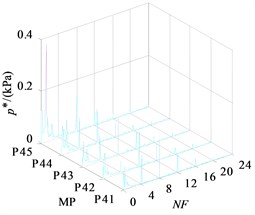
Fig. 8 the shows frequency domain of monitoring points in the outlet section of guide vane under three operating conditions. Pressure fluctuation distribution range in these monitoring points is wider than that in other monitoring points, and more low-frequency components can be found. But frequency amplitude definitely decreases, because guide vane has guide-flow function to make the fluid flow more stable. In terms of the frequency amplitude, basic frequency amplitude under large operating condition is the least and under small operating condition is the largest.
Fig. 5Frequency domain of monitoring points in impeller inlet section under three operating conditions

a)
b) 1.0
c)
Fig. 6Frequency domain of monitoring points in impeller outlet section under three operating conditions
a)
b)
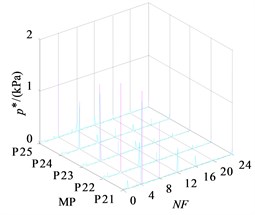
c)
Fig. 7Frequency domain of monitoring points in middle part section of guide vane under three operating conditions
a)
b)
c)
Fig. 8Frequency domain of monitoring points in the outlet section of guide vane under three operating conditions
a)
b)
c)
4. Pressure fluctuation analysis of experiment
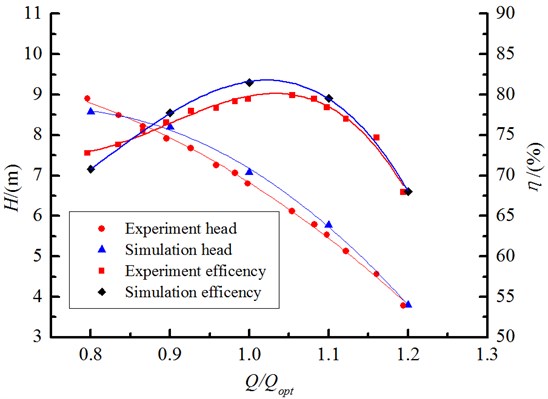
Firstly, steady simulation is conducted under five operating conditions, and these external characteristic curves like head and efficiency curves are obtained, as shown in figure 9. And compared with the experiment results, it can be found that simulation results slightly higher than the experimental value, the tendency of the simulation curve show a good agreement with the experimental curve to verify the reliability of the unsteady numerical simulation.
Fig. 9External characteristic curves
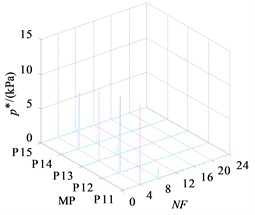
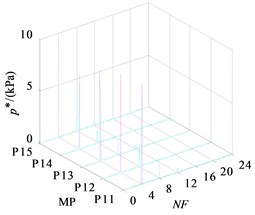
Three monitoring points’ pressure would be measured respectively at impeller inlet, impeller outlet and guide vane outlet in this pressure fluctuation experiment. High frequency pressure pulse sensors are set in holes on pump casing wall. All the monitoring points’ locations are shown in Fig. 10. Set the sampling frequency 10 KHz, every sampling time 10 s.
Fig. 10Monitors location
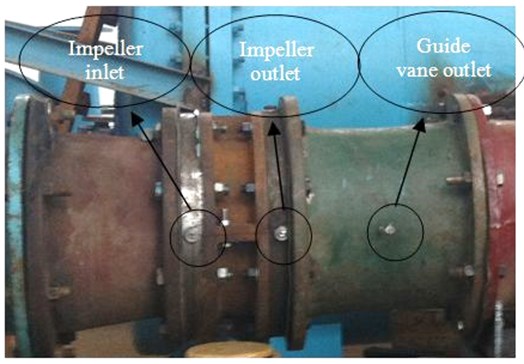
Fig. 11 shows the frequency domain of three points under five operating conditions. From the Fig. 11(a), blade frequency is the basic frequency due to the effects of periodic rotating impeller blade on inlet flow places. Meanwhile, 1 , 2 , 3 frequency component can be found in Fig. 11(a). Compared with difference operating conditions, maximum frequency amplitude in the efficiency of the design operating condition is the smallest. The farther the distance to the design operating condition, the larger maximum frequency amplitude is. Maximum frequency amplitude becomes biggest in operating condition.
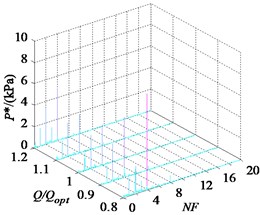
As shown in Fig. 11(b), the pressure fluctuation frequency range is mainly distributed between 0-8 at impeller outlet because of more complicated flow situation duo to the effect of blade wake flow and rotor-stator interaction. Compared with difference operating conditions, the frequency range is constant, and the smallest basic frequency is not under the design operating condition. Under small operating condition, basic frequency is larger than that under large operating condition.
From Fig. 11(c), pressure fluctuation frequency range is between 0-12 , which is wider than the former two monitors. Basic frequency is between the range 4-6 . Due to the guide vane rectification effect, the frequency amplitude is significantly lower than that at impeller inlet and outlet.
Fig. 11Frequency domain of three monitoring points under different operating conditions
a) At impeller inlet
b) At impeller outlet
c) At guide vane outlet
5. Conclusions
In this paper, through the unsteady numerical calculation and experimental research of axial flow pump under different operating conditions, the calculation results show a good agreement with the experimental results. Based on the fast Fourier transform of the pressure fluctuation data, three conclusions have been obtained as follows:
(1) In terms of basic frequency amplitude, under small operating condition, basic frequency amplitude of monitors in four sections are all larger than that under design operating condition and larger operating condition.
(2) In terms of frequency distribution range, under small operating condition, there are more random frequency components in all monitoring points, especially at impeller outlet section, guide vane middle part section and guide vane outlet section. These pressure fluctuation components are all low frequency distributing under the blade frequency. Moreover, the natural frequency of the system devices is also low frequency, so it will be easy to cause resonance under small operating condition.
(3) On the basis of above analysis, running under small operating condition is harmful to axial flow pump’s operational stability. Therefore, it’s necessary to avoid axial flow pump running under small operating condition. Besides, it is useful to lower rotation speed if small operating condition is inevitable during the pump operating.
References
-
Arndt N., Acosta A. J.Brennen C. E, et al. Rotor-stator interaction in a diffuser pump. ASME J. Turbomachinery, Vol. 111, 1989, p. 213-221.
-
Dring R. P., Joslyn H. D., Hardwin L. W. Turbine rotor-stator interaction. ASME J. Eng. Power, Vol. 104, 1982, p. 729-742.
-
Qin W., Tsukamoto H. Theoretical study of pressure fluctuations downstream of a diffuser pump impeller-part 1: fundamental analysis on rotor-stator interaction. Journal of Fluids Engineering, Vol. 119, 1997, p. 647-652.
-
Gonzalez J., Santolaria C. Unsteady flow structure and global variables in a centrifugal pump. Journal of Fluids Engineering, Vol. 128, 2006, p. 937-946.
-
Zhu R., Li X., Yuan S. Collector discharge pressure fluctuation of 1 000 MW nuclear reactor coolant pump. Journal of Drainage and Irrigation Machinery Engineering, Vol. 30, Issue 4, 2012, p. 395-400, (in Chinese).
-
Shi W., Leng H., Zhang D. Performance prediction and experiment for pressure fluctuation of interior flow in axial-flow pump. Transactions of the Chinese Society for Agricultural Machinery, Vol. 42, Issue 5, 2011, p. 44-48, (in Chinese).
-
Zhao Y., Qin D., Liu W. Comparison with the characteristic parameters that denoted the extent of pressure fluctuation on stochastic uncertainty. Large Electric Machine and Hydraulic Turbine, Vol. 1, 2012, p. 34-37, (in Chinese).
-
Shi W., Yao J., Zhang D. Influence of sampling frequency and time on pressure fluctuation characteristics of axial flow pump. Journal of Drainage and Irrigation Machinery Engineering, Vol. 31, Issue 3, 2013, p. 190-194, (in Chinese).
-
Jaeger E. U., Seidel U. Pressure Fluctuation in Francis Turbines. Idaho: Voith Hydro Internal Report, 1999.
-
Wang F., Zhang L, Zhang Z. Analysis on pressure fluctuation of unsteady flow in axial flow pump. Journal of Hydraulic Engineering, Vol. 38, Issue 8, 2007, p. 1003-1009, (in Chinese).
-
Iino T., Kasai K. An Analysis of Unsteady Flow Induced by Interaction between a Centrifugal Impeller and a Vaned Diffuser. Trans. Jpn. Soc. Mech. Eng., Vol. 51, Issue 47, 1985, p. 154-159.
-
Arndt N., Acosta A. J., Brennen C. E. Rotor-Stator Interaction in a Diffuser Pump. ASME J. Turbomachinery, Vol. 111, 1989, p. 213-221.
-
Arndt N., Acosta A. J., Brennen C. E. Experimental Investigation of Rotor-Stator Interaction in a Centrifugal Pump with Several Vaned Diffusers. ASME J. Turbo machinery, Vol. 112, 1990, p. 98-108.
About this article

This research was supported by the Priority Academic Program Development of Jiangsu Higher Education Institutions, the National Natural Science Foundation of China (Grant No. 51279069 and 51079063), the National Natural Science Foundation of Jiangsu Province (Grant No. BK20131256).
