Abstract
The characteristics of the cutting load time series were investigated using chaos and fractal theories to study the information and dynamic characteristics of rock cutting. The following observations were made after analyzing the power spectrum, denoising phase reconstruction, correlation dimension and maximum Lyapunov exponent of the time series. A continuous broadband without a significant dominant frequency was found in the power spectrum. The restructured phase space presented a distinct strange attractor after wavelet denoising. The correlation dimension was saturated at an embedding dimension of 7. Lastly, and the maximum Lyapunov exponent exceeded 0 via the small data method. These findings reflected the chaotic dynamic characteristics of the cutting load time series. The box dimensions of the cutting load were further investigated under different conditions, and the difference in cutting depth, cutting velocity and assisted waterjet types were found to be ineffective in changing the fractal characteristic. As cutting depth become small, rock fragment size also decreased, whereas fractal dimension increased. Moreover, a certain range of cutting velocity increased fragment size but decreased fractal dimension. Therefore, fractal dimension could be regarded as an evaluation index to assess the extent of rock fragmentation. The rock-cutting mechanism remained unchanged under different assisted waterjet types. The waterjet front cutter impacts and damages rock, however, the waterjet behind of cutter is mainly used to clean fragments and to lubricate the cutter.
1. Introduction
The cutting load time series directly records the dynamic characteristic and other information on rock fragmentation, the irregularity and aperiodicity of which are closely related to rock fragmentation itself [1]. The cutting load time series also reflects the dynamics of the cutting system and the information on rock breakage [2]. Collision complicates the nonlinearity and singularity of the cutting system. Therefore, the nonlinear characteristics of the cutting load must be investigated to understand the dynamics of the cutting system. Chaos and fractals have been used to investigate rock fragmentation through an interrelated time series, such as cutting load and acoustic emission. Duan et al. [3] used chaos theory to investigate the nonlinear characteristics of the cutting load time series by a self-controlled hydro-pick and confirmed that the cutting load typically has chaotic characteristic. The correlative dimension can be used as a sensitivity parameter to estimate the rock fracture mechanism. Liu et al. [4] used the fractal theory to study the fractal characteristics of the load time series of a conical pick. They also developed fractal dimension, fractal length, and other feature parameters to explain the physical phenomena. Nie et al. [5] used the saturated correlation dimension method to calculate the correlation dimension of electromagnetic radiation and acoustic emission signals. They confirmed that these signals have chaotic characteristics. Wu et al. [6] adopted fractal theory to investigate the fractal features of the acoustic emission time series in rock failure under uniaxial compression and found that all time series at different stages have fractal features. Fractal dimension can be used to describe the evolving regularity of microscopic cracks. Wang et al. [7] analyzed the fractal feature of the electromagnetic radiation signal in coal and rock failure process. They found that the variation in correlation dimension is consistent with coal and rock burst processes.
To a certain text, the aforementioned studies have shed light on rock fragmentation and cutting system dynamics. Although most of these studies have focused on the characteristics of acoustic emission signals in rock fragmentation, only a few works have explored the nonlinear characteristics of the cutting load. In the presented study, fast Fourier transform, denoising, phase space reconstruction, correlation integral and small data methods were adopted to obtain the power spectrum, phase space diagram, correlation dimension and maximum Lyapunov exponent for verifying the chaotic dynamic characteristics of the cutting load time series. Fractal dimensions under different cutting conditions were also calculated and analyzed to investigate the rock fracture mechanism and cutting performance.
2. Methods
2.1. Phase space reconstruction
The irregular contact between the cutting mechanism and rock usually contributes to the complexity, nonlinearity, ambiguity, and dissipativeness of a cutting system and to the nondeterminacy of a cutting load time series. However, the complex dynamic characteristics of a cutting system are difficult to verify in a low-dimensional coordinate systems. To investigate such dynamic systems, the time series must undergo phase reconstruction. However, the cutting load signal can only be collected usually during rock cutting, and thus, obtaining reconstructed phase space along with all the derivatives of the cutting load signal can yield plenty of errors. A time series is determined by the self-relevant components defined in the Takens theorem [8], and the information on its components is hidden within the time series itself. Therefore, one or several equivalent phase spaces of the time series can be built using the time delay method to recover the information on the cutting system. Several methods have been developed recently for phase-space reconstruction, such as uniform and non-uniform embedding procedures [9-10]. The delay-coordinate method for phase-space reconstruction of 1D time series (, ) has been widely used in different fields by Packard [11], and the – dimensional reconstructed vectors:
where represents the embedded dimension of restructured phase space; stands for the delay time; is the points number in the phase space, .
2.2. Denoising based on wavelet analysis
As a result of the influence of measurement devices and the accuracy of signal acquisition, the desired signal of the cutting load is often disturbed by noise. Consequently, the internal dynamics of the cutting system may be masked by the unpredictability and destructive effect of noise. Therefore, noise must be reduced to reveal the internal characteristics of the cutting load. Numerous methods have been developed recently for signal denoising, such as filtering, shadow theorem, singular spectrum analysis, and wavelet analysis [12-13]. Among these methods, wavelet analysis is considered as the most suitable for signal denoising [14]. Denoising analysis is generally conducted in either the time or frequency domain, and thus, wavelet analysis can be conducted in both domains, which helps in processing random and non-stationary time series to achieve a high signal-to-noise ratio. For a discrete signal with a family of shifted and scaled wavelets associated with , the discrete wavelet transform is given as [15]:
The mother wavelet in Equation (2) is discretely dilated by the scale parameter and is translated by the translation parameter , where and are fixed values, with and , whereas and are positive integer values [16].
2.3. Delay time and embedded dimension
Delay time is an important parameter for phase-space reconstruction. The trajectories in reconstructed phase space gather at the same place if the delay time was too short because of the influence of the acquisition instrument and interference noise on the cutting load time series. Moreover, the shortest time interval for capturing the cutting load information cannot be covered. If the delay time is too long, the information cannot be captured because of the violent fluctuations in the cutting system. Several methods, such as the autocorrelation and mutual information methods can be used to estimate the delay time. The autocorrelation method is preferred for its simplicity and maturity in estimating delay time. For a 1D discrete time series, the autocorrelation function of delay time can be expressed as [17]:
Given , ratio of the autocorrelation function with delay time to that of the initial value is solved. can be universally considered as delay time when decreases to or if it reaches the first minimal value [18].
Embedded dimension is another important parameter for phase-space reconstruction. The trajectories in the reconstructed phase space fold if the embedded dimension is too small. If the embedded dimension is too large, then the restructured phase space increases the calculated amount, and noise may be dominant. Several methods can be used to estimate embedded dimension such as the correlation integral, nearest neighbour and odd value decomposition methods. This study uses the correlation integral method because of the high density of points in the phase space. Given 0 as threshold, the number of points according to is calculated. The ratio of the calculated points to that of the total points is the correlation integral, which can be expressed as [19]:
where represents the Heavside function , .
The threshold is set to an appropriate value, and the correlation dimension of the time series can be calculated approximately as:
2.4. The Lyapunov exponent
The power spectrum aims to reveal the frequency characteristics of the time series in the time domain or frequency domain as well as to distinguish periodic, quasi-periodic, and random signals. Despite its intuitionism and easiness, the power spectrum cannot readily distinguish the large periodic dynamic system or chaos system. The Lyapunov exponent is used to describe the diffusion or convergence rate of the phase-space trajectory of chaotic time series with an exponential law. The chaos system is confirmed by a positive Lyapunov exponent. This exponent is also widely used to identify the chaotic characteristic of time series. The Wolf, Jacobian, small data methods can be used to calculate the maximum Lyapunov exponent at present. The small data method has several advantages, including its high-speed calculation and low sensibility to embedded dimension, delay time and data amount. For phase-space reconstruction, the nearest neighbor of each point can be found in phase space by using the following equation [20, 21]:
where is equal to and ; is the average period of the cutting load time series, that can be set to the reciprocal of the energy spectrum frequency; is the state point of the reconstructed phase space; is the distance between one point and the nearest point during the initial time.
Suppose that an exponent diverging rate is present between reference the point and its nearest point in the basic orbit, then it can be calculated as follows:
where is the sample period; is the distance of the nearest points of group in the basic orbit with the elapsed time ; is the average value of all about .
2.5. Fractal dimension
The strange attractor generally has a self-similar structure in the phase space, and the chaotic time series also has a statistical similarity to the fractal time scales [22]. Fractal dimension is an important parameter in describing the complexity of a system. The load time series can be regarded as an open curve in two dimensions, and its outline has a fractal feature. The fractal dimension can be used to reflect the geometric feature to analyze the complexity and irregularity levels. Topological, capacity, similarity, and box dimensions are considered as fractal dimensions. The box dimension method is a simple and mature method technique for estimating the fractal dimension. The number of boxes with side length covers the curve of the time series , which follows the fractal distribution with a different side length, as follows [23]:
According to Equation (8), fractal dimension is equal to the slope of to .
3. Experiment
3.1. Cutting load signal acquisition
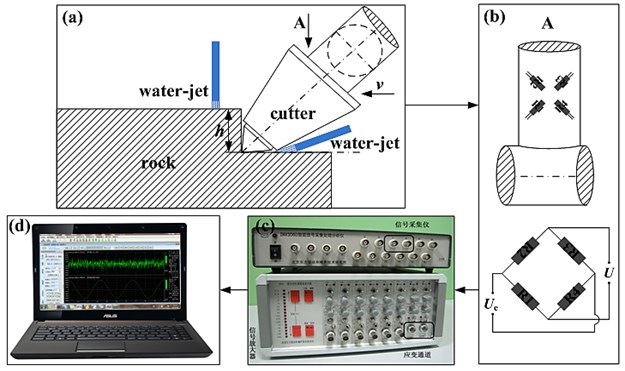
The signal acquisition system of rock cutting is shown in Fig. 1. The system mainly included a cutting device, a fixed beam for attaching strain gages, a signal acquisition instrument, a computer to process signals, and other assistive devices. In the cutting device, the cutter would act on the rock, and its cutting speed and depth could be adjusted. The strain gage was attached to the fixed beam and not directly to the cutter to adjust cutting parameters conveniently. The INV306U instrument, which was developed by Beijing Dongfang Vibration And Noise Technology Research Institute, was used to collect the signals to achieve voltage signal acquisition and amplification by using different types of strain gage bridges. The sample frequency was set to 1024 Hz to obtain more comprehensive information. The signal was processed through a personal computer with intelligent data acquisition and software DASP-V10 software. A full-bridge circuit of strain gages was used to collect voltage signal [24]. The changes in voltage signal were eliminated through beam bending when the beam torque was used to calculate the cutting load.
Fig. 1The signal acquisition system: (a) a cutting device; (b) a fixed beam and strain gage bridge; (c) a signal acquisition instrument; (d) a computer to process signals
3.2. Experimental phenomena
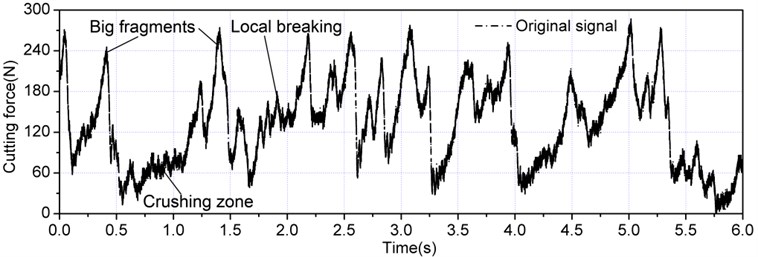
In rock cutting process, the time series of a typical load signal was collected as shown in Fig. 2. The extrusion of the cutter on the rock at the initial stage produced a crushing zone, and the cutting load increased nonlinearly along with penetration displacement. The cutting load continued to increase after the crushing zone was formed, and several small peaks exhibited that a number of local breakings would occur before the peak cutting load could be achieved. The rock cutting load instantaneously decreased to a small value after the peak cutting force was achieved, thus indicating that a large rock fragment was formed because of the extrusion of the cutter on the rock. The aforementioned phenomena are consistent with the rock cutting theory or the experimental results [1, 25-26]. The formation of crushing zone, local breakings, and the avalanche of large fragments alternately occurred, which contributed to the appearance of several smaller pecks between two adjacent large peaks. The aperiodicity of the cutting load amplitude and wavelength confirmed the discreteness and irregularity of rock cutting and breaking.
Fig. 2Cutting load time series
4. Results
4.1. Chaos characteristics
Power spectrum analysis can be used to understand the characteristics of a time series, such as periodic, quasi-periodic and non-periodic signals. The cutting load time series was translated by fast Fourier transform in the frequency domain [27], and its power spectrum is shown in Fig. 3. The power spectrum of the periodic signal exhibited discreteness; however, that of the cutting load exhibited a continuous broadband, non-dominant frequency, and a wide-band noise. Therefore, the cutting load time series exhibited chaotic characteristics. Given that such features were obtained outwardly, phase-space reconstruction and the maximum Lyapunov exponent were still necessary to identify the characteristics of cutting system.
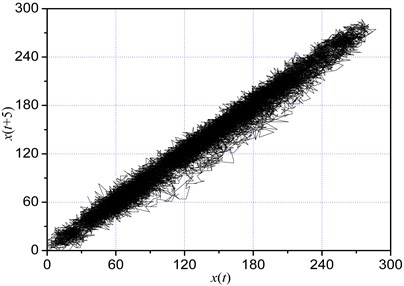
The phase space of the time series was restructured using Equation (1), as shown in Fig. 4. The trajectories were disorganized and unsystematic in the phase space, and exhibited pseudo-randomness. Therefore, the interference noise should be reduced to prevent the time series from being influenced by the unpredictability and destructiveness of noise.
Fig. 3Power spectrum of cutting load
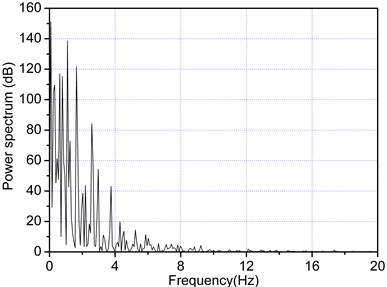
Fig. 4Reconstructed phase space
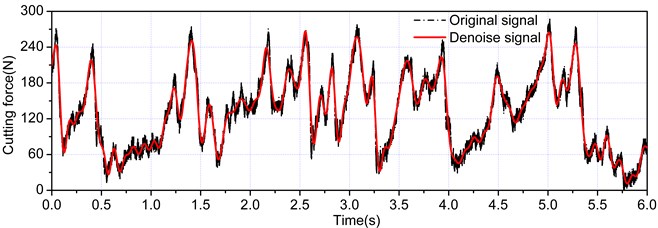
In the present study, the principle of denoising was adopted based on a multi-resolution signal decomposition analysis. The rock cutting signal was processed through multi-resolution signal decomposition, and was decomposed up to level 8 by using “discrete Meyer” as a mother wavelet. After inspecting the components, the signal was denoised by using detail component 7 and 8. The cutting load signal of denoising is shown in Fig. 5 whereas the reconstructed phase space is shown in Fig. 6. The trajectories of the reconstructed phase space were free from repetition, and enfoldment, and were concentrated at a certain region. Moreover, the reconstructed phase space of denoising exhibited an unambiguous strange attractor, which confirmed the chaotic dynamic characteristic of the cutting load. The denoising of the time series by wavelet analysis was shown to improve the deterministic components of the cutting system.
Fig. 5Cutting load signal of denoising
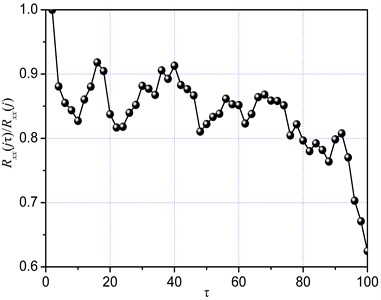
The ratio of the autocorrelation function with delay time to that of the initial value could be obtained using Equation (3), as shown in Fig. 7. The delay time was equal to 10 when reached the first minimal value, and to 100 when decreased to . In the presented study, 100 was selected as the delay time to avoid the loss of dynamic information of the cutting system.
Fig. 6Phase space of denoising signal
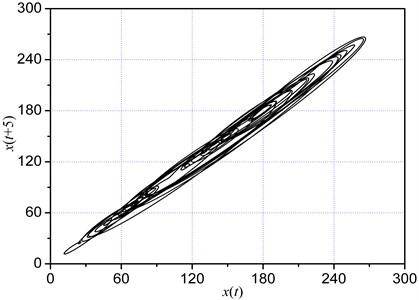
Fig. 7Rxx(jτ)/Rxx(j)
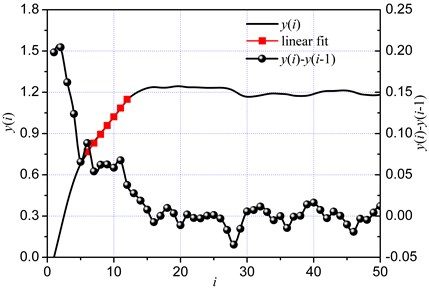
The correlation dimension saturated to a certain value with increasing embedded dimension if there was a strange attractor in the restricted phase space. The saturation value is often regarded as the correlation dimension of the time series. The variation of the correlation dimension with increasing embedded dimension is shown in Fig. 8. According to Takens theorem, the embedded dimension of the cutting system should be equal to 8.
The Lyapunov exponent of the time series can be estimated according to the slopes of the straight lines based on Equation (7). The maximum Lyapunov exponent was equal to the slope of a linear area of according to least-square method. According to and (Fig. 9), were equal basically equal when was within the range of 6 to 12. The slope of 0.065 within this range was regarded as the maximum Lyapunov exponent of the cutting load time series by the linear least-square regression method, which also demonstrated the chaotic dynamic characteristic of the cutting system.
Fig. 8Correlation dimension
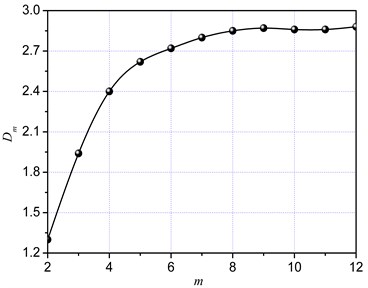
Fig. 9Lyapunov exponent
4.2. Factors that influence fractal dimension
4.2.1. Cutting depth
According to Equation (8), the double logarithmic curves with the cutting depths of 15 mm and 20 mm are shown in Fig. 10. The slopes of these curves were 1.57 and 1.46 respectively, via the linear least-square regression method. The correlation coefficients of the fitting straight lines were all higher than 0.99, which reflected the fractal feature of the cutting load time series. Therefore, cutting depth had no influence on the fractal distribution of the load signal. A difference was observed in the fractal dimension when the cutting depth was different. The fractal dimension decreased with increasing cutting depth, thus indicating an increase in the self-similarity of cutting load when the cutting depth was reduced. Based on the size and number of rock fragments, a small fractal dimension produced large size and small number of rock fragments, thus indicating that rock was not seriously broken. By contrast, a big fractal dimension produced large number and small size of rock fragments. Therefore, the fractal dimension of the cutting load time series could be used to evaluate the extent of rock cutting or crushing.
Fig. 10Fractal dimension of cutting load with different cutting depth
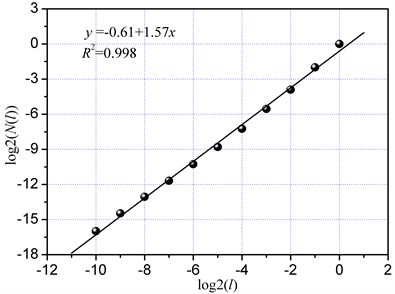
(a) 15 mm
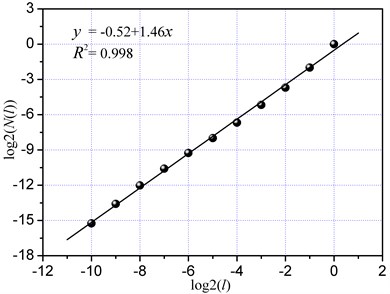
(b) 20 mm
4.2.2. Cutting velocity
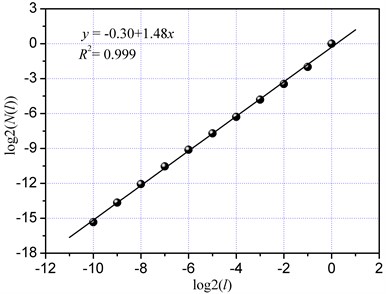
The double logarithmic curves with the cutting velocity of 0.5 m/min and 4 m/min are shown in Fig. 11. The correlation coefficients were all higher than 0.99, thus indicating that the cutting velocity did not affect the fractal feature of the time series. The fractal dimension was equal to 1.55 at the cutting velocity of 0.5 m/min, and to 1.48 at the cutting velocity was 4 m/min. The time series with low cutting velocity had high self-similarity, and was capable of filling the phase space of the cutting system. Based on energy dissipation, a bigg fractal dimension with a low cutting velocity highly dissipated the energy of cutting system. With regard to size distribution, a low cutting velocity produced small fragments and big fracture areas, thus indicating that the energy required to generate a new fracture surface is big based on Griffith theory [28]. A low velocity could break down big fragments more than twice, and a high velocity might cause big fragments fly off from the motion path of cutter, thus preventing them from being broken down further. Therefore, the fractal dimension of the time series with a high velocity was smaller than that of the time series with a low velocity. Based on theory of rock crushing, the extent of rock crushing is high when the impact velocity is also high. However, the opposite is true regard to cutting velocity, as mentioned earlier. The present phenomenon could probably be attributed to rock fragments being crushed more than twice by the cutter during rock cutting. Therefore, the influence of cutting velocity on rock crushing and cutting performance should be investigated further.
Fig. 11Fractal dimension of cutting load with different cutting velocity
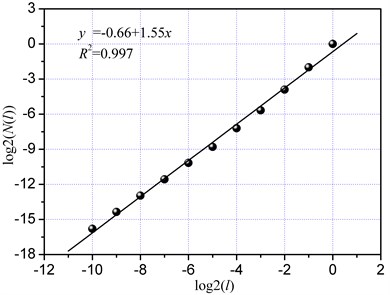
(a) 0.5 m/min
(b) 4 m/min
4.2.3. Types of assisted waterjet
High-pressure waterjet has been widely used in rock cutting, however, the fracture mechanism of the involved process remains unclear because of the opacity and damage instantaneity of the rock. To determine the rock fracture mechanism with different types of assisted waterjet (Fig. 1), this study investigates the fractal dimension of the cutting load time series. The double logarithmic curves under the waterjet front of the cutter or behind of the cutter are shown in Fig. 12. The correlation coefficients were higher than 0.99, thus indicating that such types of the assisted waterjet had an insignificant on fractal feature. The fractal dimension of the cutting load changed remarkably when the fracture mechanism of the rock was changed [3]. However, the difference in fractal dimension of the two different types was small, thus indicating that the fracture mechanism of rock cutting was unchanged by these types of waterjet. The waterjet in front of the cutter could decrease cutting load because of the the damage on the caused by the impact of the waterjet [29], however, the waterjet is used to clear fragments and to lubricate the cutter when it is behind of the cutter.
Fig. 12Fractal dimension of cutting load with different assisted waterjet types
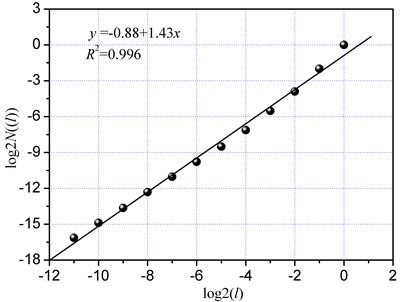
(a) Waterjet front of the cutter
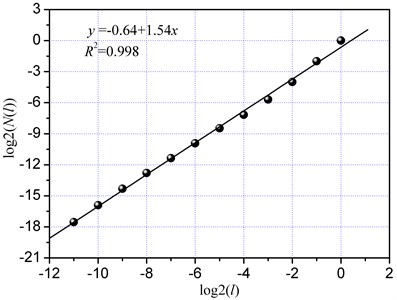
(b) Waterjet behind of the cutter
5. Conclusions
This study investigates the nonlinear dynamic characteristics of the cutting load time series based on chaos and fractal theories. The following conclusions are made based on our investigation:
(1) The crushing zone, local breaking, and the avalanche of rock fragments occur alternately, thus producing several small pecks between the two large adjacent peaks. The change in the aperiodicity of the amplitude and the wavelength of the cutting load signal reflects the discreteness and irregularity in rock cutting.
(2) The power spectrum of the cutting load time series reflects a continuous, broadband, nondominant frequency, and a wide-band noise. The time series of denoising via the wavelet method can improve the deterministic components of the cutting system. The reconstructed phase space of denoising produces an unambiguous and self-organizing strange attractor. The maximum Lyapunov exponent of the load time series is equal to 0.065 according to the small data method. These results confirm the chaotic dynamic characteristics of the rock cutting time series.
(3) The difference in cutting depth, cutting velocity, and types of assisted waterjet all cannot change the fracture mechanism in rock cutting. The fractal dimension has a negatively correlated to the size of rock fragments, and can be used as an evaluation index for the extent of rock cutting or crushing. The waterjet in front of the cutter can decrease the cutting load because of the damage on rock by waterjet, however, the waterjet is used to clear fragments and to lubricate the cutter when it is behind of the cutter.
References
-
Rojek J., Onate E., Labra C., Kargl H. Discrete element simulation of rock cutting. International Journal of Rock Mechanics & Mining Sciences, Vol. 48, Issue 6, 2011, p. 996-1010.
-
Liu C. S., Li D. G. Mathematical model of cutting force based on experimental conditions of single pick cutting. Journal of China Coal Society, Vol. 36, Issue 9, 2011, p. 1565-1569.
-
Duan X., Yu L., Cheng D. Z. Chaotic dynamical features of rock breaking mechanism with self-controlled hydro-pick. Chinese Journal of Rock Mechanics and Engineering, Vol. 14, 1995, p. 484-491.
-
Liu C. S. Fractal characteristic study of shearer cutter cutting resistance curves. Journal of China Coal Society, Vol. 29, Issue 1, 2004, p. 115-118.
-
Nie B. S., He X. Q., Liu F. B., et al. Chaotic characteristics of electromagnetic emission signals during deformation and fracture of coal. Mining Science and Technology, Vol. 19, Issue 2, 2009, p. 189-193.
-
Wu Z. X., Liu X. X., Liang Z. Z., et al. Experimental study of fractal dimension of AE serials of different rocks under uniaxial compression. Rock and Soil Mechanics, Vol. 33, Issue 12, 2012, p. 3561-3569.
-
Wang C., Xu J. K., Zhao X. X., et al. Fractal characteristics and its application in electromagnetic radiation signals during fracturing of coal or rock. International Journal of Mining Science and Technology, Vol. 22, Issue 2, 2012, p. 255-258.
-
Packard N. H., Crutchfield J. P., Farmer J. D., et al. Geometry from a time series. Physical Review Letters, Vol. 45, Issue 9, 1980, p. 712-715.
-
Ragulskis M., Lukoseviciute K. Non-uniform attractor embedding for time series forecasting by fuzzy interface systems. Neurocomputing, Vol. 72, 2010, p. 2618-2626.
-
Lukoseviciute K., Ragulskis M. Evolutionary algorithms for the selection of time lags for time series forecasting by fuzzy interface systems. Neurocomputing, Vol. 73, 2009, p. 2077-2088.
-
Takens F. Detecting strange attractors in turbulence in Lecture Notes in Mathematica. Springer-Verlag, Berlin, 1981.
-
Hammel S. M. A noise reduction method for chaotic system. Physics Letters A., Vol. 148, Issue 8-9, 1990, p. 421-428.
-
Schreiner T. Extremely simple nonlinear noise-reduction method. Physic Reviewer E., Vol. 47, Issue 4, 1993, p. 2401-2404.
-
Satish L., Nazneen B. Wavelet-based de-noising of partial discharge signals buried in excessive noise and interference. IEEE Trans Dielectr Electr Insul., Vol. 10, Issue 2, 2003, p. 354-367.
-
Young R. K. Wavelet theory and its applications. Pennsylvania State University, Kluwer Academic Publishers, 1993.
-
Elkalashy N. I. Modeling and detection of high impedance arcing fault in medium voltage networks. In: Doctoral dissertation, Helsinki University of Technology (TKK), Finland, 2007.
-
Zhang W. C., Tan S. C., Gao P. Z. Chaotic forecasting of natural circulation flow instabilities under rolling motion based on Lyapunov exponents. Acta Physica Sinica, Vol. 62, Issue 6, 2013, p. 060502.
-
Liu B. Z., Peng J. H. Nonlinear dynamics. Higher Education Press, Beijing, China, 2004.
-
Grassberger P. An optimized box-assisted algorithm for fractal dimension. Physical Letter A., Vol. 148, Issue 2, 1990, p. 63-68.
-
Zhang Y. M., Qi W. G. Chaotic property analysis and predication model study for heating load time series. Acta Physica Sinica, Vol. 60, Issue 10, 2011, p. 10058.
-
Zhang X. Q., Liang J. Chaotic characteristics analysis and prediction model study on wind power time series. Acta Physica Sinica, Vol. 61, Issue 9, 2012, p. 19050.
-
Mandelbrot B. B. The fractal geometry of nature. Freeman, San Francisco, USA, 1982.
-
Shi M. H., Li X. C., Chen Y. P. Determination of effective thermal conductivity for polyurethane foam by use of fractal method. Science in China Series E: Technological Sciences, Vol. 49, Issue 4, 2006, p. 468-475.
-
Stefanescu D. M. Handbook of force transducers–principles and components. Springer, Berlin and Heidelberg, 2011.
-
Nishimatsu Y. The mechanics of rock cutting. International Journal of Rock Mechanics and Mining Science, Vol. 9, Issue 2, 1972, p. 261-270.
-
Ranman K. E. A model describing rock cutting with conical picks. Rock Mechanics and Rock Engineering, Vol. 18, Issue 2, 1985, p. 131-140.
-
Duhamel P., Vetterli M. Fast Fourier transforms: a tutorial review and a state of the art. Signal Processing, Vol. 19, Issue 4, 1990, p. 259-299.
-
Jiang H. X., Du C. L., Liu S. Y. The effects of impact velocity on energy and size distribution of rock crushing. Journal of China Coal Society, Vol. 38, Issue 4, 2013, p. 604-607.
-
Jiang H. X., Du C. L., Liu S. Y., Xu R. Experimental research of influence factors on combined breaking rock with water jet and mechanical tool. China Mechanical Engineering, Vol. 24, Issue 8, 2013, p. 1013-1017.
About this article

The authors would like to acknowledge the Foundation of National 863 Plan of China (2012AA062104), the National Natural Science Foundation of China (51375478), the project funded by the Priority Academic Program Development of Jiangsu Higher Education Institutions (SZBF2011-6-B35), and the Graduate Education Innovation Project of Jiangsu Province (CXLX12_0948).
