Abstract
The investigation results of the historic narrow-gage railway steel truss bridge built in the previous century, still in use, are presented in this paper. The bridge was blasted during the World War II, later restored. This bridge is unique and original design documentation was lost, nevertheless the aim of this study is to investigate behavior and the structural condition of riveted steel truss bridge using full-scale dynamic experiments. Field load tests were performed with the aim to develop an analytical model to evaluate the capacity of the bridge. Dynamic testing of the bridge was conducted with original locomotive. Other dynamic tests with impulse excitation were also performed. Responses (dynamic displacements, accelerations, mode shapes, corresponding resonant frequencies and modal damping values) of the bridge structure were determined. Studies have shown that the bridge meets the safety requirements and has enough reserve for operation.
1. Introduction
One of possible approaches to estimate the condition of bridge construction is field testing executed in some particular cases, such as checking concepts, collecting information, determining damages (if any) and overload testing. All these conditions can be derived out of excited bridge dynamic characteristics. Dynamic response of bridge can be measured through set of sensors; sufficient number of sensors has to be employed to determine eigen-modes of construction.
Dynamic testing is reliable way to evaluate technical condition of bridge in that such test results display exact behavior of the construction exposed to static or dynamic load. Testing evaluates factors that cannot be taken into account both on the design and building stages. Bunch of scientific experiments and theory calculations were performed during decades and are being further improved. Calculation and analysis methodologies are being improved on the base of systematic collection of testing data [1-5]. Using monitoring data bridges are built to meet increased load conditions. Research works and experiments are described in [6–10].
Locomotives are employed to obtain the dynamic response of bridge construction. By using safety index based on safety factor for each component of the bridge, system reliability of the whole structure is evaluated upon employing the mathematical models [11, 12]. One of the main reasons for the increased interest to steel truss-bridges is lack of funding to replace aging and suffered from war riveted steel bridges as well as increasing railway traffic [13, 14]. Steel truss-bridges are analyzed to check building concepts and assumptions; information about the geometry of elements, calculation schemes, material properties etc. is collected for condition evaluation. Construction is verified if it has any severe damages which analytically cannot be evaluated.
2. The object of interest
The bridge under analysis is a three-span symmetric construction built of simply supported 27.00 m riveted trusses and 30.60 m central span; the total length of bridge is 84.60 m. The distance between parallel spans is 4.40 m wide (Fig. 1), supported on two restraining and two bearings at the piers. Depth to span ratio is in 1/7-1/8 range.
The main truss girder consists of riveted longitudinal parallel top and bottom chords, verticals and the diagonals. Chords and diagonals are box-shaped, consisting of standard rolled channel components connected with the laces. Vertical posts are built of angles and plates. The top and bottom chords of the main trusses are connected by two vertical stiffeners and horizontal supports. All bracing systems are made of the angles and riveted to connection plates.
Fig. 1Design a) and cross-section b) of the bridge
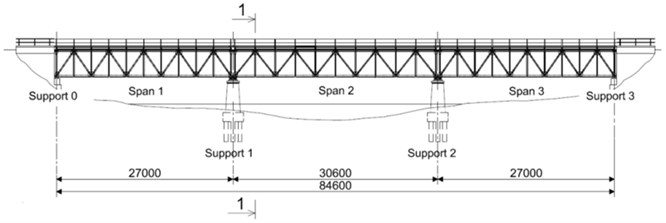
a)
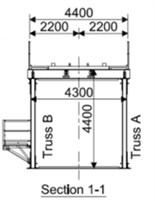
b)
A thorough examination and field load tests were performed to evaluate the bridge condition. Bridge has been tested on purpose to identify all damages and their causes. Inspection revealed a number of defects such as corrosion, fatigue, deformation and other defects (buckling, worn-out bearings) that may be called typical for such riveted truss structures [11-15].
Current operation requirements on the bridge allow the maximum speed of 30 km/h for a train. Dynamic load tests were carried out upon using a locomotive passing the bridge at different speeds ranging from 13 to 45 km/h to cover the operating range of the bridge.
Additional dynamic tests were performed using controlled impact by employing hammer. Response within frequency range of 200 Hz to impact of the bridge was measured as acceleration to time dependencies. The Fast Fourier Transform (FFT) technique was used to find the bridge natural frequencies. Obtained natural frequencies were compared to the results of the analytical model.
3. Experimental approach
Fig. 2Vibration measuring equipment

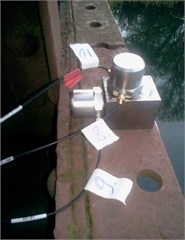
Vibrations were measured upon using “Brüel & Kjær” equipment (Fig. 2). Accelerometers 8344 were mounted on certain mounting bricks which allowed orientating and fixing the gauges properly.
Gauges mounting locations were selected at the mid-span point, since the truss-system has dominant length which says that it acts as a beam. It is well known that the greatest displacement at first, third, fifth etc. modes of beam are at the middle of structure. Signals from gauges were processed using “Origin 6” and “Pulse” software. Spectra, distributions and statistical parameters were obtained.
3.1. Testing results with locomotive
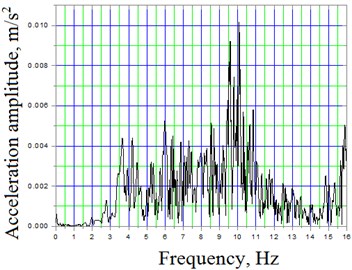
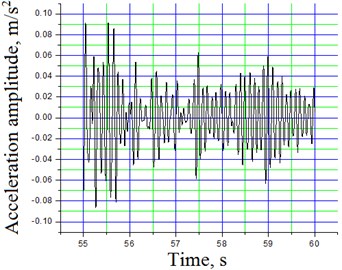
Locomotive were passing the bridge at different speeds: 13, 21, 39, 44 km/h. Measurements were performed using accelerometers in three orthogonal directions. Measured vibrations and calculated spectral distribution graphs are presented in Figs. 3 and 4. Tables 1 and 2 represent statistical characteristics of vibrations [15].
Fig. 3Span No 2 of truss-system A amplitudes and frequency spectra of vertical oscillations at speed 13 km/h: a) filtered to 16 Hz acceleration time dependent signal; b) spectral density
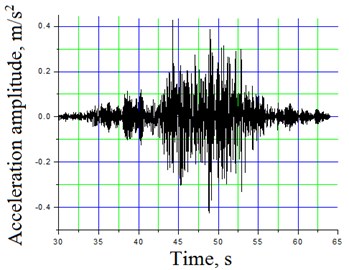
a)
b)
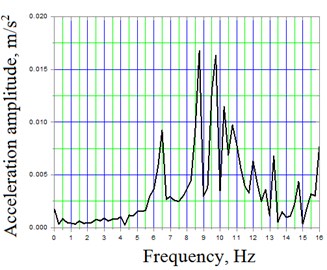
Further sector of Fig. 3(a) is presented scaled from 55th to 60th second in Figs. 4. Here several corresponding mode frequencies might be observed: 6.49, 8.74, 9.74, 10.24, 10.74, 11.99, 13.24, 14.74 Hz.
Fig. 4Span No 2 of truss-system A amplitudes and frequency spectra of vertical oscillations at speed 13 km/h (further part of Fig. 3(a) from 55th to 60th second): a) filtered to 16 Hz acceleration time dependent signal; b) spectral density
a)
b)
Calculated statistical characteristics of vibrations excited by locomotive passing at different speeds.
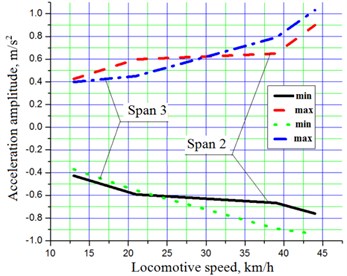
Correlation between the locomotive speed and acceleration amplitudes of truss-system of bridge of 2nd and 3rd spans is presented in Fig. 5.
Table 1Span 2, truss-system A, vertical direction
Speed, km/h | Acceleration amplitude min, m/s2 | Acceleration amplitude max, m/s2 | Dispersion, m/s2 |
13 | –0.42572 | 0.42586 | 0.85158 |
21 | –0.59048 | 0.59858 | 1.18905 |
39 | –0.66591 | 0.64972 | 1.31563 |
44 | –0.7597 | 0.90034 | 1.66004 |
Table 2Span 3, truss-system A, vertical direction
Speed, km/h | Acceleration amplitude min, m/s2 | Acceleration amplitude max, m/s2 | Dispersion, m/s2 |
13 | –0.3694 | 0.39955 | 0.76895 |
21 | –0.55484 | 0.45063 | 1.00547 |
39 | –0.89134 | 0.79067 | 1.68202 |
44 | –0.9396 | 1.03226 | 1.97186 |
Fig. 5Correlation between the locomotive speed and acceleration amplitudes maximum and minimum values
The displacement graph of amplitudes locomotive traveling at different speeds is presented in Fig. 6. Speeds are highlighted in different colors. Values of displacement amplitudes when locomotive runs at corresponding speeds shown in Table 3.
Fig. 6The displacement graphs of amplitudes at corresponding locomotive speeds
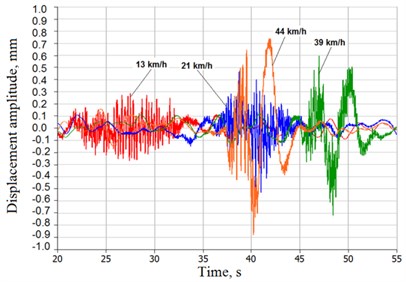
Table 3Span 3 truss-system A, vertical direction
Speed, km/h | Displacement amplitude min, mm | Displacement amplitude max, mm |
13 | –0.27 | 0.29 |
21 | –0.532 | 0.47 |
39 | –0.719 | 0.594 |
44 | –0.863 | 0.742 |
3.2. Testing results of impact excitation
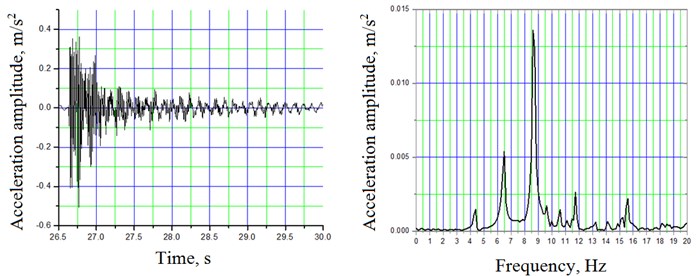
Impact vibration test was carried out to obtain a bridges structure dynamic properties [16, 17]. These results were used for comparison with the results of the previous test with a locomotive. Impact excitation test allows extracting 7 eigen-modes in range of 0-20 Hz in each span (Figs. 7, 8 and 9). Most notable are the first four modes in the frequency range of 0-10 Hz for the 2nd span and range of 0-12 Hz for the 3rd span (Table 4). Higher mode responses are more difficult to identify properly because of the higher relative noise level and close spaced modes. Amplitude peaks at 4.28 Hz (span 2) and 5.24 Hz (span 3) appeared only in lateral vibrations. The measured natural frequencies for certain span were found to be repeatable within 1.5 % of the total of 14 impact tests.
Table 4Experimental modes and corresponding natural frequencies along with statistical characteristics obtained by impact excitation
Mode | Span 2 | Span 3 | Mode type | ||||||
NN | , Hz | , Hz | , Hz | , % | , Hz | , Hz | , Hz | , % | |
1 | 4.28 | 4.31 | 0.07 | 1.64 | 5.24 | 5.31 | 0 | 0 | 1st bending lateral |
2 | 6.49 | 6.35 | 0.01 | 0.15 | 7.86 | 7.96 | 0.10 | 1.27 | 1st bending vertical |
3 | 8.68 | 8.54 | 0.01 | 0.12 | 9.74 | 10.4 | 0.11 | 1.13 | 1st torsional |
4 | 9.63 | 9.47 | 0.03 | 0.31 | 11.5 | 11.8 | 0.10 | 0.87 | 2nd torsional |
Fig. 7Typical longitudinal acceleration time history and corresponding frequency spectra due to impact excitation at mid-span 2 truss-system A by dropping the weight on the centerline of the bridge deck and on the truss (6,48; 8,68; 9,61 Hz)
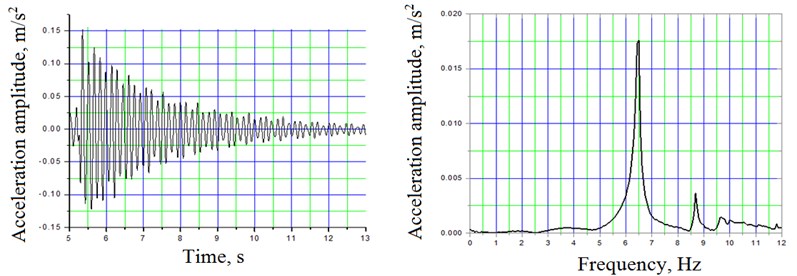
Fig. 8Typical longitudinal acceleration time history and corresponding frequency spectra due to impact excitation at mid-span 2 truss-system B by dropping the weight asymmetrically on the bridge deck and on the truss (6,49; 8,68; 9,61; 9,99 Hz)
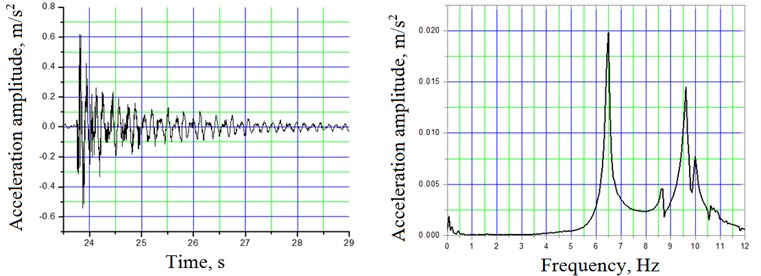
Fig. 9Typical longitudinal acceleration time history and corresponding frequency spectra due to impact excitation at truss-system B by dropping the weight asymmetrically on the bridge deck and on the truss (4,37; 6,49; 8,61; 9,61; 11,74; 15,61 Hz)
The experimental results were compared with the analytical model of the bridge; approximate simplified model of bridge was built without stringers, floor beams, bracing and rails. Only actual truss members were included in the analytical model. According fore-mentioned methodic mathematical model of bridge in ANSYS environment was composed and modal analysis was performed. Obtained mode frequencies are 4.31, 635, 8.54 and 9.47 Hz for span 2 and 5.31, 7.96, 10.4 and 11.8 Hz for span 3 respectively. Error between test and mathematical model results is relatively low; difference between measured and calculated modes is in range of 7 %. In Fig. 10, the corresponding modes of mathematical model are presented.
Fig. 10Shapes of vibrational experiment obtained from finite element analysis

a) 1st bending lateral

b) 1st bending vertical

c) 1st torsional
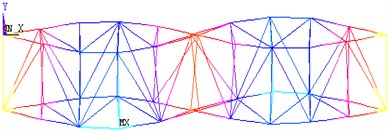
d) 2nd torsional
Usually the first eigen-mode predominates over the rest modes that follow. The first mode of simply supported bridge can be calculated by formula (LST EN 1991-2/AC):
where is deflection at mid-span.
Computed deflection at mid-span under load is for span 2 and for span 3 if natural frequencies are Hz and Hz, respectively.
The mean value of the 1st natural frequency of bridge can be calculated by formula described in papers [6-8]. The obtained values: with the confidence limits of 95 %, i.e. within the limits of for span 2 and for span 3.
4. Conclusions
1) From impact excitation tests and simultaneous measurements a total of 7 resonant modes in each span in the range of 0-20 Hz of vertical and lateral vibrations were observed. The most distinguished are the first four peaks:
a) 4.28; 6.49; 8.68 and 9.63 Hz in the span 2;
b) 5.24; 7.86; 9.74 and 11.55 Hz in the span 3.
Higher mode responses are more difficult to identify confidently due to relatively higher noise level and closely spaced modes.
2) Theoretical values of the first natural frequency determined using LST EN 1991-2/AC specifications are 6.81 Hz and 8.50 Hz for spans 2 and 3, respectively. The measured natural frequencies (mode 2) for both spans showed relatively good agreement with analytical predictions (within 5 % and 7 %, respectively). Experimental values are within the allowable limits 3.93-9.86 Hz specified in LST EN 1991-2/AC.
3) Vertical and lateral maximum peak responses of forced vibrations are 0.9 m/s2 for span 2 and 1.03 m/s2 for span 3.
These values are significantly lower the limit maximum value of 3.50 m/s2 indicated in LST EN 1991-2/AC standard.
4) Studies have shown that the bridge meets safety requirements and has enough reserve for operation.
References
-
Zhao J., DeWolf J. T. Dynamic monitoring of steel girder Highway Bridge. Journal of Bridge Engineering, Vol. 7, Issue 6, 2002, p. 350-356.
-
Xu Y. L., Ko J. M., Zhang W. S. Vibration studies of Tsing Ma suspension bridge. Journal of Bridge Engineering, Vol. 2, Issue 4, 1997, p. 149-156.
-
Brownjohn J. M. W., Moyo P., Omenzetter P., Lu Y. Assessment of Highway Bridge upgrading by dynamic testing and finite-element model updating. Journal of Bridge Engineering, Vol. 8, Issue 3, 2003, p. 162-172.
-
Xia H., Zhang N. Dynamic analysis of Railway Bridge under high-speed trains. Computers and Structures, Vol. 83, Issue 23-24, 2005, p. 1891-1901.
-
Zhai W. M., Cai C. B., Wang K. Y. Numerical simulation and field experiment of high-speed train-track-bridge system dynamics. Vehicle System Dynamics Supplement, Vol. 41, 2004, p. 677-686.
-
Lin C. W., Yang Y. B. Use of a passing vehicle to scan the fundamental bridge frequencies: An experimental verification. Engineering Structures, Vol. 27, Issue 13, 2005, p. 1865-1878.
-
Xia H., Yang N., Gao R. Experimental analysis of Railway Bridge under high-speed trains. Journal of Sound and Vibration, Vol. 282, Issue 1-2, 2005, p. 517-528.
-
Kim C. W., Kawatani M., Kim K. B. Three-dimensional dynamic analysis for bridge-vehicle interaction with roadway roughness. Computers and Structures, Vol. 83, Issue 19-20, 2005, p. 1627-1645.
-
Kumar R., Rao M. V. B. Prestressed Concrete Bridges in India. Assessing their structural integrity using proof load testing and frequency response method. Concrete International, Vol. 25, Issue 10, 2003, p. 75-81.
-
Fryba L., Pirner M. Load tests and modal analysis of bridges. Engineering Structures, Vol. 23, Issue 1, 2001, p. 102-109.
-
Brencich A., Gambarotta L. Assessment procedure and rehabilitation of riveted railway girders: The Campasso Bridge. Engineering Structures Vol. 31, 2009, p. 224.
-
Caglayan O., Ozakgul K., Tezer O. Assessment of existing steel railway bridges. Journal of Constructional Steel Research, Vol. 69, 2012, p. 54.
-
Ermopoulos T., Spyrakos C. C. Validated analysis and strengthening of a 19th century railway bridge. Engineering Structures, Vol. 28, 2006, p. 792.
-
Hai D. T. Current status of existing railway bridges in Vietnam: an overview of steel deficiencies. Journal of Constructional Steel Research 62, 2006, p. 987.
-
Johansson Ch. Simplified dynamic analysis of railway bridges under high-speed trains. Licentiate Thesis, KTH School of ABE, Stockholm, Sweden, 2013, p. 78.
-
Fryba L. Dynamics of Railway Bridges. London (UK), Thomas Telford Ltd, 1996, p. 332.
-
Goicolea J., Domínguez J., Gabaldón F., Navarro J. Resonant effects in short span high speed railway bridges: modelling and design issues. Structural Dynamics-Eurodyn, Vol. 2, Taylor & Francis, 2002, p. 1077.
