Abstract
In this paper measurement of stresses in vibrating elements of the printing device using photo-elastic techniques is investigated. Numerical procedure is applied to obtain data which is needed for the interpretation of experimental results of time averaged photoelasticity when sinusoidal vibrations according to the eigenmode of the structure in the problem of plane stress take place. The results obtained from this numerical procedure correspond with the results obtained analytically earlier. The numerical procedure is also applied to obtain data which is needed for interpretation of experimental results when the structure is slowly loaded from the status of equilibrium by linearly increasing the load till its final value. Experimental measurements of stresses in polymeric films have been performed. Qualitative investigations of stresses of samples of LDPE films were performed by taking into account the level of stresses in unloaded samples as well as in samples experiencing tensile loading. Samples of LDPE films having various characteristics were analyzed. In order to obtain photoelastic images representing stress distributions in the investigated polymeric films the experimental setup was developed. In the loaded samples of the investigated films of LDPE type higher order photoelastic fringes are observed. They enable to interpret stress distributions in the films. This is especially important in the process of operation of the printing device. The obtained results are used in the process of measurements of stresses in the elements of a printing device.
1. Introduction
The investigations about time averaging in photoelasticity presented in this paper are based on the material presented in [1]. In this previous paper the data which is necessary to interpret experimental results of time averaged photoelasticity were obtained on the basis of analytical investigations based on manipulation of integrals and using the zeroth order Bessel function of the first kind. In this paper numerical procedure is applied to obtain data which is needed for the interpretation of experimental results of time averaged photoelasticity when sinusoidal vibrations according to the eigenmode of the structure in the problem of plane stress take place. The results obtained from this numerical procedure correspond with the results obtained analytically in the previous paper. The numerical procedure is also applied to obtain data which is needed for interpretation of experimental results when the structure is slowly loaded from the status of equilibrium by linearly increasing the load till its final value.
Some experimental findings of distribution of stresses in flat clear polymeric plates using photo-elastic method of investigations are presented in the papers [2-10]. The authors mostly analyze the effect at melting, molding or cooling temperatures, pressure, time and other parameters to the level of stresses.
Experimental measurements of stresses in polymeric films have been performed. Qualitative investigations of stresses of samples of LDPE films were performed by taking into account the level of stresses in unloaded samples as well as in samples experiencing tensile loading. Samples of LDPE films having various characteristics were analyzed. In order to obtain photoelastic images representing stress distributions in the investigated polymeric films the experimental setup was developed. The basic part of the experimental setup is „General Purpose Strain Viewer“. Photoelastic images representing stress distributions were registered by using a digital camera.
In the loaded samples of the investigated films of LDPE type higher order photoelastic fringes are observed. They enable to interpret stress distributions in the films. This is especially important in the process of operation of the printing device. An experienced operator of the printing device from the typical photoelastic fringe patterns can judge about the distribution of stresses in the polymeric film. When the stresses become excessive and stress concentration takes place there is danger that the polymeric film may experience defects (residual strains and tears). Thus when the operator of the printing device notices from the photoelastic images that such a critical situation is approaching, he is to immediately stop the process of printing and make necessary adjustments.
The obtained results are used in the process of interpretation of stress measurements in photoelastic experiments and for measurement of stresses in the elements of a printing device.
2. Measurement of stresses in time averaged photoelasticity
2.1. Measurement of stresses when the structure performs vibrations according to the eigenmode
Intensity of the static image for the circular polariscope is expressed as:
where is a product of a constant which depends on the thickness and material of the structure with the difference of principal stresses.
Intensity of the time averaged image for the circular polariscope is expressed as:
where is a product of a constant which depends on the thickness and material of the structure with the difference of principal stresses in the state of extreme deflections according to the eigenmode, is a large integer number.
Further the roots of the equation:
are denoted by .
Also the roots of the equation:
are denoted by .
Variations of intensities as functions of are presented in Fig. 1. Variations of derivatives of intensities with respect to as functions of are presented in Fig. 2. Variation of as a function of is presented in Fig. 3. The values of and are presented in Table 1.
Fig. 1I and I- as functions of C
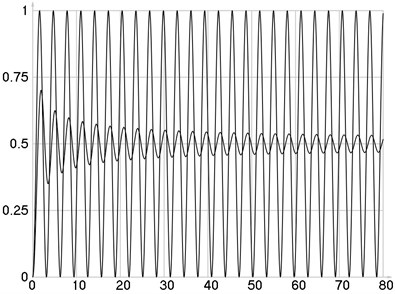
Fig. 2dI/dC and (dI ̅)/dC as functions of C
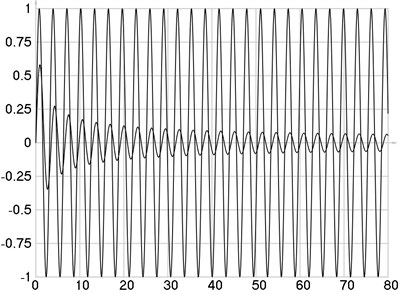
Fig. 3C-i-Ci as a function of i
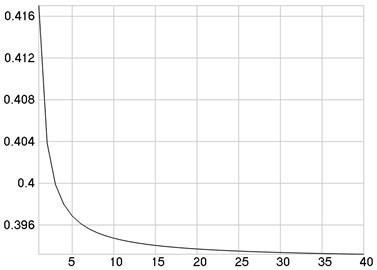
Table 1Values of Ci and C-i
1 | 0.785398 | 1.20241 |
2 | 2.35619 | 2.76004 |
3 | 3.92699 | 4.32686 |
4 | 5.49779 | 5.89577 |
5 | 7.06858 | 7.46546 |
6 | 8.63938 | 9.03553 |
7 | 10.2102 | 10.6058 |
8 | 11.781 | 12.1762 |
9 | 13.3518 | 13.7467 |
10 | 14.9226 | 15.3173 |
11 | 16.4934 | 16.8879 |
12 | 18.0642 | 18.4585 |
13 | 19.635 | 20.0292 |
14 | 21.2058 | 21.5999 |
15 | 22.7765 | 23.1706 |
16 | 24.3473 | 24.7413 |
17 | 25.9181 | 26.312 |
18 | 27.4889 | 27.8828 |
19 | 29.0597 | 29.4535 |
20 | 30.6305 | 31.0242 |
In the previous paper the data which is necessary to interpret experimental results of time averaged photoelasticity were obtained on the basis of analytical investigations based on integrals and using the zeroth order Bessel function of the first kind. The results obtained in this paper correspond with the results obtained analytically in the previous paper and the numerical procedure does not require sophisticated mathematical techniques.
2.2. Measurement of stresses when the structure is slowly loaded from the status of equilibrium by linearly increasing the load till its final value
Intensity of the time averaged image for the circular polariscope is expressed as:
where is a product of a constant which depends on the thickness and material of the structure with the difference of principal stresses at the final value of the load.
Variations of intensities as functions of are presented in Fig. 4. Variations of derivatives of intensities with respect to as functions of are presented in Fig. 5. Variations of the values of and as functions of are presented in Fig. 6. The values of and are presented in Table 2.
Fig. 4I and I- as functions of C
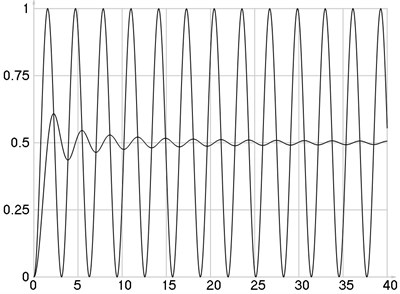
Fig. 5dI/dC and (dI ̅)/dC as functions of C
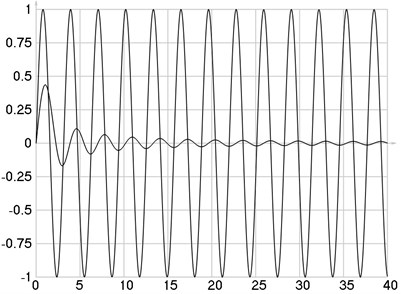
Fig. 6Ci and C-i as functions of i
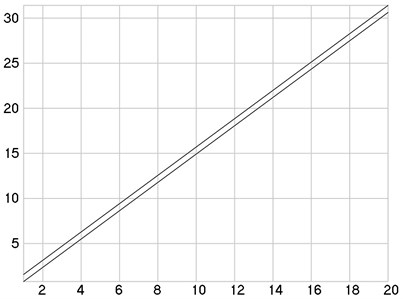
Table 2Values of Ci and C-i
1 | 0.785398 | 1.5708 |
2 | 2.35619 | 3.14159 |
3 | 3.92699 | 4.71239 |
4 | 5.49779 | 6.28319 |
5 | 7.06858 | 7.85398 |
6 | 8.63938 | 9.42478 |
7 | 10.2102 | 10.9956 |
8 | 11.781 | 12.5664 |
9 | 13.3518 | 14.1372 |
10 | 14.9226 | 15.708 |
11 | 16.4934 | 17.2788 |
12 | 18.0642 | 18.8496 |
13 | 19.635 | 20.4204 |
14 | 21.2058 | 21.9911 |
15 | 22.7765 | 23.5619 |
16 | 24.3473 | 25.1327 |
17 | 25.9181 | 26.7035 |
18 | 27.4889 | 28.2743 |
19 | 29.0597 | 29.8451 |
20 | 30.6305 | 31.4159 |
Thus the numerical procedure enables to obtain the data required for the interpretation of photoelastic measurements without the need of complicated mathematical techniques, which could be based on the use of the generalized zeroth order Bessel function of the first kind.
From the obtained results a constant shift 0.785398 between the corresponding values of the roots of equations is observed from the data presented in the Table. Of course in order to prove if this is exactly true the strict mathematical investigation based on the generalized zeroth order Bessel function of the first kind would be required.
3. Experimental measurements of stresses in polymeric films
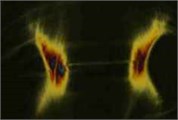
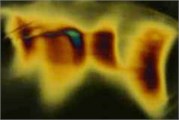
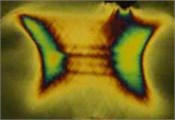
Qualitative investigations of stresses of samples of LDPE films were performed by taking into account the level of stresses in unloaded samples as well as in samples experiencing tensile loading. Samples of LDPE films having various characteristics were analyzed, they had the thickness varying from 8 μm up to 180 μm. In order to obtain photoelastic images representing stress distributions in the investigated polymeric films the experimental setup with „General Purpose Strain Viewer“ shown in Fig. 7 was used. Photoelastic images representing stress distributions were registered by using the digital camera EO-1312c. Some of the obtained results are presented in Fig. 8.
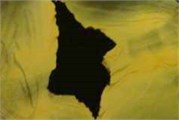
From the obtained results of experimental investigations one can see that only when the thicknesses of the film are 150 µm and 180 µm in the unloaded samples of the films there are stresses which occured in the process of production of the films. While in the films of smaller thicknesses there are no observable stresses from the process of production of the films. With the increase of the thickness of the films of LDPE type in the loaded samples higher order photoelastic fringes are observed. They enable to interpret stress distributions in the films.
Fig. 7View of the experimental setup used for photoelastic stress analysis of LDPE polymeric films: 1 – General Purpose Strain Viewer, 2 – tested material, 3 – USB digital camera EO-1312c
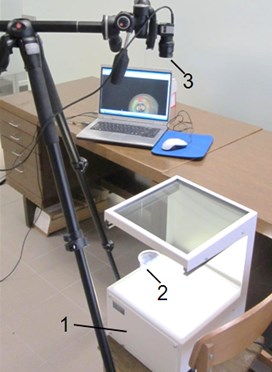
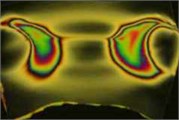
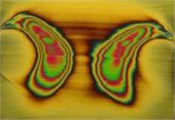
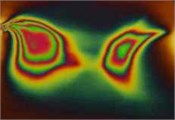
Fig. 8Photoelastic images representing stress distributions of samples of polymeric film of LDPE type of various thicknesses in unloaded and loaded conditions: a), c), e), g), i), k), m) – photoelastic images representing distributions of stresses of samples of unloaded film of LDPE type; b), d), f), h), j), l), n) – photoelastic images representing distributions of stresses of samples of loaded film of LDPE type

a) 8 µm
b) 8 µm
c) 25 µm
d) 25 µm

e) 45 µm
f) 45 µm

g) 50 µm
h) 50 µm

i) 80 µm
j) 80 µm
k) 150 µm
l) 150 µm

m) 180 µm
n) 180 µm
4. Conclusions
In the previous paper the data which is necessary to interpret experimental results of time averaged photoelasticity were obtained on the basis of analytical investigations based on integrals and using the zeroth order Bessel function of the first kind. The results obtained in this paper correspond with the results obtained analytically in the previous paper and the numerical procedure does not require sophisticated mathematical techniques.
Numerical procedure of the same type is applied to obtain data which is needed for interpretation of experimental results when the structure is slowly loaded from the status of equilibrium by linearly increasing the load till its final value. Thus the numerical procedure enables to obtain the data required for the interpretation of photoelastic measurements without the need of complicated mathematical techniques, which could be based on the use of the generalized zeroth order Bessel function of the first kind.
From the obtained results a constant shift between the corresponding values of the roots of equations is observed. In order to prove if this is exactly true the strict mathematical investigation based on the generalized zeroth order Bessel function of the first kind would be required.
The obtained results are used in the process of interpretation of stress measurements in photoelastic experiments and a numerical procedure of the proposed type might be applied to other time averaging problems in a similar way.
Experimental measurements of stresses in polymeric films on a specially developed experimental setup have been performed. Qualitative investigations of stresses of samples of LDPE films were performed by taking into account the level of stresses in unloaded samples as well as in samples experiencing tensile loading. Samples of LDPE films having various characteristics were analyzed, they had the thickness varying from 8 μm up to 180 μm.
From the obtained results of experimental investigations one can see that only when the thicknesses of the film are 150 µm and 180 µm in the unloaded samples of the films there are stresses which occured in the process of production of the films. While in the films of smaller thicknesses there are no observable stresses from the process of production of the films. With the increase of the thickness of the films of LDPE type in the loaded samples higher order photoelastic fringes are observed. They enable to interpret stress distributions in the films. This is especially important in the process of operation of the printing device. When the operator of the printing device notices from the photoelastic images that a critical situation is approaching, he is to immediately stop the process of printing and make necessary adjustments.
The obtained results are used in the process of measurements of stresses in the elements of a printing device.
References
-
Ragulskis M., Ragulskis L. On interpretation of fringe patterns produced by time average photoelasticity. Experimental Techniques, Vol. 29, Issue 3, 2005, p. 48-51.
-
Rossini N. S., Dassisti M., et al. Methods of measuring residual stresses in components. Materials & Design, Vol. 35, Issue 3, 2012, p. 572-588.
-
Parlevliet P., Bersee H. E. N., Beukers A. Residual stresses in thermoplastic composites – a study of the literature – Part II: Experimental techniques. Composites Part A: Applied Science and Manufacturing, Vol. 38, Issue 3, 2007, p. 651-665.
-
Mittal R. K., Khan A. Effect of various parameters on residual stresses in transparaent polymeric tubes. International Polymer Processing, Vol. 5, Issue 2, 1990, p. 142-148.
-
Postawa P., Kwiatkowski D. Residual stress distribution in injection molded parts. Journal of Achievements in Materials and Manufacturing Engineering, Vol. 18, Issue 2, 2006, p. 172-174.
-
Wang T., Young W. B. Study on residual stresses of thin-walled injection molding. European Polymer Journal, Vol. 41, Issue 10, 2005, p. 2511-2517.
-
Karalekas D. E., Agelopoulos A. On the use of stereolithography built photoelastic models for stress analysis investigations. Materials & Design, Vol. 27, Issue 2, 2006, p. 100-106.
-
Kim S. Y., Kim C. H., et al. Measurement of residual stresses in film insert molded parts with complex geometry. Polymer Testing, Vol. 28, Issue 5, 2009, p. 500-507.
-
Weng C., Lee W. B., To S. Birefringence techniques for the characterization of residual stresses in injection-moulded micro-lens arrays. Polymer Testing, Vol. 28, Issue 7, 2009, p. 709-714.
-
James M. N., Christoper C. J., Lu Y., Patterson E. A. Fatigue crack growth and craze-induced crack tip shielding in polycarbonate. Polymer, Vol. 53, Issue 7, 2012, p. 1558-1570.
About this article

