Abstract
To improve the efficiency of the structural nonlinear vibration reliability optimization, the solution of the structural reliability index is converted into the corresponding unconstrained optimization problem by combining with the penalty function method through the analysis of the geometric meaning. And a novel ant colony algorithm is employed to solve the optimization problem. The introduction of ants transfer strategy makes the algorithm expand the search range in the early phase, and improve the convergence rate in the late which can overcome the defects of precocity and stagnation. Finally, the improved ant colony algorithm was used to find the shortest failure paths of the structure. Engineering practice and comparison with other algorithms demonstrate the strong applicability and validity of the method.
1. Introduction
The application of reliability in structural design began in the 1940s. The calculation of structural reliability is the core content of structural design, and many approximate calculation methods have been proposed in recent years [1-6]. Calculation methods of reliability indexes commonly used in engineering include First Order Second Moment method, JC method, Gradient Optimization method, Response Surface method, Monte Carlo method and Stochastic Finite Element method, which play an important role in the reliability analysis of engineering structures. But in the actual engineering reliability analysis, the use of these methods often encounters many difficult problems, such as the limit state surface is difficult to parse and describe, effective search of solution space is difficult to achieve for finding out the shortest distance from standard normal space origin to limit state surface, and the weakest failure paths. In recent years, a number of new intelligent algorithms gradually have risen and aroused widespread interest of the majority of scholars, and ant colony optimization algorithms is one of them. The algorithm makes comprehensive use of positive feedback, distributed computing, and the greedy inspired search technology, which can be used to solve the general forms of the non-convex and nonlinear constrained optimization problems, and shows unique advantages in solving the combinatorial optimization problems. Therefore, the ant colony algorithm was employed to the structure nonlinear vibration reliability analysis.
Due to random factors, whether predetermined function of the structure can be completed in the future is unable to be prior explicitly judged, while only the completion possibility level of its predetermined function can be determined. The higher possibility level leads to more reliable structure, and vice versa. Therefore, the reliability of structure is measured by probability both at home and abroad, which is defined as the probability to complete the predetermined function within a predetermined time and a predetermined condition [7-10]. The reliability of structure is gradually developed in engineering practice based on reorganization of uncertain factors, such as loading and materials, which is indispensable in structural design.
According to this, we proposed an improved ant colony optimization algorithm and employed it to the solution of the failure paths searching and the reliability index obtaining. This study can provide an effective method for the structure nonlinear vibration reliability analysis.
The rest of the paper is organized as follows. First, the improved algorithm was proposed after the introduction of the basic knowledge of ant colony optimization algorithm. Then, it was employed to the engineering practice. Finally, the efficiency of the improved algorithm was demonstrated through the engineering practice and comparison with other algorithms.
2. Improved ant colony algorithm
2.1. Summary of basic ACO
Ant colony algorithm, proposed by M. Dorigo, V. Maniezzo and A. Colorni in the early 1990s, is a group of the intelligent optimization algorithms, which made significant effects in solving the TSP problem with the characteristics of the NP-hard in early stage, where traditional optimization methods were difficult to work, thereafter the algorithm is widely concerned by academia and industry [11-13]. The ant colony algorithm does not involve the partial derivatives of the objective function, and is able to overcome shortcoming of the other algorithm to fall into local optimum, thus possessing strong adaptability. Currently, the ant colony algorithm has been successfully applied to structural optimization, communication networks, vehicle scheduling, construction engineering and many other fields [14-19].
Here an example of the classic TSP problem is used to elaborate the ant colony system model. For other problems, the model can be used by a little change , where is the number of ants in the colony, accounts for the number of ants in the city at time . is the distance between city and city , accounts for residual amount of information on the path at time . In the initial time, the pheromone on each path is equal and is assumed as a constant The ant decides to shift the direction according to the pheromone on the path, and accounts for the probability of ant transfers from the city to the city at time :
where is the cities that the ant is allowed to select in the next step, and is used to record the cities the ants have traversed, which will be dynamically adjusted with the evolution process. Through the moments, the ants complete a path traversal, and the pheromone on each path will be adjusted according to the formula:
where is the pheromone evaporation coefficient, is the pheromone left on the path by the ant in the cycle, and accounts for the increment of the pheromone on the path in the cycle.
2.2. Improvement of ACO
In order to overcome the deficiencies of the ant colony algorithm, a dynamic combination of the pheromone and heuristic information is considered here to control the weights of respective share by time, so as to achieve the purpose of broadening the search scope in the prophase, and improving the convergence rate in the late stage.
The improved selection strategy of ants is following:
where is the dynamic weight, whose range is . will be adjusted and changed in real time with the search process of ants, so that the ants could maintain a balance between the “exploration” and “utilization”. The following gradient functions can be chosen:
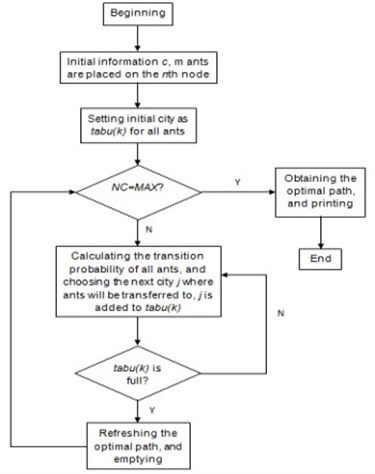
where is a constant, and is different values for the corresponding step function. If the optimal solution obtained in a period of time does not change, the added pheromone should be reduced, that is, the value of is raised to make it escape from the local minimum point. To avoid falling into local optimal solution in the early search stage, an appropriate amount of negative feedback is added into the search process and a less value of is chosen to expand the search range of the algorithm. Fig. 1 shows the flowchart of the improved ant colony algorithm.
Fig. 1The framework of the improved ant colony algorithm
2.3. Simulation analysis of algorithm
We verify the better search capability and stability of the improved ant colony algorithm than that of the basic ant colony algorithm by simulation experiments. Both algorithms are run for 10 times, and each time the maximum number of iterations is 200. Table 1 shows the parameter settings of the basic ant colony algorithm and the improved ant colony algorithm. The experiments solve the problems for Oliver30 and d1291 by the improved ant colony algorithm and the basic ant colony algorithm, and the simulation results are shown in Fig. 2 and Table 2.
Fig. 2Evolutionary graph on problem Oliver30 and d1291
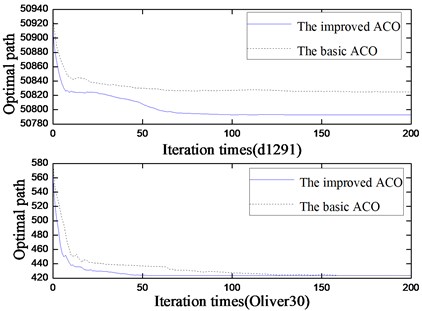
Table 1Parameter settings of the experiments
The basic ant colony algorithm | The improved ant colony algorithm | |||||||||||
1 | 5 | 0.5 | 100 | 3 | 5 | 0.5 | 100 | 0.1 | 0.5 | 0.9 | 50 | 150 |
Table 2Comparative table of the simulation results
TSP problem | The basic ant colony algorithm | The improved ant colony algorithm | ||||
Optimal solution | Average solution | Average evolution algebra | Optimal solution | Average solution | Average evolution algebra | |
Oliver30 | 423.9117 | 428.9525 | 128 | 423.6472 | 424.4861 | 59 |
d1291 | 50825.1094 | 50875.5165 | 137 | 50793.8162 | 50831.5168 | 71 |
According to the experimental results, compared with the basic ant colony algorithm, the optimal solution and the average evolution algebra of the improved ant colony algorithm have been increased, indicating that the improved algorithm can search for the better solution, and global convergence has been enhanced. Moreover, the average solution of the improved ant colony algorithm here is greater than that of the basic ant colony algorithm, indicating that stability of the improved algorithm has also been enhanced.
3. Engineering practice
Here, we conduct analysis of nonlinear vibration and solving of reliability index on the simply supported concrete beam with an edge crack. The geometry size and material constant of the beam are: , , and . The schematic diagram of the beam with the edge crack is shown in Fig. 3.
Fig. 3Model of a cracked beam

As shown in Fig. 3, the crack beam is under the action of bending moment , the crack location is , its geometry and material characteristic value is the cross section area , beam length is , height is , width is , moment of inertia is , beam density is , Poisson ratio is and modulus of elasticity is . Analyze this module by Euler Bernoulli beam with boundary surface crack, and transfer the vibration problem of the beam containing crack into the vibration problem that elastic hinge coupling two elastic beams. The formula of the bending beam is:
As a result of the existence of crack, establish two functions on the right and left sides of the crack , given , in which , the result can be obtained:
In which: , refers to the mode of vibration.
(1) The boundary condition:
when , , .
when , , .
(2) Internal continuity condition:
when , , , .
(3) Compatibility condition:
when .
We can obtain homogeneous equation: . Suppose the determinant equals to zero, we can obtain . Finally, given the crack depth and location, we can get: , thus the crack beam function is obtained.
3.1. Calculation result of cracked beam
When the crack at , the crack depth are respectively: , 0.3 and 0.5. The numerical analysis and calculation results are as follows:
(1) From Table 3, we can get the following conclusion: with the increase of crack depth, the natural frequency of cracked beam in case of () is decreased gradually. Table 3 shows that the natural frequency of even order doesn’t change basically, so we choose positive symmetrical function to calculate explicit equation.
(2) Influence of various crack depths on the mode shape of cracked beam.
Table 3Non-dimensional natural frequencies of simply supported beam with an edge crack
Crack depth | |||||
0 | 0.1 | 0.3 | 0.5 | 0.8 | |
1 | 3.1415 | 3.1163 | 2.8966 | 2.4163 | 1.2531 |
2 | 6.2831 | 6.2831 | 6.2831 | 6.2831 | 6.2831 |
3 | 9.4247 | 9.3509 | 8.8473 | 8.2643 | 7.8796 |
4 | 12.5663 | 12.5663 | 12.5663 | 12.5663 | 12.5663 |
5 | 15.7079 | 15.5879 | 14.9194 | 14.3980 | 14.1519 |
Seen from Fig. 4, along with the increase of crack depth, the influence on the mode shape of cracked beam is increased gradually.
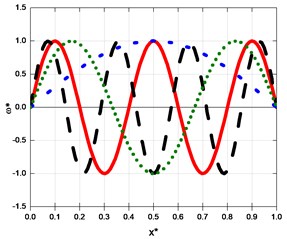
When the crack depth is not big, the mode shape of cracked beam and crack-free beam are almost the same. Fig. 5 shows the odd-order mode shape in case of . And Fig. 4 indicates that in case of , the influence of crack on the mode shape are particularly obvious, mainly because with the bigger rack depth, the local rigidity at the crack are bigger consequently.
Fig. 4Comparison of the first-order mode shapes for various cracks depths
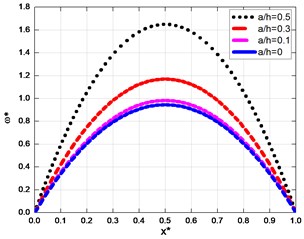
Fig. 5The first, third, fifth and seventh-order mode shapes of a crack beam in case of a/h=0.1
3.2. Calculation result of explicit equation
The explicit equation of first-order nonlinear mode shape of cracked simply supported beam is:
Hence, the following analysis and calculation are conducted.
(1) Change in the non-linear frequencies with different given first function coefficient .
It can be seen from the Table 4 that as the given first function coefficient increases, the calculated non-linear frequencies increase consequently.
(2) Comparison of explicit equation of cracked beam and that of crack-free beam mode shape.
Fig. 6Comparison of linear and the non-linear first mode shape for a simply supported beam
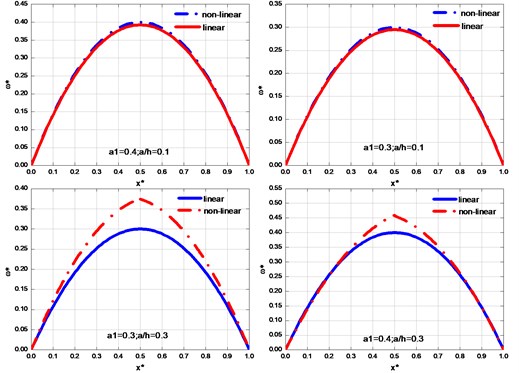
As we can see in Fig. 6: (1) under the condition of unchanged given first function coefficient , along with the increase of crack depth, the maximum displacement increases; the mode shape of non-liner function becomes steepening, in addition, when the change of crack position is sharper near the border, the change of non-liner vibration is less than the liner vibration, while as the closer the crack position is, the bigger the non-linear mode shape is than the liner mode shape. (2) Under a certain crack depth, with the increasing of the given first function coefficient , both the non-linear function curvature and maximum displacement will increase.
Table 4Comparison of the non-linear vibration frequencies
Crack depth | |||
0.1 | 0.3 | 0.5 | |
0.05 | 9.6519 | 7.8134 | 4.8858 |
0.2 | 9.9341 | 8.2159 | 6.1067 |
0.3 | 10.2983 | 8.7237 | 7.4287 |
0.4 | 11.3857 | 10.1799 | 10.6041 |
3.3. Reliability analysis on cracked beam
To verify whether the efficiency of the algorithm proposed, we employed it to the reliability analysis of this cracked beam.
3.3.1. Calculation model of reliability index based on improved ACO
From structural reliability theory, geometric significance of reliable indicators can be defined as the shortest distance of the origin of coordinates to a limit state surface in the coordinate space of standard normal. Therefore, the problem of solving reliable indicators is changed to the problem of solving the minimum value in the following:
In the Equitation (9), is the random variable of the structure, accounts for limit state equations composed of the above variables, and , are mean values and standard deviations of random variable , respectively.
The Eq. (9) is converted to the corresponding unconstrained optimization problem by Penalty function method, as following:
where is corresponding penalty factor (an enough large positive number), the corresponding items are penalty items.
3.3.2. Find shortest failure paths based on improved ACO
The failure path is defined as any path between the state of the initial structure and the state of structure failure. For a structure, there are multiple failure paths, and each failure path includes a plurality of structural units. The weakest failure path is a path that the structural units successively turn failure with minimum reliability index until the entire structural system fails.
For ant colony algorithm to solve TSP problem, is heuristic information, and is the distance between city and city . Thus, when through the improved ant colony algorithm to find the paths of structural failure, heuristic information is assumed as , where is reliable indicator of the structural unit, is the number of ants.
The steps to find the failure paths by the improved ant colony algorithm are as follows:
(1) Initializing parameters .
(2) ants are placed to structure units.
(3) Calculating the probability for each ant to move to the next structure unit by the Eq. (4), and selecting moving direction of ants according to the probability.
(4) Modifying the tabu list, that is, the ant is transferred to the next city after choosing, and the city is placed at the tabu list of the individual ant.
(5) If the cities in the collection has finished traversing, that is , skipping to the step (3). Otherwise, it will execute the step (6).
(6) Updating the amount of information on the paths based on the Eq. (2) and the Eq. (3).
(7) If a shutdown condition is met, the loop ends and the calculation result is output. Otherwise, emptying the tabu list and skipping to the step (2).
3.3.3. Solution of reliability indexes
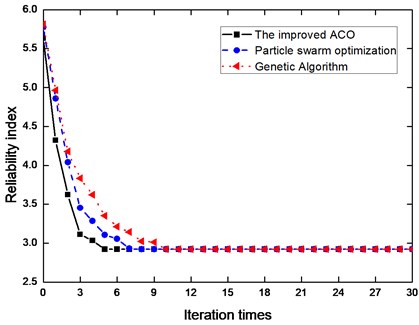
Under the premise of using improved ant colony algorithm to find the failure paths, it also is used to solve reliability index. We adopt the proposed improved ant colony algorithm to calculate the reliability indexes of the structure, among which, the set ant number is for 30 iterations. Iterative convergence process of the improved ant colony algorithm is shown in Fig. 7, which shows the improved ACO algorithm converges to achieve the optimal solution in the 6th iteration process. The result obtained by JC method is , the result obtained by PSO method is [20], the result obtained by GA method is [21], and the result obtained by the method we introduced is . Compared the former data, they are consistent. Moreover, iterative convergence speed of the improved ant colony algorithm is fast, and simply setting a small number of ants can achieve better computational accuracy, and the algorithm has good applicability to deal with complex and limit state equations of problems.
Fig. 7The iterative process
4. Conclusions
The structural nonlinear vibration reliability analysis is the essential part in the structural design. This paper finds the weakest failure path, and then solves the reliability index of the structure through the improved ant colony algorithm. Compared with the calculation results, the improved ant colony algorithm for the calculation of structural reliability index is feasible. The improved ant colony algorithm can overcome the restriction of traditional method which is applicable only to convex function and cumbersome derivation process. In computational accuracy and efficiency, the ant colony algorithm can meet the project requirements, having strong applicability and certain application value.
References
-
Stefania A. Reliability based approach for structural design and assessment: performance criteria and indicators incurrent European codes and guidelines. Int. J. Lifecycle Performance Engineering, Vol. 1, Issue 1, 2012, p. 64-91.
-
Frangopol D. M., Strauss A. Bridge reliability assessment based on monitoring. Journal of Bridge Engineering, Vol. 13, Issue 3, 2008, p. 258-270.
-
Han S. W., Kim W. T., Foutch D. A. Seismic behavior of HSS bracing members according to width-thickness ratio under symmetric cyclic loading. Journal of Structural Engineering, Vol. 133, Issue 2, 2007, p. 264-273.
-
Ibarra L. F., Medina R. A., Krawinkler H. Hysteretic models that incorporate strength and stiffness deterioration. Earthquake Engineering and Structural Dynamics, Vol. 34, Issue 12, 2005, p. 1489-1511.
-
Petrini F., Manenti S., Gkoumas K., Bontempi F. Structural design and analysis of offshore wind turbines from a system point of view. Wind Engineering, Vol. 34, Issue 1, 2010, p. 85-108.
-
Lehman D. E., Roeder C. W., Herman D., Johnson S., Kotulka B. Improved seismic performance of gusset plate connections. Journal of Structural Engineering, Vol. 134, 2008, p. 840-901.
-
Arangio S., Bontempi F., Ciampoli M. Structural integrity monitoring for dependability. Structures and Infrastructures, Vol. 7, Issue 1-2, 2011, p. 75-86.
-
Crosti C. Structural analysis of steel structures under fire loading. Acta Polytechnica, Vol. 49, Issue 1, 2009, p. 21-28.
-
Stefania A. Reliability based approach for structural design and assessment: performance criteria and indicators in current European codes and guidelines. International Journal of Lifecycle Performance Engineering, Vol. 1, Issue 1, 2012, p. 64-91.
-
Vrouwenvelder T., Scholten N. Assessment criteria for existing structures. Structural Engineering International, Vol. 20, Issue 1, 2010, p. 62-65.
-
Soheil G., Nikbakhsh J. An ant colony algorithm for solving fixed destination multi-depot multiple traveling salesmen problem. Journal Applied Soft Computing, Vol. 11, Issue 1, 2011, p. 10-16.
-
Dorigo M., Gambardella L. M. Ant colony system: a cooperative learning approach to the traveling salesman problem. IEEE Transactions on Evolutionary Computation, Vol. 1, Issue 1, 1997, p. 53-66.
-
Pablo R., Ismael R., Rubio F. Studying the application of ant colony optimization and river formation dynamics to the Steiner tree problem. Evolutionary Intelligence, Vol. 4, Issue 1, 2011, p. 51-65.
-
Kaveh A., Hassani B., Shojaee S., Tavakkoli S. M. Structural topology optimization using ant colony methodology. Engineering Structures, Vol. 30, Issue 9, 2008, p. 2559-2565.
-
Zhang Z., Li H., Huang L. The structural topology optimization based on ant colony optimization. Chinese Journal of Applied Mechanics, Vol. 28, Issue 3, 2011, p. 226-231.
-
Ahuja A., Pahwa A. Using ant colony optimization for loss minimization in distribution networks. Proceedings of the 37th Annual North American Power Symposium, Ames, Iowa, 2005.
-
Aghababa M. P., Amrollahi M. H., Borjkhani M. Application of GA, PSO, and ACO algorithms to path planning of autonomous underwater vehicles. Journal of Marine Science and Application, Vol. 11, Issue 3, 2012, p. 378-386.
-
Suo J. J. Study on disambiguation by statistical and logical reasoning. Advanced Materials Research, Vol. 108-111, 2010, p. 1080-1085.
-
Mohan B. C., Baskaran R. A survey: ant colony optimization based recent research and implementation on several engineering domain. Expert Systems with Applications, Vol. 39, Issue 4, 2011, p. 4618-4627.
-
Kennedy J., Eberhart R. Particle swarm optimization. Proceedings of the IEEE International Conference on Neural Networks, Perth, Australia, 1995.
-
Xie G., Zhang J., Li J. Slope reliability analysis based on improved genetic algorithm. Rock and Soil Mechanics, Vol. 30, Issue 6, 2009, p. 283-288.
About this article
The work was supported by Natural Science Foundation of Hebei Province, China. (No. E2012402030) and the Program of Selection and Cultivating of Disciplinary Talents of Colleges and Universities in Hebei Province (BR2-206) and the Foundation of Hebei Housing and Urban Rural Construction Committee (2009-128).
