Abstract
In order to improve the sound insulation performance of the magnesium alloy dash panel at medium and low frequency, the FE-SEA hybrid method was employed to numerically calculate the sound transmission loss of the dash panel, which was subsequently compared with the experimental result and eventually proved the feasibility of this numerical method. Subsequently, through analysis on the modal contribution, the speed vibration modes at the natural frequencies were extracted, and the key sound-transmission areas were identified. Through combined considerations of both the vibration-isolating and the sound-absorbing characteristics, the parallel periodic sound-package structure was proposed, whose basic theory was deduced by reference to phononic crystals. Moreover, a reverberation box was designed and manufactured so as to test the sound transmission loss of specimens with small sectional dimensions, such as the periodic sound-package structure, and the reliability of the predicting method was simultaneously verified. Additionally, manually weaving the parameters of the periodic sound-package structure could maximally improve its sound insulation characteristic, and changing the traditional parallel structure into the staggered and skewed laying manner could upgrade the vibration-isolating and sound-absorbing effect. Finally, this noise-reducing scheme was applied to the magnesium alloy dash panel, where in the medium and low frequency noise was rapidly optimized.
1. Introduction
Magnesium alloys, with small density, high specific stiffness and strength, as well as excellent damping attenuation property, prove favorably suitable for vibration and noise reduction. Consequently, some non-structural parts of automotives are increasingly being replaced by light-weight magnesium alloys, with a successful application on the dash panel at present, which serves as an isolating component between the engine and the operator cab, and the improvement of its sound insulation performance exhibits a very important significance.
The finite element method (FEM) and the boundary element method (BEM) exhibit accurate predictive capability at low frequency, but at high frequency, it will get too time-consuming, difficult to solve and to predict with high accuracy due to the relatively large freedom degree and intensive modals. The statistical energy analysis (SEA) method [1-3], which is based on the weak coupling assumption and enormous amount of modal information, proves suitable for the high frequency bands with intensive modals. For the acoustic problems arising in the use of the dash panel at medium and low frequency, the FE-SEA hybrid method [4-5] was proposed to conduct prediction and identify the key sound-transmission areas, which provided certain foundation for the subsequent rapid optimization.
Traditional noise solutions exhibit obvious high-frequency noise reduction effect, nevertheless, the attenuation extent of the medium and low frequency in the structure with distance proves relatively weak, which results in difficulties for technology to fundamentally solve the noise control problem of this frequency band. The research on the band gap theory of phononic crystal provides a new thought for this problem, however, the study of phononic crystal is still at the basic research stage both at home and abroad [6-7], and its application has been poorly studied [8], in particular, no paper is available about the solution to the noise problem of the automotive dash panel. Based on the band gap mechanism, the periodic damping structure has been proposed presently, which shows certain effect on vibration suppression, but the sound-absorbing characteristic is ignored. Therein, Qian Dejin, etc. [9] put forward from the standpoint of vibration suppression that changing the parallelism of the periodic vibration-isolating quality could improve the vibration-isolating effect, additionally, Jinxiao Xiong, etc. [10] studied the application of the periodic damping structure in the noise vibration isolation inside the car. Here, both the vibration isolation and the sound absorption characteristics were taken into consideration, and the parallel periodic sound-package structure was eventually proposed and its basic theory deduced, which was staggered and skewed laid so as to improve the vibration isolation and sound absorption effect on the basis of the thought above presented in paper [9], moreover, the parameters of the manually woven periodic sound-package structure could maximally improve its sound insulation performance, and then this noise reduction program was applied to the dash panel, wherein the rapid optimization of the medium and low frequency noise was eventually realized.
2. Theory of periodic sound-package structure
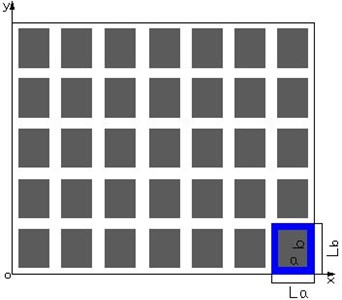
The cross-sectional view of a two-dimensional periodic sound-package structure was shown in Fig. 1, with the plate thickness as the direction, wherein the white part was the basal material, the blue was a crystal cell, and the gray was the structure of the laid square scatter, which was perpendicular to the axis and periodically arranged in the plane. Therein, and were the lattice constants in and direction, respectively; and were the length and width of the scatter, respectively; and was the duty cycle. Suppose that the thin plate deformed uniformly in the thickness direction.
Fig. 1Cross-sectional view of a two-dimensional periodic sound package sheet
According to the boundary conditions of the upper and lower sheet surfaces, the stress-strain relationship could be obtained as:
wherein is the elastic modulus, is the shear modulus, is the Poisson ratio, is the stress tensor (), and are the displacement components in and direction, respectively.
In accordance with the wave equation of elastic wave in crystals, the vibration equation of the two-dimensional periodic sound package structure could be written as:
The equation above differs from the modal equation [11-12] in the structure, wherein is the density.
When elastic wave propagates in the compound medium with periodically-varying elastic coefficient, the coefficients of , , and in the equation are all periodic functions of the position . And for the periodicity, representing , , and could be expand as the form of two-dimensional Fourier series:
wherein is the reciprocal lattice vector of the reciprocal space.
As per Bloch theorem, for periodic structure, the solution to Eq. (3) is:
wherein is the angular frequency of the wave, is the wave vector limited within Brillouin, is a function with the same period as , , and , which could also be expanded to be Fourier series as the follow, i.e:
Then Eq. (4) could be written as:
Substitute Eq. (3) and Eq. (6) into Eq. (2), and simplified as:
wherein . and refer to the first derivative and the second one of .
Each primitive cell is composed of the color dispersive body and the basal body, whose corresponding material parameters could be written as , and , , and , respectively. And then the Fourier series in Eq. (7) could be written as [11-13]:
wherein is the duty cycle of the color dispersive body, is the structural function only associated with the cross-sectional shape of the color dispersive body, which could be expressed as follows for the rectangular in Fig. 1:
The summation in Eq. (7) is over all the reciprocal lattice vectors, for numerical calculation, reciprocal lattice vectors could be symmetrically selected around the origin in the reciprocal space, and then Eq. (7) becomes an eigenvalue equation with matrix elements. Just arbitrarily give a wave vector in the Brillouin zone, a series of characteristic frequency values could be obtained, and the dispersion relationship between the wave vectors and could be further gained, i.e. the band gap of the two-dimensional periodic sound-package structure.
3. Validity verification of the FE-SEA method
3.1. Sound transmission loss test of the dash panel
As could be seen from Fig. 2, the environment for the sound transmission loss test was constituted by the reverberation chamber and the anechoic chamber, and the dash panel was fixed to the window between the two chambers, as shown in Fig. 2(a), wherein chloroprene rubber was employed to fill up the mounting clearance and silica gal to seal the holes in the dash panel so as to prevent sound leakage, and meanwhile to make the dash panel keep a nearly free boundary condition.
Microphones were respectively arranged in the reverberation chamber and the anechoic chamber, and each measuring points in the latter were distributed on the envelope surface of the dash panel, as shown in Fig. 2(b). The average sound pressures in the reverberation chamber and the anechoic chamber were measured as and , respectively, then the sound transmission loss will be:
wherein is the surface area of the dash panel, and is the area of the envelope surface in the anechoic chamber.
Fig. 2Sound transmission loss test of the dash panel
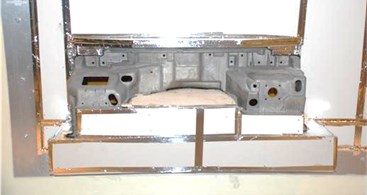
a) Incident sound field side (the reverberation chamber)
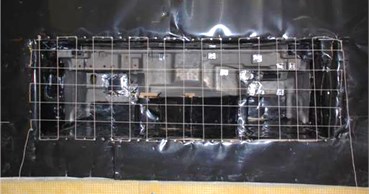
b) Transmission sound field side (the anechoic chamber)
The dash panel of the automotive is located on the inner side of the engine cabin. Actually, the mixed noise of the engine-radiated and other sounds incident to the dash panel after multiple reflections is nearly reverberant field. As a consequence, an excitation of reverberant field was applied to the incident side for the acoustic prediction of the magnesium alloy dash panel, which proved much closer to the practical situation.
3.2. Sound transmission loss simulation of the dash panel
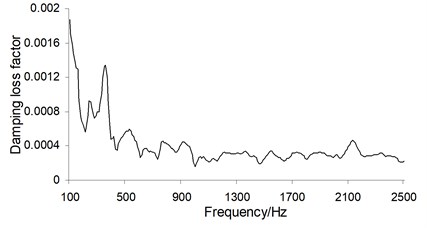
The dash panel with uniform thickness was eventually meshed into the FE subsystem model in Fig. 3, which could automatically generate FE faces in software, and a reverberant field excitation (DAF) was applied on one side of FE faces; moreover, during the simulation, it was unnecessary to seal the steering column, the air conditioning vents and the wire harness hole [14] of the dash panel, since DAF was defined on each FE face rather than in the space on the incident side. A semi-infinite fluid field (SIF) [15] was defined on both sides of the model to receive the transmitted acoustic energy. Moreover, the pulse decay method was utilized in order to improve the prediction accuracy of the hybrid model, with the measured damping loss factor of the dash panel shown in Fig. 4, which was then imported to calculate the sound transmission loss.
Fig. 3FE subsystem model
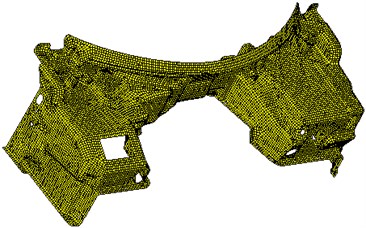
Fig. 4Damping loss factor of the dash panel
The sound transmission loss of the dash panel is written as the follow:
The incident sound power of the entire dash panel is [16]:
wherein and are the amplitude and the effective value of the sound pressure on the incident side, respectively, is the air density, is the sound velocity in the air, and is the surface area of the dash panel.
The sound power on the transmission side is the sum of multiple SIF incident sound powers.
Through the analysis above, the sound transmission loss in 1/3 frequency interval of both the test and the simulation were eventually obtained, as shown in Fig. 5.
Fig. 5TL in 1/3 octave of both the test and the simulation
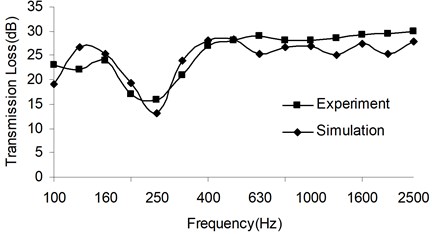
At medium and low frequency, the sound transmission loss of the dash panel is principally affected by stiffness, damping, natural frequency and other boundary conditions. In the actual test, there was damping rubber on its boundary, which may slightly increase the connection rigidity, therefore it could not be simply simplified as free boundary in the simulation, instead, the number of freedom degrees of the nodes was required to be repeatedly modified until it got a better fit to the test. At high frequency, the modal density of the dash panel increased, mostly vibration modes of local modals, when the sound transmission loss would be less influenced by boundary conditions.
The results above indicated that the FE-SEA method proved feasible for the sound transmission loss prediction of the dash panel.
4. Transmission path identification of the medium and low frequency sound of the dash panel
The TL curve in 1/3 frequency interval could not accurately reflect the characteristic of the dash panel at a certain frequency, for this, its equal-bandwidth TL curve was numerically calculated out, as shown in Fig. 6.
Fig. 6Equal-bandwidth TL curve of the dash panel
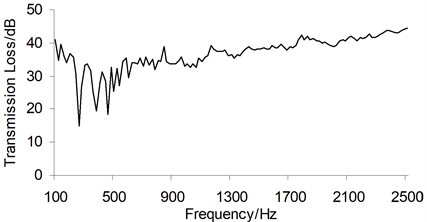
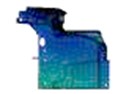
As shown in Fig. 6, there existed 3 obvious sound-insulating troughs within the frequency band below 500 Hz, i.e. 270 Hz, 380 Hz and 460 Hz, which respectively corresponded to the natural frequencies of the dash panel. So as to verify which modals were associated, the modal contribution of the dash panel was analyzed, wherein only the modals of 275 Hz, 382 Hz and 463 Hz were adopted for the TL calculation.
And the obtained curve was compared with the overall TL curve, as shown in Fig. 7.
As can be seen from Fig. 7, the troughs at the 3 positions of the overall TL curve were just contributed by the three order modals above. And then the velocity vibration modes at the three order modals were extracted to identify the ‘key areas’ for sound transmission of the dash panel, see Fig. 8.
Fig. 7Modal contribution rate curve of the dash panel
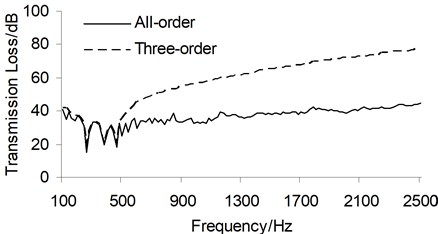
Fig. 8Key sound-transmission areas of the dash panel
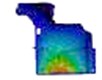
a) 270 Hz
b) 380 Hz
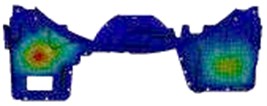
c) 460 Hz
5. Research on periodic sound-package structure
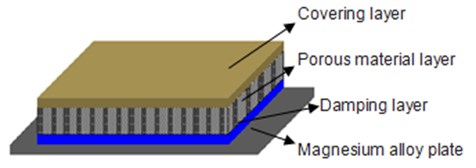
It is impossible for the dash panel to satisfy the noise reduction requirements only depending on its own structure, consequently, foam, fibers, sponge and other interior decorating materials are often pasted on the surface. And a typical interior is usually composed of 4 layers, as shown in Fig. 9, i.e. the magnesium alloy plate, the damping layer, the porous material layer and the viscoelastic covering layer, wherein the porous material serves as the main sound-absorbing layer, through the friction between the inside air and the structure, the sound wave would be converted to heat and the damping vibration of the porous material, and the energy was dissipated, then the noise insulating and reducing purpose could be eventually achieved.
Sheets with block-laying sound packages are generally used in noise control engineering, which exhibits remarkable noise-reduction effect at high frequency, but basically brings about no noise improvement at medium and low frequency, or even proves counterproductive, to solve this problem, with reference to the researches on the band-gap mechanism of periodic structure and the phononic crystal theory [17-19], the periodic sound-package structure was eventually proposed, which could effectively reduce the noise at medium and low frequency, compensating the deficiency of traditional sound package program.
Fig. 9Composition of the sound package structure
The cross-sectional model of the periodic sound-package structure was shown in Fig. 9, so as to study its acoustic properties, the magnesium alloy sheet with dimensions of was selected as the base material, and the periodic sound-package structure was laid upside, with the duty cycle of 40 %, and the period number of 8 and 5 in the directions of and , respectively, whose composition included a 2 mm-thick damping layer, a 6 mm thick porous sound-absorbing layer and a 2 mm-thick covering layer. In the sound insulation test, this specimen was too small to be conveniently fixed at the window of the reverberation chamber, for this reason, a reverberation box was eventually designed and manufactured, which could be equivalent to a small reverberation chamber and exhibited a favorable effect for tests of small specimens.
5.1. Design and test of the reverberation box
The reverberation box can be used in a limited space to produce free-scattered sound field, so that the measured sound pressures of points in the sound field could be uniformly distributed. And the reverberation box in this paper was self-designed and machined as per ISO [20] standard, wherein a structure of double-layered steel plate was employed, with glass wool and air filled, and the schematic diagram of the cross-sectional structure of the box wall was shown in Fig. 10.
Fig. 10Schematic diagram of the reverberation box wall structure
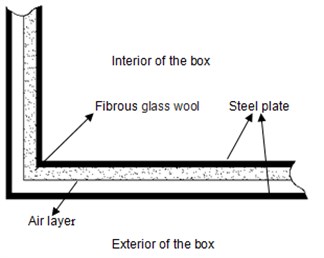
Fig. 11Overall dimensions of the reverberation chamber
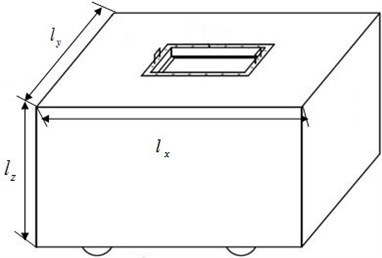
For reverberation chambers with volume smaller than 200 m3, in Eq. (13), is the volume of the reverberation chamber, and is lower limit frequency for measurement of the reverberation chamber, below which the measurement results can not be trusted [20], and that in Eq. (14) , , are the dimensions in length, width and height of the reverberation chamber, respectively [21], as shown in Fig. 11:
Moreover, there exists the following relationship between the maximum length and the volume [21] in the reverberation box:
Through combination with Eq. (13), (14) and (15), the external dimensions of the reverberation box was determined as And the lower limiting frequency for the reverberation box measurement was calculated as 300 Hz.
After the overall dimensions of the reverberation chamber were determined, the FE-SEA hybrid method could be employed for the design, with the statistical energy subsystem shown in Fig. 12.
The reverberant field excitation (DAF) was applied in the reverberation chamber in Fig. 12. Face connections were defined between the steel plate and the air layer, the steel plate and the sound-absorbing material layer as well as the air layer and the sound-absorbing material layer, respectively. The sound insulation performance of the structure was calculated and optimized through the statistical energy method, and each layer thickness of the composite reverberation chamber structure was ultimately determined.
Since each surface of the reverberation chamber was flat, the reflected angle of the sound wave was single. Even if all the surfaces are ideal rigid flat ones with quite small sound-absorption coefficients, it is still difficult to guarantee favorable diffusion effects in each frequency band, consequently, it proves indispensable to improve the diffusion effect of the reverberation chamber.
Installation of diffusers inside the reverberation chamber is widely employed to improve the diffusion effect. Given the small size of the reverberation chamber, spherical cap surfaces with different radiuses were fixed to the inner wall of the chamber to improve the sound field diffusion effect inside, thus ensuring that sound waves in different frequencies could be favorably reflected from different directions, and an equal sound energy density everywhere in the reverberation chamber was eventually achieved.
Fig. 12Statistical energy subsystem of the reverberation chamber
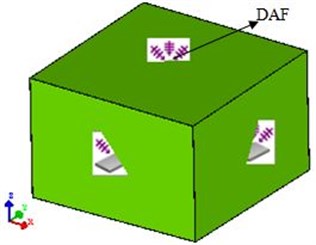
Fig. 13FE subsystem of the reverberation chamber
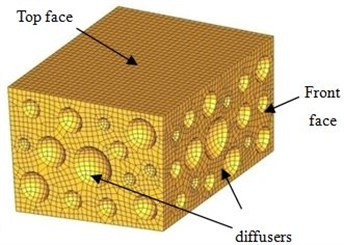
Through simulation and optimization by the FE-SEA hybrid method, the chamber shape and the number and installation location of the diffusers were ultimately determined. Two unit point sound sources were applied at the opposite corners of the simulation model, and the chamber was equipped with enclosed rigid surfaces.
The FE subsystem which was also the inner of the reverberation was shown in Fig. 13, wherein the recessed parts were all diffusers, which were installed on three adjacent surfaces, i.e. the bottom, the side and the front of the inner chamber. And the sizes and number of the diffusers will be determined according to the optimization result.
The reverberation time and the sound field uniformity of the reverberation box were checked to verify the qualification for the test.
The so-called reverberation time refers to the time required for the sound pressure level to decrease by 60 dB from the steady state when the sound source is interrupted after reaching a steady sound field. And the frequency series in Table 1 were tested to measure the reverberation time of the reverberation box.
Table 1Reverberation time of the reverberation box
Frequency / Hz | Reverberation time / s | Frequency / Hz | Reverberation time / s |
200 | 2.15 | 1000 | 2.25 |
250 | 2.20 | 1250 | 2.15 |
315 | 2.00 | 1600 | 2.25 |
400 | 2.25 | 2000 | 2.20 |
500 | 2.15 | 2500 | 2.20 |
630 | 2.20 | 3150 | 2.15 |
800 | 2.30 | 4000 | 2.25 |
As could be seen from Table 1, the reverberation box had a longer reverberation time at each frequency, which satisfied the test requirement.
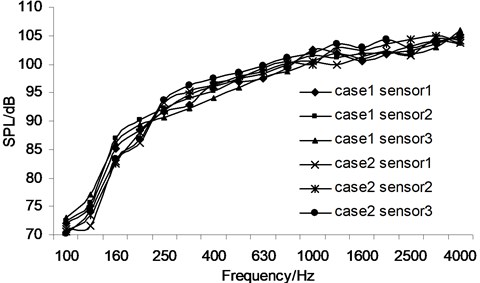
In order to verify the uniformity of the sound field distribution in the reverberation box, the sound pressure results measured by 3 microphones in the reverberation box were compared. And they were tested simultaneously for twice (case 1 and case 2) to avoid result contingencies, as shown in Fig. 14.
The distributions of the sound pressure levels in the reverberation box were shown in Fig. 14, from which we could obtain that under the same case, the sound pressure levels measured by 3 microphones differed from each other no more than 3 dB; while under different cases, the maximum sound pressure level difference was only 4 dB, occurring below 300 Hz, which was smaller than the lower limiting frequency of the reverberation box; moreover, the sound pressure levels all exceeded 90 dB in the frequency band above 250 Hz, indicating that white noise of 1 Pa was produced, and the sound field in the reverberation box was homogeneously distributed, which proved favorably suitable for the generation of reverberation excitation. Also, the lower limiting frequency calculated according to equations was demonstrated too conservative.
Fig. 14Sound pressures measured by 3 measuring points in 1/3 octave
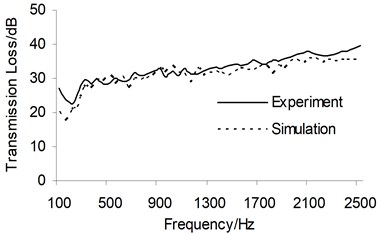
Place the reverberation box in the semi-anechoic chamber and fix the magnesium alloy sheet laid with periodic sound-package structure at its window, subsequently, measure the sound transmission loss and compare it with the simulation result by FE-SEA hybrid method, as shown in Fig. 15.
Fig. 15 presented that the simulation and test results showed favorable consistency throughout the whole frequency band, which demonstrated that the FE-SEA hybrid method was practically feasible to predict the sound transmission loss of the magnesium alloy sheet laid with periodic sound-package structure.
Fig. 15Sound transmission loss comparison between the simulation and experiment
5.2. Advantages of the periodic sound-package structure
The sound transmission loss of the bared panel, big block sound package structure and periodic sound-package structure were numerically calculated, respectively, as shown in Fig. 16.
Fig. 16Sound transmission loss comparison of different sound package structures
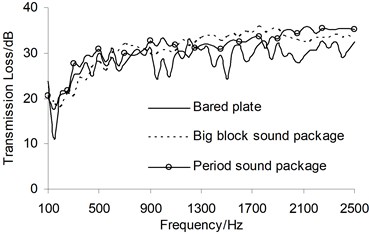
It was shown in Fig. 16 that the big block package structure brought about great improvement to the peaks of the sound transmission loss corresponding to each orders of modal at high frequency, nevertheless, it exhibited a negative effect on it within the medium and low frequency; While in the case of equal total laying area of sound package structure, the periodic structure improved the sound transmission loss to some extent within the medium and low band gaps, and exhibited some effect on the vibration isolation and sound absorption in other frequency bands.
5.3. Laying duty cycle
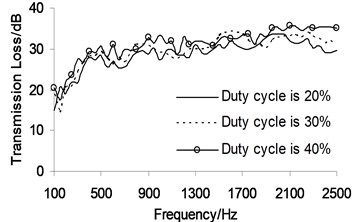
Maintain the period numbers of the periodic sound-package structure in and direction fixed, and change its duty cycle, and then observe the sound transmission loss variations, with the results shown in Fig. 17.
As could be seen from Fig. 17, within the whole frequency band under analysis, the sound transmission loss of the structure dramatically increased with the increasing duty cycle, since the duty cycle changes would result in varying overall stiffness. As a consequence, for periodic sound-package structure, appropriate increase in the duty cycle exhibits a prominent role to the radiated noise reduction of the structure.
Fig. 17Sound transmission loss under different duty cycles
5.4. Laying period number
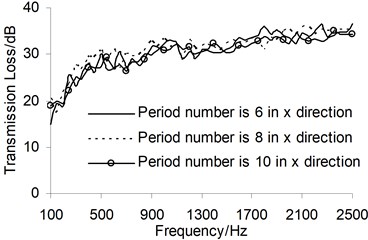
Keep the duty cycle of the periodic sound-package structure to be 40 %, and the period number in direction to be 5, and then change the period number in direction from 6 to 10, with the step length of 2, as a result, the sound transmission loss of 3 cases were shown in Fig. 18.
Fig. 18 showed that as the period number in direction increased, the sound transmission loss of the structure exhibited non-linear variations. Concretely, when the period number in direction was smaller than 8, the sound transmission loss would increase with the increasing period number; otherwise, it would decrease with the increasing period number, because the spacing of the structure was too small to reflect the characteristics of periodic structure. Thus, in practical applications, the period number of the structure shall be reasonably selected, so as to maximally improve the sound insulating performance.
Fig. 18Sound transmission loss under different period numbers
The studies above were all based on parallel periodic sound-package structures, and the influence of the staggered-and-skewed laying manner on the sound transmission loss needs to be discussed.
5.5. Staggered-and-skewed laying
The laying models of the periodic sound-package structures were shown in Fig. 19. Therein, Laying mode 1 was consistent with the parallel structure above; Laying mode 2 entirely skewed for a certain angle on the basis of Laying mode 1; and in Laying mode 3, each structure had the same included angle 0.5 with the traditionally vertical direction, and the included angle between two adjacent sound package structures was . And then the sound transmission loss under the three laying modes was respectively calculated out, as shown in Fig. 20.
Fig. 19Schematic program of 3 laying modes
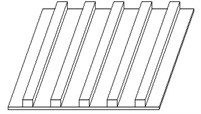
a) Laying mode 1
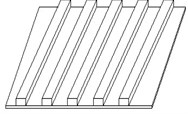
b) Laying mode 2
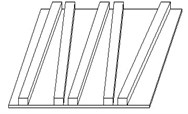
c) Laying mode 3
Fig. 20Sound transmission loss under 3 laying modes
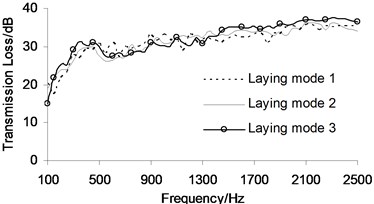
As could be seen from Fig. 20, Laying mode 3 exhibited the best sound-insulating effect at 500 Hz or less, and moreover, the sound transmission loss curve under Laying mode 3 proved gentler than those under the other two, and it was also helpful to improve the sound quality.
5.6. Laying included angle
On the basis of laying mode 3, the influence of the included angle between two adjacent structures on the sound transmission loss was discussed, with the model shown in Fig. 21, wherein was changed from 0° to 30° with the step length of 10°, with the sound transmission loss comparison under various cases shown in Fig. 22.
Fig. 21Schematic program of the laying included angle between two adjacent structures
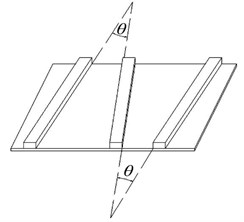
Fig. 22Sound transmission loss under the different laying included angles
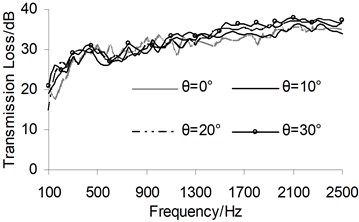
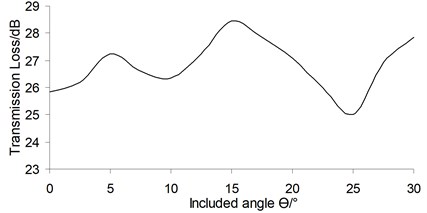
As shown in Fig. 22, in the frequency bands of 100-500 Hz and 1500-2300 Hz, the sound transmission loss generally tended to increase with the increasing laying included angle; while in other frequency range, the variation exhibited relatively disordered. In order to deeply research into the continuously varying trend of the sound transmission loss with the laying included angle, the total sound transmission loss under each case was calculated from 0° to 30° with step length of 5°, and after interpolation fitting, the varying curve of the total sound transmission loss with the included angle was eventually shown in Fig. 23.
As could be seen from Fig. 21, when 0°-15°, the sound transmission loss generally increased with the increasing included angle, and its maximum 28.5 dB emerged, however, certain peaks and troughs occurred at some angles; when 15°-25°, the sound transmission loss decreased as the included angle increased, with its minimum of 24.9 dB; and when 25°-35°, the sound transmission loss positively correlated with the included angle. As a consequence, in practical engineering, the declination angle of the periodic sound-package structure shall be reasonably arranged according to the actual case, so as to maximally improve the sound insulation performance of the entire structure.
Fig. 23Varying curve of the total sound transmission loss with the included angle θ
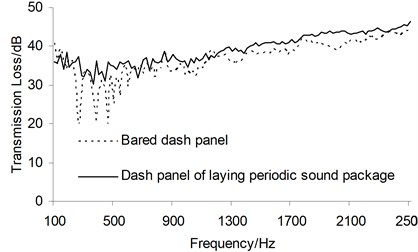
6. Rapid optimization on sound transmission loss of dash panel
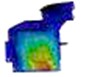
The staggered and skewed periodic sound-package structure with included angle15° was applied to the key sound-transmission areas shown in Fig. 8, with the results shown in Fig. 24, wherein the vibration was significantly inhibited, and the comparison between the sound transmission loss before and after optimization was shown in Fig. 25.
As shown in Fig. 25, the transmission loss at the three sound-insulating troughs of 270 Hz, 380 Hz and 460 Hz were significantly improved, and meanwhile, those within other frequency bands also increased by about 2 dB, moreover, the sound-insulating curve got much gentler on the whole and the sound quality was upgraded, which verified the feasibility of the design of the periodic sound-package structure. The FE-SEA hybrid method was employed in the modeling and solution, whose calculation speed proved much faster than that of the structure-sound coupling method, with the solution time ratio of 1:4, consequently, it was called ‘rapid optimization’.
Fig. 24Nephograms of the key sound transmission areas after optimization
a) 270Hz
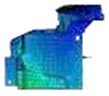
b) 380 Hz
c) 460 Hz
Fig. 25Comparison between the sound transmission loss before and after optimization
7. Conclusions
1) Based on the researches on the band gap mechanism of periodic structures and phononic crystals, the fundamental theory of two-dimensional periodic sound packaging structure was eventually deduced.
2) The sound-insulating prediction model of the magnesium alloy dash panel at medium and low frequency was established through employment of the FE-SEA hybrid method, which was then compared with the test result, verifying the feasibility of the prediction model and providing certain guarantee for subsequent analysis.
3) Modal contribution analysis of the sound-insulating troughs was conducted, and the key involving modals were eventually found out. Moreover, the speed vibration modes were extracted, from which the sound transmission path of the dash panel was identified, providing a foundation for the application of periodic sound-package structure.
4) So as to accurately and efficiently measure the sound transmission loss of plates with periodic sound-package structure, a reverberation box was self-designed and manufactured, which compensated for the deficiencies of reverberation chamber in small specimen tests, and meanwhile verified the feasibility of the FE-SEA hybrid method in the sound insulation prediction of the periodic sound-package structure.
5) Sheets laid with periodic sound package structure could generate band gaps at low frequency, within which the sound transmission loss would be obviously higher than that of traditional sound package program with the same area; additionally, the parameters of the laying duty cycle and the period number, etc, would affect the sound-insulating performance of the periodic structure, consequently, the corresponding parameters of the periodic sound-package structure could be manually woven according to actual case, so that the sound insulation could achieve greater improvement.
6) The staggered and skewed laying mode of the periodic sound-package structure proved superior to the parallel one in improving the sound insulation of thin plates. There exists an optimal laying angle between two adjacent skewed structures which could maximally minimize the radiated noise of thin plates.
7) The staggered and skewed periodic sound-package structure was applied to the magnesium alloy dash panel, wherein the key sound-transmission areas were considerably inhibited and the sound transmission loss at the sound insulation troughs were significantly improved, besides, the sound transmission loss in other frequency bands were also increased by 2 dB or so, and the sound insulation curve generally got much gentler, which demonstrated the feasibility of the design of the periodic sound-package structure.
References
-
Le Bot A., Cotoni V. Validity diagrams of statistical energy analysis. Journal of Sound and Vibration, Vol. 329, Issue 2, 2010, p. 221-235.
-
Zhou R., Crocker M. J. Sound transmission loss of foam-filled honeycomb sandwich panels using statistical energy analysis and theoretical and measured dynamic properties. Journal of Sound and Vibration, Vol. 329, Issue 6, 2010, p. 673-686.
-
Hopkins C. Experimental statistical energy analysis of coupled plates with wave conversion at the junction. Journal of Sound and Vibration, Vol. 322, Issue 1, 2009, p. 155-166.
-
Shorter P. J., Langley R. S. Vibro-acoustic analysis of complex systems. Journal of Sound and Vibration, Vol. 288, 2005, p. 669-699.
-
Cotoni V., Shorter P. Numerical and experimental validation of a hybrid finite element-statistical energy analysis method. Journal of Acoustic Society of America, Vol. 122, Issue 1, 2007, p. 259-270.
-
Shen L., et al. The theoretical research and application about phononic crystal structure in noise reduction when braking. Journal of Applied Mechanics, Vol. 27, Issue 2, 2010, p. 293.
-
Zuo S. G., et al. The application of phononic crystal on the car ceiling to vibration and noise reduction. Mater. Rev., Vol. 25, Issue 12, 2011, p. 124.
-
Wen Q. H., Zuo S. G., Wei H. The local resonance band gap of many oscillator beam in bending vibration. Phys. J., Vol. 61, Issue 3, 2012, p. 034301.
-
Qian D. J., Yao X. L., et al. Impending vibration wave propagation from several arranged vibration masses. Applied Acoustics, Vol. 28, Issue 5, 2009, p. 321-329.
-
Jin X. X., et al. Interior noise based on phononic crystal. Vib. Impact., Vol. 28, Issue 12, 2009, p. 107.
-
Kushwaha M. S., Halevi P., Martinez G., et al. Theory of acoustic band structure of periodic elastic composites. Physical Review B, Vol. 49, Issue 4, 1994, p. 2313-2322.
-
Wang G., Wen J. H., Han X. Y., et al. Finite difference time domain method for the study of band gap in two-dimensional phononic crystals. Acta Physica Sinica, Vol. 52, Issue 8, 2003, p. 1943-1947.
-
Wu W. G., Liu Y. T. Acoustic band gaps and defect states in two-dimensional materials. Acta Physica Sinica, Vol. 51, Issue 7, 2002, p. 1434-1438.
-
Chen J. R. Automobile structure. Second Edition, China Machine Press, 2009.
-
VAone user guide. VAone, 2007.
-
Du G. H., Zhu Z. M., Gong X. F. Acoustic basis. Nanjing, Nanjing University Press, 2001.
-
Jensen J. S. Phononic band gaps and vibration in one and two-dimensional mass-spring structures. Journal of Sound and Vibration, Vol. 266, Issue 5, 2003, p. 1053-1078.
-
Yu D., Wen J., Zhao H., et al. Vibration reduction by using the idea of phononic crystals in a pipe-conveying fluid. Journal of Sound and Vibration, Vol. 318, Issue 1, 2008, p. 193-205.
-
Acar G., Yilmaz C. Experimental and numerical evidence for the existence of wide and deep phononic gaps induced by inertial amplification in two-dimensional solid structures. Journal of Sound and Vibration, Vol. 332, Issue 24, 2013, p. 6389-6404.
-
ISO 354, Acoustics-measurement of sound absorption in a reverberation room. Geneva, 2003.
-
Xiang D. Q., Wang Z., Chen J. J. Acoustic design of a reverberation chamber. Applied Acoustics, Vol. 32, Issue 2, 1991, p. 83-91.
About this article

