Abstract
To prevent nuclear leakage accidents at nuclear power plants because of earthquakes, a new method for seismic response analysis that considers the transient fluid excitation force was used. The inherent modal analysis was based on a newly developed three-dimensional residual heat removal pump model. The equivalent static method and response spectrum method were used to analyze the seismic response at half of the safe shutdown earthquake (SSE) seismic load according to the square root of the sum of the squares algorithm; the actions of gravity, the operation load, the piping load under accident conditions, the SSE seismic load, and the fluid excitation force were considered simultaneously. The fluid excitation force was applied to the rotor system by the fluid-structure interaction method. The seismic response of the rotor with and without the fluid excitation force was analyzed. The deformations caused by the seismic load and fluid excitation force of the impeller surface fitted with a wear ring and the trailing edge of the impeller were analyzed. This study revealed that the primary vibration mode of the residual heat removal pump was translational vibration in the horizontal direction. The total deformation of the trailing edge of the impeller was far below the unilateral clearance between the impeller and diffuser, and the total deformation of the impeller surface fitted with the wear ring met the requirements for seismic response analysis. There was no rub and disturbance between the rotor and stator. The requirements for pump operation under a seismic load were guaranteed to be met. The deformation of the trailing edge of the impeller on the shroud was larger than that on the hub. At different positions of the impeller passage, the deformations of the trailing edge of the impeller on the shroud and hub were basically the same; only the phase of the deformation changed. The results proved that the residual heat removal pump sufficiently meets the RCC-M 2000 standard and thus can help in research on the deformation of impellers in seismic response analysis.
1. Introduction
According to statistical data from the American Preliminary Determinations of Epicenter, the last ten years have seen 1062 earthquakes with a moment magnitude of 6.0-7.0, 161 earthquakes with a magnitude of 7.0-8.0, and 19 earthquakes with a magnitude of 8.0-9.0 around the world. On March 14, 2011, Japan’s Fukushima nuclear power plant faced the risk of explosion because of inadequate seismic capacity design. Similar troubles were caused by a 2010 earthquake with a magnitude of 6.5 in Iran and a 2008 earthquake in Sichaun, China. As earthquakes occur frequently, people are becoming increasingly aware of their huge danger, and the destruction of machines by earthquakes has caused engineers to raise the requirements during research on shock tolerance and seismic response analysis methods for nuclear power plants [1, 2].
Nuclear power is a clean energy. Growing concern over global warming and climate change has led governments and communities to increase nuclear power development to meet electricity demands and environment requirements, optimize the energy structure, and ensure energy security [3-5]. Nuclear power plants have a residual heat removal pump within their containment shell. The residual heat removal pump is a key part in the first loop of the residual heat removal system (RRA) in nuclear power plants and is considered to be level 2 among the most important nuclear power equipment [6, 7]. The pump brings out residual heat after normal or accidental shutdown of the reactor to maintain the safety of the nuclear power plant and must meet the level I anti-seismic requirement. It has three operation conditions; the fluid flow has a large influence on the pump structure.
Seismic response analysis is part of civil engineering, but there has been little research done on such analysis for rotating machines. In particular, the rotation of the rotor is not considered because the rotor is often simplified as a bar structure. The force that the stationary component transfers to the rotating component is also not considered. There has been no seismic response analysis that considers the fluid excitation force of a rotating machine. Karasudhi [8] adopted infinite elements in the far field and finite elements in the near field to analyze the seismic response by imposing three concentrated orthogonal forces. Suarez [9] studied the seismic response characteristics of a rotating machine under simulated base excitations through different principles; these characteristics included speed-dependent gyroscopic terms, base rotation-dependent parametric terms, and several forcing function terms. Dimentberg [10] studied transverse random vibrations below the instability threshold by considering both external and internal damping. Zhou [11] analyzed the dynamic characteristics of a coolant pump in a nuclear plant by using the response spectrum method and found the natural frequencies of vibration, modes of vibration, and possible steps to decrease the overall damage to the system. Yang [12] analyzed the equivalent static characteristics of a canned motor pump by applying a finite element model (FEM). Zhou [13] analyzed the stress of a reactor coolant pump under different conditions and used the seismic response method with multi-spectrum input directions. For flow-induced vibration, Brennen was the first to define a new phenomenon of fluid-structure interaction (FSI) in turbomachinery: fluid-induced rotor dynamic forces and instabilities. Jiang [14] conducted a full-scale structural simulation of fluid-induced mechanical vibrations and noise in a five-stage centrifugal pump and simulated the vibration of the pump structure by using a parallel, explicit, and dynamic FEM code.
In summary, there is little literature on seismic response analysis with a focus on the deformation caused by the transient fluid excitation force to evaluate the anti-seismic performance of residual heat removal pumps. In this study, a numerical analysis of the deformation was carried out using the response spectrum and FSI. The seismic load and fluid excitation force were both considered. The deformation of an impeller surface fitted with a wear ring and the trailing edge of the impeller caused by the seismic load and fluid excitation force was analyzed quantitatively for multi-operational conditions. Some experimental data were also collected to verify the accuracy of the simulation.
2. Structure description and calculation model
2.1. Structure description
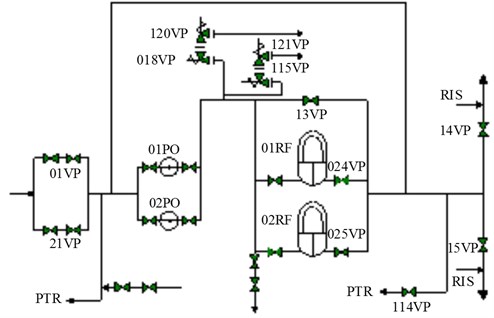
As shown in Fig. 1, the RRA system comprises two residual heat removal pumps, two heat exchangers, valves, and pipes. The residual heat removal pumps RRA 01PO and 02PO direct water into a main pipe. A relief valve is located on the main pipe to avoid overpressure of the RRA system. Water in the main pipe flows into RRA 01RF, RRA 02RF, and the bypass line; the water then converges again. A minimum flow recirculation line leads to the pump inlet, a low-pressure discharge pipeline leads downstream, and the connecting pipeline leads to the reactor cavity and spent fuel pit cooling and treatment system (PTR). A pipeline is connected to the PTR at the inlet of the pump, and there is a returning pipeline downstream of the gasification system.
The residual heat removal pump and its components are required to maintain the pressure characteristics and finish water-filling and safe water injection with sealing and high pressure. The seismic response performance at the safe shutdown earthquake (SSE) seismic load is analyzed according to the square root of the sum of the squares (SRSS) algorithm by, which simultaneously considers the actions of gravity, the normal operation load, the maximum piping load under accident conditions, and the SSE load.
Fig. 1Residual heat removal system
2.2. Finite element model
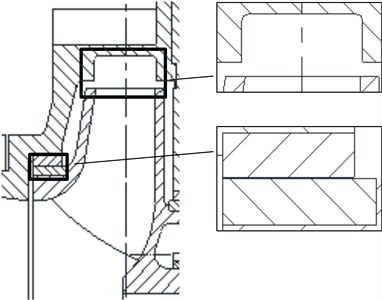
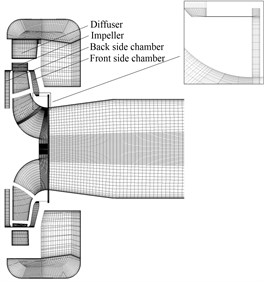
A centrifugal and horizontal residual heat removal pump model was used in this study. Fig. 2 shows the three-dimensional model. The model is mainly composed of an impeller, a diffuser to make the flow more uniform, an annular volute to make the pump structure more stable, and a cooling flow channel that can be used as a heat shield device to isolate the motor from the heat of the fluid in the pump chamber. When the pump is subjected to earthquakes, the deformation between the rotor and stator should be smaller than the clearance. Fig. 3 shows the schematic of the clearances between the impeller and diffuser and between the impeller and wear ring. The unilateral clearance between the impeller and wear ring is 0.3 mm, and friction is allowed between the impeller and wear ring when fluid turbulence occurs. The unilateral clearance between the impeller and diffuser is 2 mm and should be guaranteed.
Fig. 2Three-dimensional schematic of residual heat removal pump structure
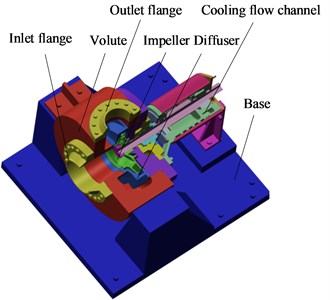
Fig. 3Schematic of clearances between impeller and diffuser and between impeller and wear ring
3. Seismic response analysis method
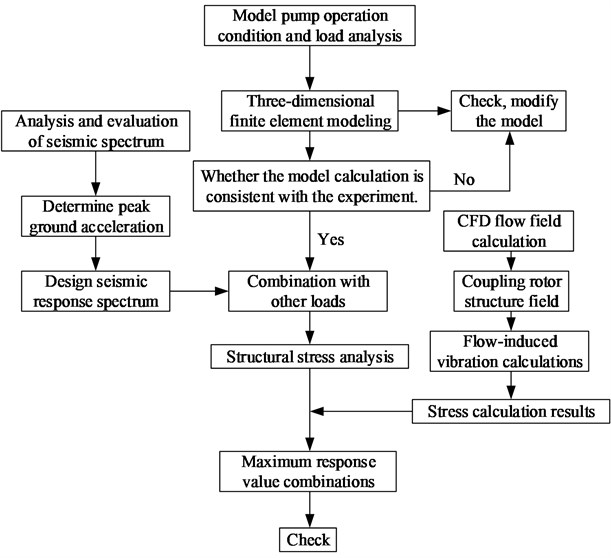
A new method to analyze the seismic response of a rotating machine in nuclear power plants was used in this study. The response spectrum of the seismic effect was designed by analyzing the operation conditions and load. The seismic response of the equipment in each direction was obtained through FEM. The maximum seismic response of the equipment was obtained by combining each response and calculating the flow-induced vibration. The stress of the material and clearance between the static and rotating components were checked. Based on partial test validation, the seismic response analysis was more accurate. Fig. 4 shows a flowchart for the method of seismic response analysis.
Fig. 4Flowchart of seismic response analysis method
3.1. Boundary conditions
3.1.1. Seismic load
The seismic load acted on every component. The horizontal and vertical accelerations were obtained from the horizontal and vertical response spectrums; the damping ratio was 2 %, the elevation was 4 m, and the zero-cycle acceleration spectrum was half of the SSE load.
3.1.2. Operation load
The operation load was the design pressure load acting on the pump inner wall; it should not be less than the sum of the maximum suction pressure and maximum pressure drop between the pump inlet and outlet under stable operation conditions.
3.1.3. Piping load
The piping load under accident conditions was selected based on the conservation principle. Table 1 lists the piping load under accident conditions.
Table 1Piping load under accident conditions
Location | Axial force (N) | Shear force (N) | Moment (Nm) | Torque (Nm) |
Inlet | 40.000 | 57.000 | 57.000 | 100.000 |
Outlet | 30.000 | 31.200 | 27.000 | 36.600 |
3.1.4. Weight load
The weight load was the mass force acting on every component and was a static load. The weight load included the gravitational loads of the pump structure and inner fluid.
3.2. Material properties
Table 2 presents the material properties of the stator, rotor, and base. The rotor includes the impeller and pump shaft; the stator includes the diffuser, volute, pump cover, and flange.
Table 2Material properties
Component | Stator | Rotor | Base |
Material | Z2CND13-04 | Z2CN18-10 | 20MN5M |
Young’s modulus (Pa) | 206e9 | 197e9 | 204e9 |
Poisson’s ratio | 0.32 | 0.3 | 0.3 |
Density (kg/m-3) | 7690.7 | 7270.1 | 7991.9 |
4. Experimental verification
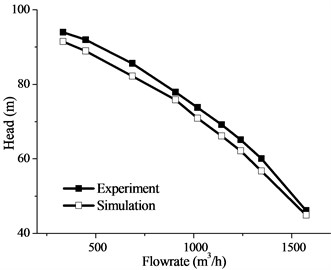
To verify the calculated accuracy, experimental data were collected for the model pump. The numerical calculations can be made more accurate through experimental verification, which can modify the simulation model by setting reliable boundary conditions for subsequent calculations of the fluid-induced vibration. Fig. 5 compares the delivery head curves obtained by the numerical calculations and experiments for all operating conditions at nominal speed. The temperature of the testing water was 28°C, the rotation speed was 1490 rpm, and the power rating of the matched motor was 350 kW. In this study, the fluid-induced vibration based on FSI was considered using the computational fluid dynamics (CFD) method. To obtain the simulated performance curve taken from ANSYS CFX 14.5, the control equation, calculation domain, turbulent model, and boundary conditions should be determined according to the real experimental conditions. The numerical simulation results were confirmed by the measured results. The maximum error between the experimental and calculated values was less than 5 %; thus, the calculation was validated.
Fig. 5Head curve of test pump
5. Modal analysis
To eliminate the influence of the grid on the simulation, independent analysis of the grid was performed under design conditions. Table 3 lists the results. The first frequency of the vibration of the pump structure clearly became stable when the grid number reached 2.24 million.
Fig. 6 shows the vibration modes. The primary vibration mode (first vibration mode) of the residual heat removal pump was the translational vibration; after the second vibration mode, this became the twisted vibration mode. Table 4 lists the frequencies of the top ten modes.
Table 3Grid sensitivity analyses
Grid number (104) | 89 | 133 | 224 | 491 |
First frequency (Hz) | 149.37 | 149.17 | 149.03 | 149.01 |
Table 4Frequencies of top ten modes
Order | Frequency (Hz) | Order | Frequency (Hz) |
1 | 149.03 | 6 | 388.39 |
2 | 167.4 | 7 | 460.7 |
3 | 194.88 | 8 | 649.97 |
4 | 303.62 | 9 | 695.6 |
5 | 319.48 | 10 | 708.03 |
Fig. 6Vibration modes: a) First vibration mode; b) Second vibration mode; c) Third vibration mode
a)
b)
c)
6. Seismic response analysis on extreme condition
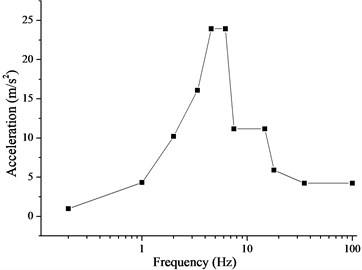
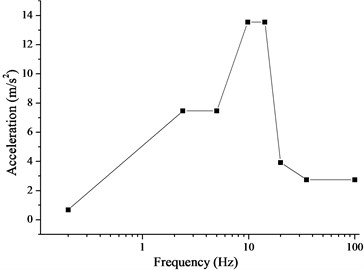
The response spectrum analysis was conducted after modal analysis with pre-stress under the condition that the first-order frequency was not much larger than 33 Hz. The maximum response was calculated for a given excitation based on the input response spectrum. The SRSS algorithm is based on the probability statistics of a random event; it demands complete independence between participating data without a coupling relationship. The acceleration response spectrums of horizontal floor and vertical floor are imposed on the integral structure, as shown in Fig. 7, and they can be thought of as independent. Therefore, the SRSS algorithm was used to analyze the maximum deformation in the section perpendicular to the pump shaft.
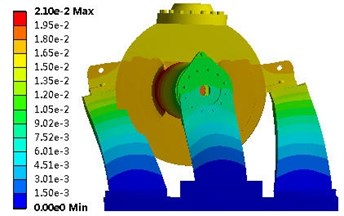
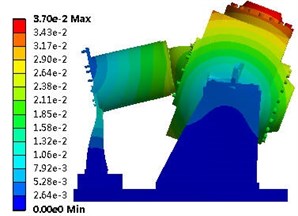
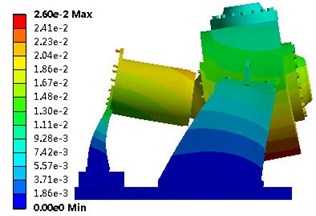
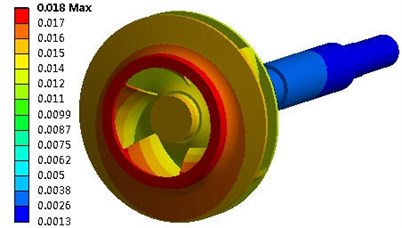
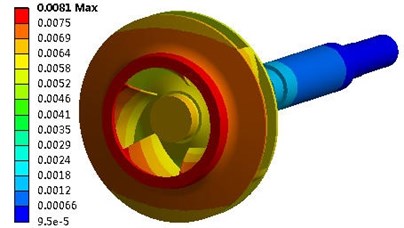
The maximum seismic response under the SSE load was calculated and evaluated according to the French RCC-M standard (Règles de Conception et de Construction des Matériels Mècaniques des Ilots Nucléaires PWR) or, in English, “Design and Construction Rules for the Mechanical Components of PWR Nuclear Islands” [15]. Because the rigidity of the integral structure is high, the absolute deformation of every component is very small. Fig. 8 shows the deformation contour of a rotor system that was subjected to the seismic load. In the horizontal direction, the deformation of the impeller surface fitted with a wear ring was 0.018 mm, and the deformation of the trailing edge of the impeller was 0.016 mm. In the vertical direction, the deformation of the impeller surface fitted with the wear ring was 0.0081 mm, and the deformation of the trailing edge of the impeller was 0.0069 mm. In the section perpendicular to the pump shaft, the SRSS algorithm determined that the total deformation of the impeller surface fitted with the wear ring was 0.0201 mm, which is far below the unilateral clearance of the wear ring of the 0.3 mm, whereas the total deformation of the trailing edge of the impeller was 0.0174 mm, which is far below the unilateral clearance of the trailing edge of the impeller of 2 mm. Therefore, there was no rub or disturbance between the rotor and stator. Thus, the requirements for operation under seismic load were met. However, these values are smaller than reality as they do not consider the influence of the transient fluid excitation force on the pump structure.
Fig. 7Acceleration response spectrum: a) Acceleration spectrum of horizontal floor; b) Acceleration spectrum of vertical floor
a)
b)
Fig. 8Deformation response of rotor system: a) Deformation in horizontal direction; b) Deformation in vertical direction
a)
b)
7. Deformation considering fluid excitation force
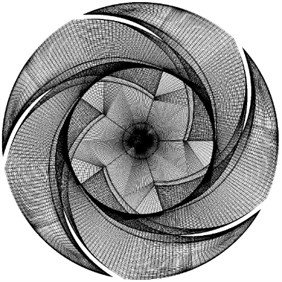
The deformation of the seismic response considering the fluid excitation force was analyzed using the FSI method. To solve the FSI problem, the structural dynamics equation, N-S equation, and continuity equation are solved simultaneously. In this study, the three-dimensional transient characteristics of the fluid domain were simulated using ANSYS CFX 14.5; the transient dynamic characteristics of the structural domain were calculated using ANSYS Workbench 14.5. As shown in Fig. 9, the fluid domain was meshed with the structural grid; the grid number was 4.4 million, and the boundary layer grid was considered. Fig. 10 shows the grid of the structural domain, which was used to study the deformation of the wear ring and the trailing edge of the impeller. The grid in the wear ring and trailing edge of the impeller was refined to a mesh number of 180.940.
The blade surface was chosen to be the computational coupling surface between the fluid and structural domains. In the structural domain, a fixed support was imposed on the surfaces in contact with the bearings, and a thermal load was imposed on the entire rotor system to consider the influence of temperature. In the fluid domain, the multi-field solver was used to transfer the temporal information from the fluid domain to the structural domain; the total pressure was set as the inlet condition, and the mass flow rate was set as the outlet condition.
Fig. 9Grid of fluid domain: a) Grid view in a meridional plane; b) Grid detail in the impeller domain
a)
b)
Fig. 10Grid of structural domain
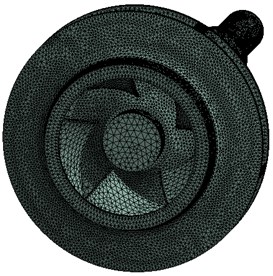
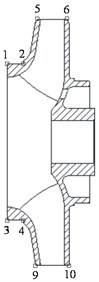
Fig. 11Position of monitoring points: a) Horizontal direction; b) Trailing edge of impeller on shroud and hub surface; c) Equivalent passage
a)
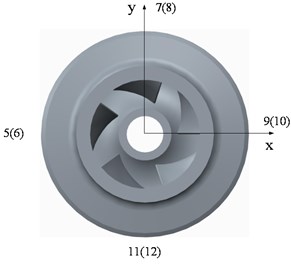
b)
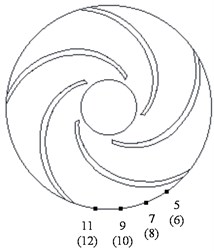
c)
Fig. 11 shows the monitoring points on the impeller surface fitted with a wear ring and the trailing edge of the impeller. Points 1-4 were distributed on the impeller surface fitted with the wear ring, and points 5-12 were set on the trailing edge of the impeller on the shroud and hub surfaces. Points 5-12 were on the trailing edge of different impeller passages; however, Fig. 11(c) shows the equivalent passage positions of points 5-12 based on the relative positions to the blades.
The total deformation considering the seismic load and fluid excitation force was obtained by combining the deformations caused by the seismic load and by the fluid excitation force. The deformations caused by the seismic and fluid excitation forces can be considered to be independent because of their very different properties. To analyze the seismic response conservatively, the deformations caused by the seismic load and fluid excitation force were combined numerically without considering the direction of their deformation. The flow rate was 910 m3/h, whereas the flow rate was 1475 m3/h.
7.1. Impeller surface fitted with wear ring
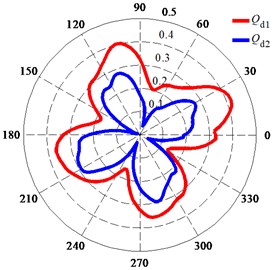
Fig. 12 shows the polar diagrams of the deformation of monitoring points on the impeller surface fitted with a wear ring during one impeller rotation. The deformation of the monitoring points changed the entire time, and the distribution of the deformation was in the shape of four petals. As shown in Fig. 12(a) and (b), the deformation of point 2 was less than that of point 1, and the deformation of point 4 was less than that of point 3. This phenomenon indicates that the deformation decreased along the direction of flow and that the four petal-shaped distribution of the deformation at was more obvious than that at . Fig. 12(c) shows that the deformation at was larger than that at . The total deformation of points 1-4 at was less than the clearance between the impeller and wear ring. However, the total deformation of points 1-4 at around the peak value during one impeller rotation was larger than the clearance between the impeller and wear ring of 0.3 mm. This deformation combined the displacement values in two mutually perpendicular directions through the SRSS algorithm and included both the seismic effect and the fluid-induced vibration without considering the phase of their displacements. Therefore, the total deformation was conservative.
Fig. 12Polar diagrams of deformation of monitoring points on impeller surface fitted with wear ring: a) Deformation of monitoring points at Qd1; b) Deformation of monitoring points at Qd2; c) Deformation of monitoring point 3
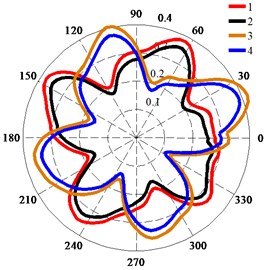
a)
b)
c)
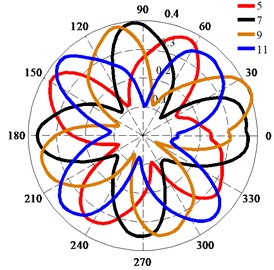
7.2. Trailing edge of impeller
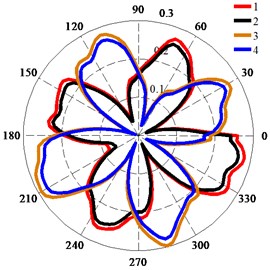
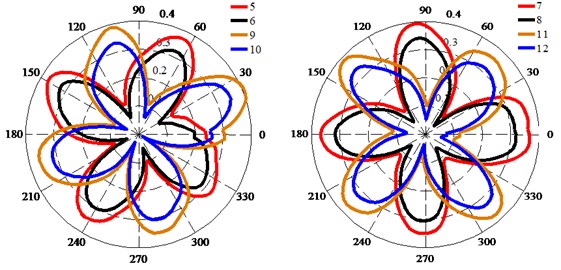
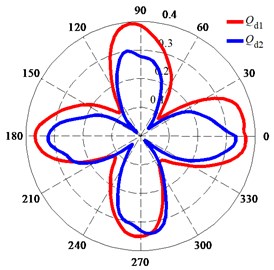
Fig. 13 shows the polar diagrams of the monitoring points in the trailing edge of impeller. The four petal-shaped distribution of the deformation of the trailing edge of impeller was more obvious than that of the impeller surface fitted with a wear ring. The deformations of points 5, 7, 9, and 11 were larger than those of points 6, 8, 10, and 12 (Fig. 13(a)), which shows that the deformation of the trailing edge of the impeller was larger on the shroud than on the hub. As shown in Fig. 13(a) and (b), the transition around the peak value at was smooth, the transition around the peak value at was less smooth than that at , and the distribution of the deformation at was less uniform than that at . This indicates that the influence of the fluid excitation force on the impeller surface fitted with a wear ring differed from the influence on the trailing edge of impeller. Fig. 13(c) shows that the deformation at was larger than that at . The deformation of points 5-12 was less than 0.4 mm; therefore, the total deformation considering both the seismic load and the fluid excitation force was much less than the 2 mm clearance between the impeller and diffuser.
Fig. 13Deformation of monitoring points on trailing edge of impeller: a) Deformation of monitoring points at Qd1; b) Deformation of monitoring points at Qd2; c) Deformation of monitoring point 7
a)
b)
c)
7.3. Equivalent passage
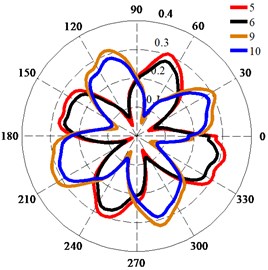
Fig. 14Deformation of monitoring points at equivalent passage
As shown in Fig. 14, the deformations of the trailing edge of the impeller on the shroud and hub are basically the same at different positions of an equivalent passage; only the phase of the deformation changes.
Therefore, the maximum deformation of the seismic response is much larger with the deformation caused by the fluid excitation force than that without, which indicates that the fluid excitation force must be considered during seismic response analysis.
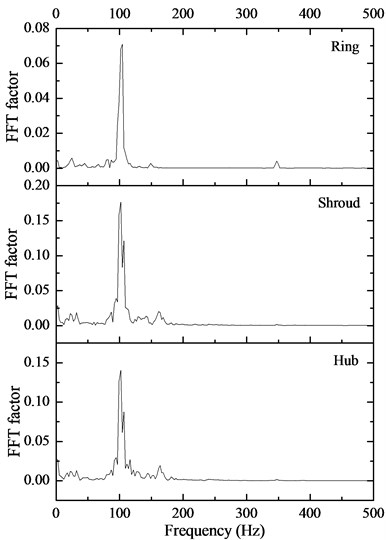
8. Frequency domain analysis
Fig. 15 shows the deformation characteristics in the frequency domain of the impeller surface fitted with a wear ring (ring) and the trailing edge of the impeller (shroud and hub). The dominant frequency of the deformation was about 100 Hz, which was four times the shaft frequency; this indicates that there were four peak values of deformation during one rotation of the shaft. This verified that the four petal-shaped distribution of the deformation was correct. Furthermore, the dominant deformation frequency of 100 Hz was much smaller than the primary vibration mode of the residual heat removal pump of 140 Hz; this indicates that the rotation of the impeller does not cause resonance of the pump structure.
Fig. 15Deformation characteristics in frequency domain
9. Conclusions
In the present study, seismic response analysis of the residual heat removal pump considering the fluid excitation force was performed by studying the deformation between the static and rotating components. The deformations of the impeller surface and trailing edge of the impeller met the clearance requirements in the seismic response analysis of the pump structure.
The primary vibration mode of the residual heat removal pump was the translational vibration in the horizontal direction, which shows that increasing the strength in the horizontal direction at the design stage can reduce the seismic influence on residual heat removal pumps. The total deformation of the impeller surface fitted with the wear ring was far below the unilateral clearance of the wear ring, and the total deformation of the trailing edge of the impeller was far below the unilateral clearance of the trailing edge of the impeller. Therefore, there was no rub or disturbance between the rotor and stator, and the operation of the pump under seismic load was guaranteed.
The deformation of the impeller surface fitted with a wear ring decreased along the flow direction. The deformations of the trailing edge of the impeller on the shroud and hub were basically the same at different positions of the impeller passage; only the phase of the deformation changed. Furthermore, the deformations of the impeller surface fitted with the wear ring and the trailing edge of the impeller had a four petal-shaped distribution. The dominant frequency of the deformation was four times the shaft frequency, which verified the correctness of the four petal-shaped distribution. The deformation of the trailing edge of the impeller was larger on the shroud than on the hub, and the deformation was larger at low flow rates than at high flow rates. Moreover, the fluid excitation force caused a large deformation. Therefore, the fluid excitation force must be considered in seismic response analysis.
References
-
Mario Villa, Nico Bernt, et al. Information management of the Fukushima reactor accident in Austria. Disaster Advances, Vol. 5, Issue 2, 2012, p. 61-63.
-
Brillant G., Marchetto C., Plumecocq W. Fission product release from nuclear fuel I. Physical modelling in the ASTEC code. Annals of Nuclear Energy, Vol. 61, 2013, p. 88-95.
-
Alvarado-Corona Rafael, Santos-Reyes Jaime Applying MORT to the analysis of the Haiti’s Earthquake. Disaster Advances, Vol. 5, Issue 4, 2012, p. 102-109.
-
Park H. S., Choi K. Y., Cho S., et al. Experiments on the heat transfer and natural circulation characteristics of the passive residual heat removal system for an advanced integral type reactor. Journal of Nuclear Science and Technology, Vol. 44, Issue 5, 2007, p. 703-713.
-
Bhardwaj R., Sharma M. L., Kumar A. Inclusion of Q-value in parameters used for earthquake early warning systems. Disaster Advances, Vol. 6, Issue 5, 2013, p. 54-60.
-
Wu Y. W., Su G. H., Qiu Suizheng, et al. Development of a thermal-hydraulic analysis software for a passive residual heat removal system. Annals of Nuclear Energy, Vol. 48, 2012, p. 25-39.
-
Vaithiyanathan V., Raj Anishin M. M., Venkatraman B. Disaster avoidance in industries through weld flaw detection from radiographic weld images using radon transform and improved fuzzy C-means clustering. Disaster Advance, Vol. 6, Issue 8, 2013, p. 47-53.
-
Karasudhi P., Wijeyewickrema A. C., Lai T. Seismic response to a prescribed seismogram of a body embedded in a multilayered half space. Computational Mechanics, Vol. 22, Issue 1, 1998, p. 70-76.
-
Suarez L. E., Singh M. P., Rohanimanesh M. S. Seismic response of rotating machines. Earthquake Engineering & Structural Dynamics, Vol. 21, Issue 1, 1992, p. 21-36.
-
Dimentberg M. F., Ryzhik B., Sperling L. Random vibrations of a damped rotating shaft. Journal of Sound and Vibration, Vol. 279, Issue 1, 2005, p. 275-284.
-
Zhou Wenjian, Chen Hong, Wen Bangchun Seismic response analysis of reactor coolant pump in nuclear power plant. Journal of Vibration and Shock, Vol. 25, Issue 1, 2006, p. 32-35.
-
Yang Xiaofeng, Zhang Yong, Sun Baitao, Hu Shaoqing Seismic analysis on canned motor pump used in nuclear power generating station. Earthquake Engineering and Engineering Vibration, Vol. 23, Issue 3, 2007, p. 47-53.
-
Zhou Wenxia, Zhang Jige, WangDezhong Analysis and assessment on seismic response of reactor coolant pump in nuclear power plant. Atomic Energy Science and Technology, Vol. 45, Issue 1, 2011, p. 54-59.
-
Jiang Y. Y., Yoshimura S., Imai R., et al. Quantitative evaluation of flow-induced structural vibration and noise in turbomachinery by full-scale weakly coupled simulation. Journal of Fluids and Structures, Vol. 23, Issue 4, 2007, p. 531-544.
-
French association for design. Construction and in-service inspection rules for nuclear island components. Design and Construction Rules for Mechanical Components of PWR Nuclear Islands, 2000.
About this article

This research is supported by the Key Program of National Natural Science Funds of China (Grant No. 51239005) and the National Science and Technology Pillar Program of China (Grant No. 2011BAF14B04) and the Natural Science Foundation of Jiangsu Province (Grant No. BK2011504) and the Graduate Innovation Funds of Jiangsu Province (CXZZ13_06).
