Abstract
In Taiwan, the capacities of spent fuel pools for temporary storage in nuclear power plant will reach depletion soon, and the site of final disposal facility is still to be decided. Therefore, the installation of dry-type interim storage facilities is urgent. The dry storage systems in Taiwan utilize a freestanding cask and design to non-anchored to the foundation pad. It is necessary to establish the simulation techniques for the non-anchored structure, such as the dry storage cask, for the reasonable assessment of its seismic behavior when the earthquake hit. This study is cast a 1/3 scale-down pedestal specimen of the INER-dry storage cask system, which were conducted to acquire the actual friction coefficient at the cask/pad interface as well as the effect of normal stress and sliding rate on it. Based on the results of cyclic loading testing, the cyclic frequency almost had no influence on the friction coefficient but the friction coefficient increased with the normal stress increased. Apparent rocking of the cask was induced at a higher friction coefficient, while sliding dominated the cask motion at a lower one. In addition, the cast motions were almost purely sliding and the range of the friction coefficient was between 0.60 and 0.73 under various compositions of dry storage cask system.
1. Introduction
Application and exploitation of the nuclear technologies and nuclear power plants brought us huge benefits, but the disposal of radioactive wastes was became one of the environmental and safety problems [1, 2]. In Taiwan, the space of spent fuel pools for temporary storage in Nuclear Power Plant No. 1 and No. 2 is running out, and the site of final disposal facility for the long-term storage of high radioactive waste is still to be decided [3]. Therefore, the installation of dry-type interim storage facilities is urgent. Most of dry storage systems utilize a freestanding cask, which is not anchored to the foundation pad. In an earthquake event, relative motion between the storage cask and the pad might be induced in terms of sliding, rocking, or even rolling [4, 5]. If the collision between casks and tipping over of cask are caused, there will be safety concerns of possible structural damage. Consequently, it is necessary to establish the simulation techniques for the non-anchored structure such as the dry storage cask for the reasonable assessment of its seismic behavior.
Unlike other civil engineering structures anchored to the foundations or soil, the dry storage casks are usually freestanding on a concrete pad. This structural pattern might cause the sliding, rocking or tipping-over of a dry storage cask on the storage pad during or after the damaging earthquake attacks [6]. However, the frictional resisting force of the storage cask can give the sliding resistance and it is an essential factor for the interface between the cask and concrete pad. Previous experimental studied were focus on the friction behavior between the cask pedestal and concrete pad using a shaking table or other dynamic testing [7-9]. These results were presented that seismic accelerations were led to sliding, tip over or other cask damages and these results were provided the recommendations for optimal storage cask design on freestanding and anchored cast system. In collusion, the friction coefficient of the interface between the cask and concrete pad is pivotal factor to the seismic response of the freestanding dry storage casks. In this study, the frictional behavior of a scaled-down pedestal specimen of the dry storage cask using cyclic loading tests was presented. This cask is developed in Taiwan INER under a project for developing a high capacity dry storage system [9]. The actual friction coefficient at the cask/pad interface and the effect of normal stress were also reported in this study.
2. Specimens
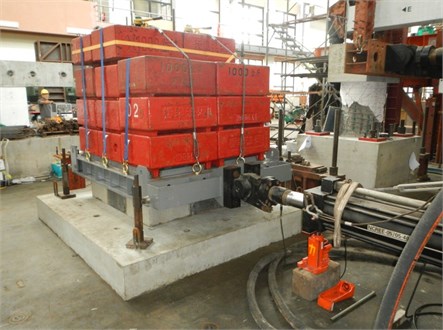
The 1/3 scaled-down dry storage pedestal specimen consisted of a canister, a vertical cylindrical cask (VCC), an add-on shield (AOS) and a concrete pad. The dimension of the VCC has an outer diameter of 1150 mm and a thickness of 300 mm. Two steel plates were placed at the top and bottom of the VCC, linked up by #10 rebar and then cast in concrete. The dimension of the AOS was a 1500 mm×1500 mm square, a height of 300 mm and with an inner diameter of 585 mm for a hollow circle. The #6 reinforced rebars and the #3 stirrups were lay up into the AOS specimen. The concrete pad was cast with a length of 2600 mm, a width of 2600 mm and a thickness of 300 mm as the foundation. The lateral and longitudinal rebars were used #6 reinforced rebars. In addition, the normal concrete of 210 kg/cm2 was used in accordance with ASTM C211.1. The appearance and details design of VCC, AOS, and concrete pad scale-down specimen are shown in Figs. 1-3, respectively. Also, the mass blocks were added in the pedestal specimen to simulate the superstructure of the actual dry storage cask. The appearance of the 1/3 scaled-down dry storage pedestal specimen was shown in Fig. 4.
Fig. 1Drawing of the VCC specimens
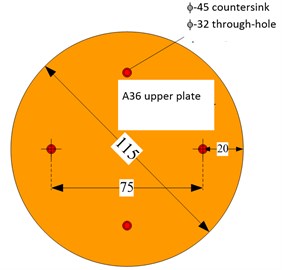
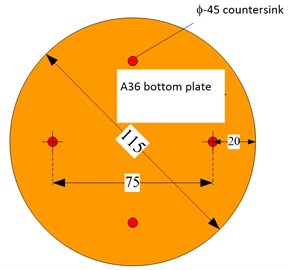
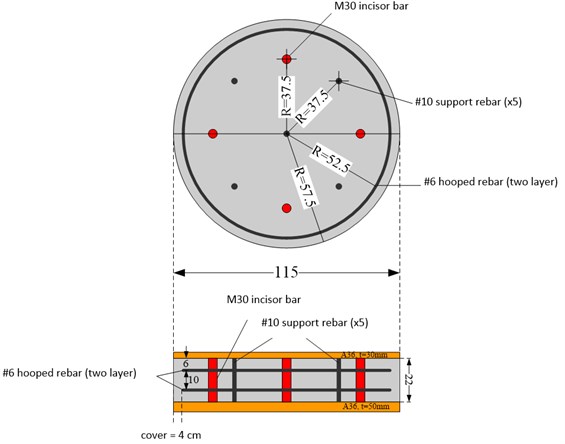
Fig. 2Drawing of the AOS specimens
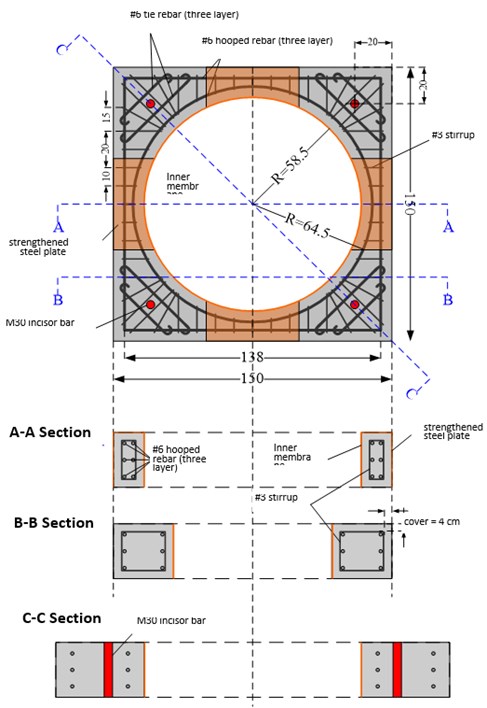
Fig. 3Drawing of the concrete pad specimens
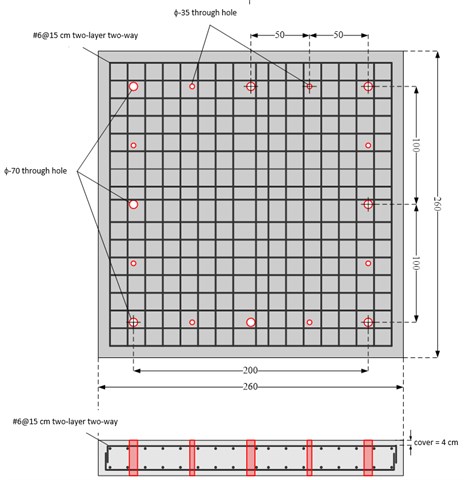
Fig. 4Appearance of the pedestal specimen
3. Test procedure
The cyclic loading test was used to evaluate the friction behavior of the interface between the cask and concrete pad. A 1000 kN capacity hydraulic actuator was used to apply a constant axial compressive load to the dry storage cask by the displacement-controlled cyclic test. Four excitation frequencies, 0.05 Hz (quasi-static), 1 Hz, 3 Hz and 5 Hz (dynamic) were selected for the test. The experimental alternatives and vertical mass blocks are listed in Table 1. The testing procedure and parameters are summarized in Table 2.
Table 1A schedule for cyclic loading tests
Case | Experimental alternatives | Normal stress simulation | Mass blocks (tf) |
Test-1 | VCC+AOS | Scale-down condition | 8.5 |
Test-2 | VCC+AOS | Actual condition | 25.5 |
Test-3 | VCC | Scale-down condition | 5.5 |
Test-4 | VCC | Actual condition | 16.4 |
Test-5 | AOS | Scale-down condition | 3.0 |
Test-6 | AOS | Actual condition | 9.1 |
Table 2Testing procedure and parameters for cyclic loading tests
Frequency (Hz) | Displacement vibration (cm) | Velocity vibration (kine) | Acceleration vibration (gal) | Cycles | Duration (sec) |
0.05 | 1.00 | 0.314 | 1.97 | 5 | 100.00 |
1.0 | 0.50 | 3.14 | 19.74 | 10 | 10.00 |
3.0 | 0.50 | 9.42 | 59.22 | 10 | 3.33 |
5.0 | 0.50 | 15.71 | 98.70 | 10 | 2.00 |
4. Results and discussion
4.1. Vertical cylindrical cask and add-on shield
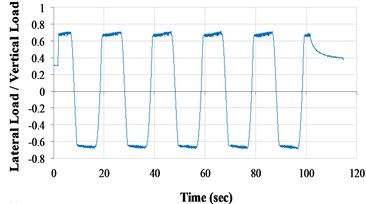
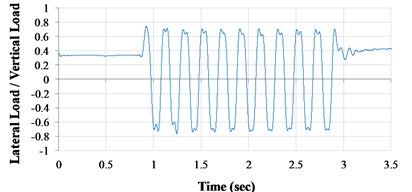
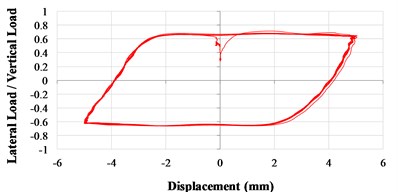
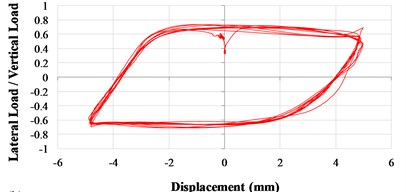
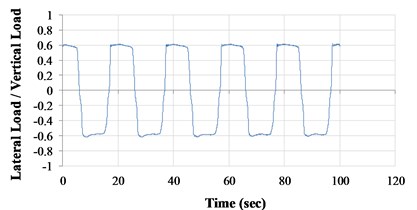
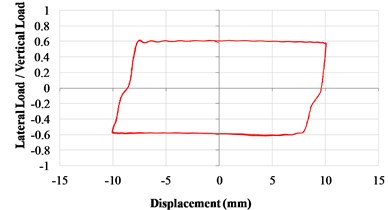
The relationships between lateral load/vertical load ratio (L/V ratio) and time of the VCC and AOS specimens at the cyclic frequency of 0.05 Hz are illustrated in Fig. 5. The relationships between L/V ratio and displacement of the specimens are shown in Fig. 6. The friction coefficient of the interface between the cask and concrete pad was defined by the maximum of the L/V ratio. During this testing, the static friction coefficient is similar to the kinematic friction coefficient due to the motion behavior. This result was also consistency with the previous study [7]. As shown in Fig. 5, the friction coefficient could be assumed to be constant and set to about 0.60 for the scale-down condition. The friction coefficient was set to 0.67 for the actual loading condition as shown in Fig. 6. The normal stress increased up to 3 times, the friction coefficient increase up to 12 %. Thus, the influence of normal stress on the friction coefficient was significant differed from other engineering cases. The L/V ratio versus time or displacement curves under various cyclic frequencies are illustrated in Fig. 7 and 8, respectively, in which there was no significant difference between cyclic frequency and friction coefficient. The friction coefficient was constant and set to about 0.67. Therefore, the cyclic frequency was not the factor to affect the friction coefficient.
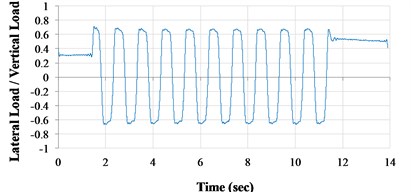
Fig. 5Lateral load/vertical load ratio versus time curves (VCC+AOS, 0.05 Hz) a) scale-down condition; b) actual condition
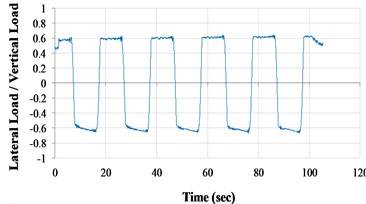
a)
b)
Fig. 6Lateral load/vertical load ratio versus displacement curves (VCC+AOS, 0.05 Hz) a) scale-down condition; b) actual condition
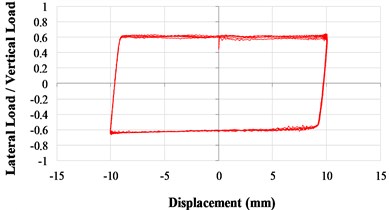
a)
b)
Fig. 7Lateral load/vertical load ratio versus time curves (VCC+AOS, actual condition) a) 1 Hz; (b) 3 Hz; c) 5 Hz
a)
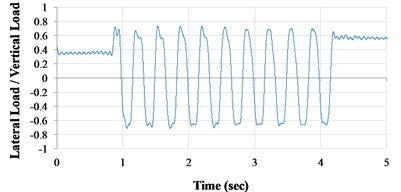
b)
c)
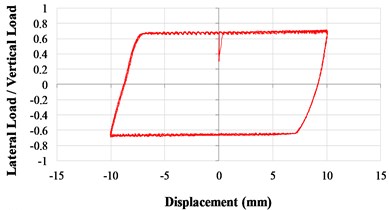
Fig. 8Lateral load/vertical load ratio versus displacement curves (VCC+AOS, actual condition) a) 1 Hz; b) 3 Hz; c) 5 Hz
a)
b)
c)
4.2. Vertical cylindrical cask
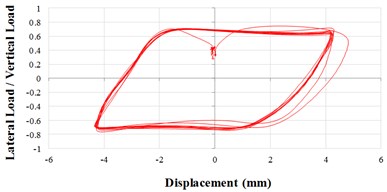
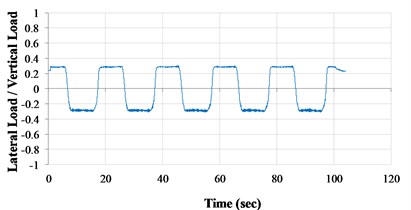
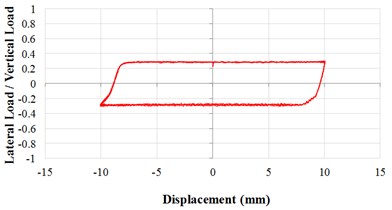
The L/V ratios versus time or displacement curves at the cyclic frequency of 0.05 Hz are shown in Fig. 9. It indicated that the value of the friction coefficient was about 0.60 and did not increase or decrease further when the time or displacement was altered. The friction coefficient of the VCC specimens was lower than that of the VCC and AOS specimens due to the property of the specimen bottom. The friction coefficient proposed by Shiraj was about 0.5 and lower than that found in the proposed testing method [7]. This is because that the normal stress was different from those cases.
Fig. 9Lateral load/vertical load ratio versus a) time curves and b) displacement curves (VCC, 0.05 Hz)
a)
b)
4.3. Add-on shield
The L/V ratios versus time or displacement curves at the cyclic frequency of 0.05 Hz are shown in Fig. 10. It indicated that the friction coefficient of the AOC was the lowest than other cases and the value was about 0.30. The friction coefficient of the AOC was significant lower than the value proposed by Shiraj (about 0.70) [7]. Because the AOS testing was carried out ultimately, the concrete surface was worn, resulting smooth surface and decreased surface roughness. Based on the equivalent area calculation (the average of the friction coefficient between the VCC and the AOS is similar to that of the VCC with AOS due to the similarly contact area between the VCC and AOS specimen individually), the calculated friction coefficient of the AOC was about 0.73 which was similar to the previous study [7].
Fig. 10Lateral load/vertical load ratio versus a) time curves and b) displacement curves (AOS, 0.05 Hz)
a)
b)
5. Conclusions
The cyclic loading test was performed for evaluation the friction coefficient of the 1/3 scaled-down dry storage pedestal specimen. Test results indicated that the friction coefficient of the VCC with AOS, VCC and AOS under actual loading condition was about 0.67, 0.60 and 0.73, respectively, which is consistency with the previous study proposed by Shiraj. In addition, there was no significant difference between cyclic frequency and friction coefficient. The normal stress increased (about 3 times) with the friction coefficient increase (about 12 %). Moreover, it is suggested to allow the sliding motion but to prevent the rocking motion for the high capacity dry storage system. It also could be achieved by setting an appropriate friction coefficient at the interface between the cask and concrete pad.
References
-
Chapman N., Hooper A. The disposal of radioactive wastes underground. Proceedings of the Geologists’ Association, Vol. 123, Issue 1, 2012, p. 46-63.
-
Yoshida H., Aoki K., Semba T., Ota K., Amano K., Hama K., Kawamura M., Tsubot K. Overview of the stability and barrier functions of the granitic geosphere at the Kamaishi Mine: relevance to radioactive waste disposal in Japan. Engineering Geology, Vol. 56, Issue 1-2, 2000, p. 151-162.
-
Liu S. J., Soong K. L., Yang J. T. Final disposal of spent nuclear fuel in Taiwan: A state-of-the-art technical overview. Waste Management, Vol. 9, Issue 3, 1989, p. 171-188.
-
Ko Y. Y., Hsu S. Y., Chen C. H. Analysis for seismic response of dry storage facility for spent fuel. Nuclear Engineering and Design, Vol. 239, Issue 1, 2009, p. 158-168.
-
Chen K. C., Ting K., Li Y. C., Chen Y. Y., Cheng W. K., Chen W. C., Liu C. T. A study of the probabilistic risk assessment to the dry storage system of spent nuclear fuel. International Journal of Pressure Vessels and Piping, Vol. 87, Issue 1, 2010, p. 17-25.
-
Saegusa T., Yagawa G., Aritomi M. Topics of research and development on concrete cask storage of spent nuclear fuel. Nuclear Engineering and Design, Vol. 238, Issue 5, 2008, p. 1168-1174.
-
Shirai K., Wataru M., Saegusa T. Experimental studies of free-standing spent fuel storage cask subjected to strong earthquake. 15th PATRAM, Miami, Florida, 2007.
-
Saegusa T., Shirai K., Arai T., Tani J., Takeda H., Wataru M., Sasahara A., Winston P. L. Review and future issues on spent nuclear fuel storage. Nuclear Engineering and Technology, Vol. 42, Issue 3, 2010, p. 237-248.
-
Wu T. Y., Lee H. Y., Kang L. C. Dynamic response analysis of a spent-fuel dry storage cask under vertical drop accident. Annals of Nuclear Energy, Vol. 42, 2012, p. 18-29.
About this article

This support of the National Science Council (NSC) under the Grant NSC102-3113-P042A-009 in Taiwan and National Center for Research on Earthquake Engineering (NCREE) is gratefully acknowledged.
