Abstract
The laser based non-contact and high bandwidth technique was developed to measure the natural frequency of vibrations in a thin string. The string, which is caused to vibrate by a piezoelectric actuator, was located in the middle of a beam of light from a laser. Changes in the power of the laser light resulting from micro-vibrations of the string were measured by a two-quadrant photo sensor. Tennis racket strings were selected for use in this experiment and vibrations were generated over a range of different frequencies to validate the laser measurement system. The results showed that the measured signals, which for analysis were subject to Fast Fourier Transformation, were coincident with the input frequency. Finally, the natural frequencies of strings subjected to different tension force were measured and analyzed to determine the validity of the method. The results showed a relative error of less than 0.6 %.
1. Introduction
The natural vibration frequency of a line is an important factor for determining line tension and other characteristics. Consequently, this makes measurement of the frequency and amplitude of line vibration (for setting line characteristics) rather important as well. In 1990, Wright [1] proposed a stable fiber optic interferometer for measuring vibration. It is composed of two laser diodes and a polarization maintaining fiber. This system can be applied to micro-vibration measurement in micro-machined silicon pressure sensor testing. In 1997, Suzuki et al. [2] proposed a “feedback” type laser diode (LD) interferometer using a flexible optical fiber with the following advantages: 1) the measuring probe can be placed wherever it is required; 2) no reference mirror is needed; 3) real-time measurement without phase unwrapping is possible; 4) external interference is automatically eliminated. In 2005, Yang et al. [3] used an FSI system with a pair of optical fibers to measure absolute distance and vibration with high precision. The absolute distance was determined by counting interference fringes and scanning the laser frequency. In 2006, Giancarlo Pedrini et al. [4] used high-speed digital holographic interferometry to measure object surface vibration: 1) where the collection frequency was much higher than the vibration frequency; 2) where the periodic oscillation was measured by recording the interference of different vibration periods. Time or space phase unwrapping is not required with this method, but the phase change between two exposures must be less than . This makes it necessary to obtain interference data over very short periods of time. In 2007, Fu et al. [5] used an image plane-based global non-contact measurement method of digital holography to measure the displacement, speed and acceleration of a vibrating object. In addition, they used a high-speed CCD camera to capture digital holograms of vibrating objects, which were reconstructed to obtain complex matrices of 3D band noise. The transient displacement, speed and acceleration were extracted by Fourier analysis and windowed Fourier analysis of spatial and time domains. In 2012, Xiang et al. [6] used a laser torsional vibrometer to measure the torsional vibration on rotational axes of power grid lines. A non-contact measurement mode is better than conventional technology. The effect of power on the grid can excite the natural torsional vibration frequency and this will change under the influence of electrical interference. Some researchers have proposed the analysis of resonance by the acceleration method [7-8]. Laser measurement techniques have also been widely developed and demonstrate the feasibility of noncontact methods and the measurement of small object displacement [9-12]. This study however differs from previous work in that the two-quadrant detector in the laser based system measures differential power allowing the quantification and qualification of vibrational frequency in the string.
2. Measurement arrangement
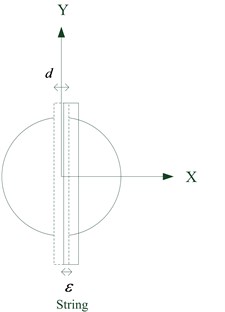
The arrangement of the experimental devices and measurement system is shown in Fig. 1. The laser measurement system consists of a laser diode and a two-quadrant photo sensor. When the device is set up the laser is adjusted so that the outputs of the two quadrants of the sensor are equal, see Fig. 2(a). The tennis racket string used for system validation is arranged as shown in Fig. 2(b). The ends of the string are fixed to the supports and a piezoelectric actuator is used to impart vibrational displacement to the string. The tennis string is placed in the laser beam, between the sensor quadrants and the position of the tennis string is adjusted to exactly equalize the incident energy of the laser beam (interrupted by the shadow of the string) on the two quadrant photo diodes, as shown in Fig. 2(b). When this adjustment has been made measurement can begin.
Fig. 1Measurement system arrangement and experimental devices
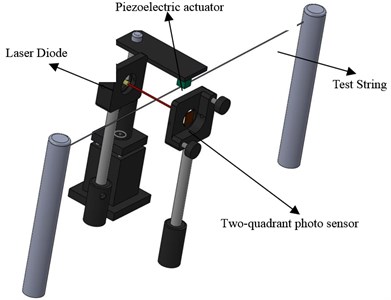
Fig. 2Schematic diagram of laser spot incidence on the two-quadrant light detector
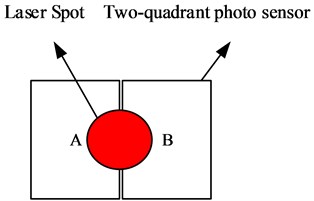
a)
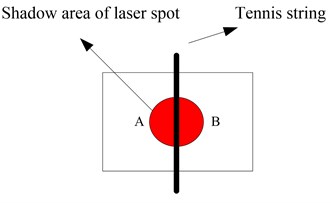
b)
3. Analysis of laser measurement principle
3.1. Differential power method
3.1.1. Gaussian distribution of the laser beam
The electric field distribution of the Gaussian beam can be expressed as:
According to Eq (1), the light wave propagates towards the -axis, and radial is normal to the -axis, (a) is the amplitude term, varying with value; (b) which means the beam varies with -axis phase; (c) represents the variation of a light beam with radial phase, as shown in Fig. 3. Where , wave number and is the beam waist radius.
Fig. 3Electric field distribution characteristics of the Gaussian beam
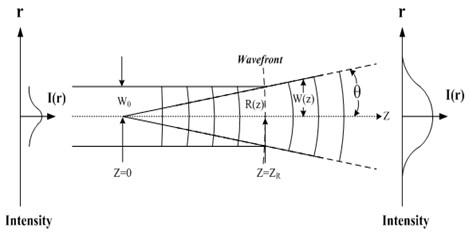
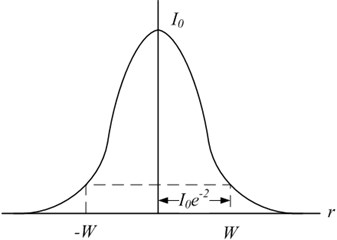
Fig. 4Gaussian light intensity distribution and beam cross-section radius
The beam size and wavefront curvature radius at a distance of to the beam waist can be defined as follows:
The photo sensor measures the light intensity distribution and the Gaussian laser beam distribution can be expressed by the following equation:
were, is the maximum light intensity in the center of the light spot; is the radius of Gaussian beam section, the maximum light intensity of the spot center attenuates to , expressed by the following equation. The Gaussian light intensity distribution is shown in Fig. 4:
3.1.2. String scanning method
The Gaussian light intensity distribution, Eq. (4), can be expressed by rectangular coordinates as follows:
where , is the beam center, the center light intensity is and is the total power of the laser. The single string scanning method simulates a single knife-edge normal to the light beam, which moves towards the light beam. When the knife-edge shades the light source, the photodetector receives only the unshaded laser power. When the knife-edge moves in the -direction shielding light source, as shown in Fig. 5, the unshaded luminous power can be expressed by the following equation:
If is divided by the total laser power , the laser power variation caused by the environment or the power supply can be eliminated to normalize the system. The equation can be deduced from Eq. (7):
This is the basic principle of the laser based differential power measurement system for vibration measurement used in this study. The vibration information is available as output power changes as the string movement modulates the light falling on the detector.
Fig. 5Schematic diagram of single string scanning towards the x-axis
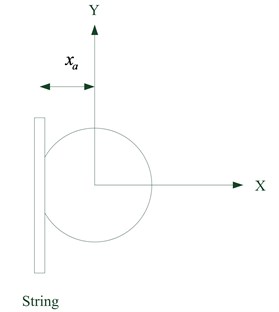
Fig. 6Vibration of the string at the middle of the laser beam
4. Two-quadrant photo sensor calibration
and represent the laser power at the two-quadrant photo sensor. The differentiation of the output value of the two-quadrant photo sensor about the direction is expressed by Eq. (9):
As shown in Fig. 6, when the string is located in the middle of the laser beam and exactly between the photo sensors, the differentiation of output value of the two-quadrant photo sensor with respect to the displacement in the direction is derived as:
Here results from vibration of the string. The output value can be converted to analog signals for further analysis.
To measure the displacement caused by string vibration, the relationship between voltage output and displacement on the two-quadrant photo sensor must be calibrated. This photo sensor is a photovoltaic component, the output of which depends on the position of the incident light spot on its surface. The sensor used in this experiment is one-dimensional and only measures vibration in one radial direction. This output is converted to a voltage signal, amplified and fed into an analog-to-digital converter after which the vibration frequency can be analyzed in the computer. The calibration procedure is described below:
1) The laser spot is set in the middle of the photo sensor.
2) The plastic string is adjusted until it is in the middle of the light spot.
3) The position of the string is measured by laser interferometry after the string has moved 10 µm forward, when it has moved past the origin and reached 10μm in the opposite direction it is recorded again.
4) Data processing analysis of the voltage/displacement calibration curve.
The experimental results are shown in Fig. 7. Fig. 7(a) shows the results of three calibrations within a correction range of +/–100 μm. The calibration curve is nonlinear and this may be because the string bends and deforms during the calibration process, but repeatability (three results) is good. Fig. 7(b) shows the standard deviation is less than 0.2 μm, so the resolution of this measurement system was estimated to be about 0.4 μm.
Fig. 7Calibration of relationship between voltage and displacement
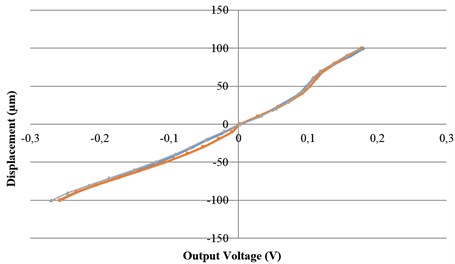
a) Calibration curve
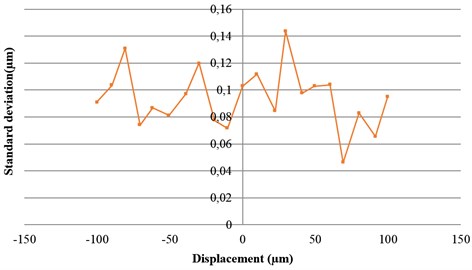
b) Standard deviation
5. Experimental results
5.1. Frequency validation test
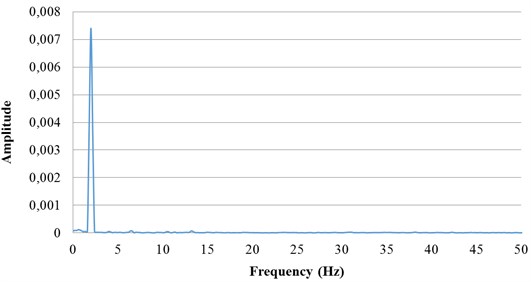
This study used a piezoelectric actuator to move a tennis racket string, and a laser measurement system to determine the vibrational frequency of the movement. The allowable voltage of the piezoelectric block used for this experiment was –30 V~120 V, the maximum scaling being 2 μm. To ensure experimental stability negative voltages were avoided and the range used was between 10 and 110 V. The pre-stressed string was set exactly in the center of the laser spot and the piezoelectric actuator was then adjusted so that it was in proper physical contact with the string. Computer software controlled an A/D converter card to supply the piezoelectric actuator with a sine voltage. The amplitude and frequency was set to vibrate the string at 2 Hz and 6 Hz. Fig. 8 shows the measurement results at different frequencies and includes time domain and frequency spectra. Frequencies of 2 Hz and 6 Hz were analyzed. These experiments demonstrated conclusively that the experimental measurement system described here was capable of accurate analysis of these frequencies.
5.2. Natural frequency measurement
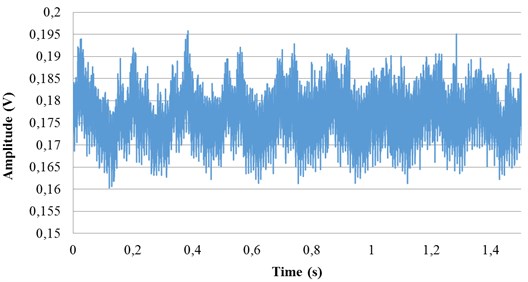
For natural frequency measurement the string was excited once and the laser measurement system was used to measure the vibrational displacement. In order to prevent the external noise, including background vibration, the overall system was setup on a vibration isolation table in this experiment. The band pass filter also can be used to filter the unexpected ranges of frequency. Three experiments using strings under different tension forces, 64.29 N, 85.17 N and 86.82 N were performed. Tension was set using a commercial contact tension force meter with a resolution of 0.05 N. The sampling rate was 10 kHz. The measurement results are shown in Fig. 9. Fig. 9(a) shows the vibration signal when the plastic string was excited and the other figures show the three different natural frequencies at three different tension forces. The natural frequencies can be analyzed accurately by FFT and were found to be 344 Hz, 396 Hz and 401 Hz respectively. From the analytical model of one dimensional wave equation, the nature frequency of a string can be calculated approximately using the following equation:
where (Hz) is the natural frequency; is the line density; is the length and is the tensional force. In this case, the lengths of plastic string were 0.3234 m, 0.3242 m and 0.3265 m respectively. is 0.00128 kg/m. The natural frequencies with different tension forces can be calculated using Eq. (11) and are shown in Table 1. From the table it can be seen that the relative errors between the two methods is less 0.6 %. The verification results show the proposed non-contact measuring method is feasible and can be used for on-line natural frequency and tension force measurement.
Table 1Comparison results
Analytical method | Laser differential measure method | Relative error | |
Case 1 | 346 Hz | 344 Hz | 0.6 % |
Case 2 | 398Hz | 396 Hz | 0.5 % |
Case 3 | 399 Hz | 401 Hz | 0.5 % |
Fig. 8Measurement results at different frequencies
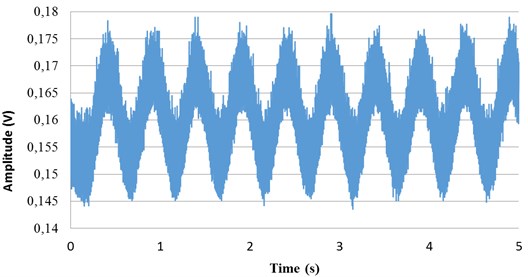
a) Signal measured by laser measuring system
b) FFT analysis
c) Signal measured by laser measuring system
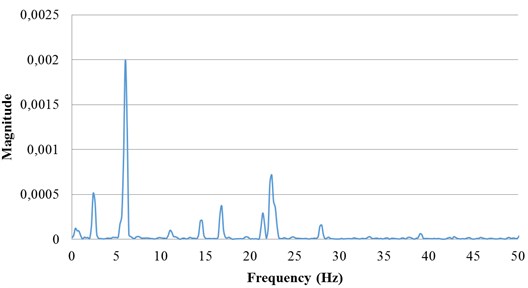
d) FFT analysis
Fig. 9Natural frequency measurement results for three cases
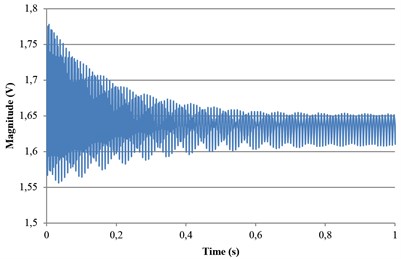
a) Vibration signals measured by laser measurement system
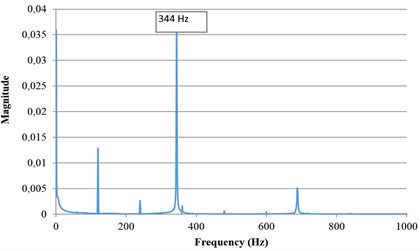
b) Natural frequency analyzed by FF (Tension force 64.29 N)
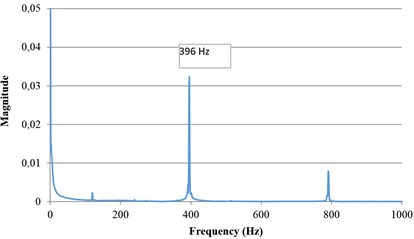
c) Natural frequency analyzed by FFT (Tension force 85.17 N)
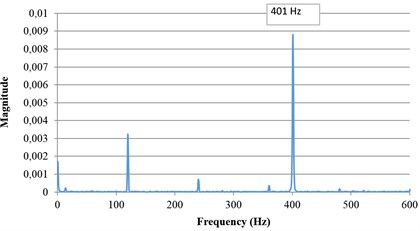
d) Natural frequency analyzed by FFT (Tension force 86.82 N)
6. Conclusions
This study successfully used a laser to measure the vibration and natural frequency of a fine string. The measurement is based on laser differential power measurement. The plastic string interrupts part of the laser beam, forming a shadow on the two-quadrant photo sensor. When the string vibrates, the position of the shadow changes with the vibration of the string. The string vibration amplitude and frequency can be calculated from the differences in the laser power received by two-quadrant photo sensor. The natural frequencies of the strings with both ends fixed under different tension forces were also measured successfully and demonstrated the feasibility of using this laser differential power measuring method.
References
-
Wright O. B. Stabilized dual-wavelength fiber-optic interferometer for vibration measurement. Optics Letters, Vol. 16, Issue 1, 1991, p. 56-58.
-
Suzuki T., Okada T., Sasaki O., Maruyama T. Real-time vibration measurement using a feedback type of laser diode interferometer with an optical fiber. Optical Engineering, Vol. 36, Issue 9, 1997, p. 2496-2502.
-
Yang H. J., Deibel J., Nyberg S., Riles K. High-precision absolute distance and vibration measurement using frequency scanned interferometry. Applied Optics, Vol. 44, Issue 19, 2005, p. 3937-3944.
-
Pedrini G., Osten W., Gusev M. E. High-speed digital holographic interferometry for vibration measurement. Applied Optics, Vol. 45, Issue 15, 2006, p. 3456-3462.
-
Fu Y., Pedrini G., Osten W. Vibration measurement by temporal Fourier analyses of a digital hologram sequence. Applied Optics, Vol. 46, Issue 23, 2007, p. 5719-5727.
-
Xiang L., Li S., Cui W. Measurement and analysis of torsional vibration signal for rotating shaft system. 9th International Conference on Fuzzy Systems and Knowledge Discovery, 2012, p. 1851-1854.
-
Hsieh W. H., Chen T. I. On the resonance analysis for compliant bionic jellyfishes. Science China Technological Sciences, Vol. 53, Issue 11, 2010, p. 2976-2982.
-
Hsieh W. H., Tseng C. Y. Acceleration improvement for coil winders of RRRCC type by variable input speed method. Journal of Vibroengineering, Vol. 14, Issue 4, 2012, p. 1459-1468.
-
Liu C. H., Jywe W. Y., Lee H. W. Development of a simple test device for spindle error measurement using a position sensitive detector. Measurement Science and Technology, Vol. 15, Issue 9, 2004, p. 1733-1741.
-
Liu C. H., Jywe W. Y., Chen C. K. Development of a diffraction-type optical triangulation sensor. Applied Optics, Vol. 43, Issue 30, 2004, p. 5607-5613.
-
Liu C. H., Jywe W. Y., Shyu L. H., Chen C. J. Application of a diffraction grating and position sensitive detectors to the measurement of error motion and angular indexing of an indexing table. Precision Engineering-Journal of the International Societies for Precision Engineering and Technology, Vol. 29, Issue 4, 2005, p. 440-448.
-
Jywe W. Y., Chen C. J., Hsieh W. H., Lin P. D., Jwo H. H., Yang T. Y. A novel simple and low cost 4 degree of freedom angular indexing calibrating technique for a precision rotary table. International Journal of Machine Tool and Manufacture, Vol. 47, Issue 12-13, 2007, p. 1978-1987.
About this article

