Abstract
Condition-based maintenance (CBM) has become a hot research topic in recent decades. For enhancing the CBM ability, many researchers pay attention to the incipient fault detection and remaining useful life (RUL) prediction. Detecting faults earlier can provide enough lead time to manage the maintenance actions. Besides of this, predicting RUL more accurate can avoid the over maintenance and utilize the components’ life sufficiently. As we know, good degradation features are very important for RUL prediction. However, extracting a monotonous degradation feature is easier for stationary condition than non-stationary condition. In order to address above two issues, this paper uses a new signal processing method named narrowband interference cancellation (NIC) to do degradation analysis. It can extract periodic impulse signals from very noise background which mainly contains narrowband signals. So, the incipient faults can be found easier. The energy ratio calculated based on NIC can be used as degradation feature under non-stationary condition. To verify the effectiveness of NIC based processing, two gearbox run-to-failure tests were conducted. One is under relative stationary condition; the other is under non-stationary condition. The results of these two experiments demonstrate the validity of proposed methods.
1. Introduction
Gearboxes are one of the most important components of transmission systems of rotating machineries such as helicopters, vehicles, and wind turbines etc. Effective condition monitoring works of these gearboxes can save much maintenance costs and avoid many catastrophes. In recent decades, incipient fault detection, fault diagnosis and prognosis have become the hot research contents of condition-based maintenance (CBM) [1]. For some enterprises, capital equipments’ failures will lead to great economical loss and has big security risks. Therefore, they prefer to detect the faults earlier and replace the fault components timely. For implementing CBM effectively, the incipient fault detection is very important to support enough lead time for planning the maintenance actions.
For vibration signals of gearboxes, impulsive signals produced by incipient faults are usually immersed in noises. Therefore, many methods are developed to enhance the impulsive signals or to suppress the noises. Wang and Jiang [2] proposed an adaptive wavelet threshold de-noising method to enhance the fault feature and used correlation dimension as the degradation indicator. Sun et al. [3] proposed a multi-wavelet de-noising technique with the data-driven block threshold. The optimal block length and threshold at different decomposition levels can be selected using minimum Stein’s unbiased risk estimate. Yan and Lu [4] proposed an improved Hilbert-Huang transform (HHT) to detect the incipient fault. In this improved HHT, wavelet analysis was used to remove the iterative errors in the sifting process and a new stopping criterion based on correlation analysis was developed. Abad et al. [5] used discrete wavelet transform and artificial neural network to detect the gear faults based on acoustic signals. However, useful signals also will be suppressed when de-nosing. Except of this, the gear signal will be noise when we only want to detect the bearing faults. Many de-noising methods will not work in this case. So, many researchers pay attention to series methods which mainly filter the useless signals out or enhance the weak impulsive signal produced by faults. Wang and Wong used autoregressive (AR) model to remove the regular toothmesh pattern for enhancing the impulsive signal produced by gear faults [6]. Endo and Randall [7] proposed the use of minimum entropy deconvolution (MED) technique to enhance the ability of the existing AR model based filtering technique to detect localized faults in gears. Under this fundamental, some other revised AR models are also developed to detect the gear faults under constant load [8, 9]. Then, Yang and Makis further developed an ARX model based gear fault detection and localization under varying load conditions. This method considers load as additional information and tests validated it can be used in real situations [10]. Recently, in order to overcome the deficiency of MED, McDonald et al. [11] proposed an improved novel deconvolution norm, Correlated Kurtosis, which takes advantage of the periodicity of the faults and requires no AR model stage prior to deconvolution. For signals of gear faults, it usually contains many narrowband signals (gear vibration signals of normal mesh motion) and broad noise which mask the desired periodic impulsive signals produced by gear faults. If the narrowband signals can be filtered out, the impulsive signals will be manifest. According to this character, Bechhoefer [12] used a new method named Narrowband Interference Cancellation (NIC) to enhance the gear faults detection. This method can enhance the periodic impulsive signal. Therefore, it can be used to detect incipient faults.
Except incipient fault detection, in order to avoid unnecessary maintenance, we should implement maintenance near the failure time. This needs a more accurate remaining useful life (RUL) prediction. Besides of the RUL prediction methods, a good monotonous degradation feature is very critical for RUL prediction. Si et al. [13] proposed a degradation path-dependent approach for RUL estimation. They mainly paid attention to prediction model development and algorithm revision. A linear degradation model and an exponential-based degradation model were used to simulate degradation data and illustrated effectiveness of the proposed methods. Tran et al. [14] proposed a three-stage method for assessing the machine health degradation and forecasting the RUL. In the paper, the compressor was operated at an approximately constant speed. Wei et al. [15] proposed a RUL prediction method based on distributed fusion filtering which can utilize multi-sensor information. This paper also paid the main attention to the RUL distribution estimation and the degradation data were simulated under idealized condition. Gašperin et al. [16] proposed a framework for data-driven prediction of RUL with on-line model estimation. This was achieved by combining state estimation algorithm with Maximum-Likelihood parameter estimation in the form of the Expectation-Maximization algorithm. In the paper, a gearbox life test was conducted to validate the effectiveness of proposed method. The set of gears was operated under constant speed and load condition. Qiu et al. [17] used singular value decomposition to optimize wavelet filtering parameters and extracted better degradation indicators for bearing life process. The bearing run-to-failure (RTF) test used in this paper is conducted under constant speed and load. Since then, many researchers used these data sets to validate their models [18]. All above mentioned researches predicted RUL or do degradation analysis under stationary conditions. Because good degradation features of mechanical components can be extracted under stationary conditions easier. Most of RUL prediction methods will have good effect only if the degradation features used are monotonous. However, in engineering real, most mechanical components are working under non-stationary conditions. Take helicopter for example, its speed and load are varying with the flight height and mission. For wind turbine, the gearbox’s speed and load are varying with the wind speed and power. Especially for some military vehicles, they always work on the hilly area. And their speed and load are varying constantly. For incipient fault detection and fault diagnosis, we can use a very short period vibration signals which are relative stationary to do analysis. Or we can use order tracking analysis to overcome the speed variation. Load variation will not have a great influence to the incipient fault detection and fault diagnosis. Because of these two items are mainly relied on the frequency spectrum analysis. For life data analysis, the degradation features will be influenced by varying speed and load. Even if order tracking analysis can overcome the varying speed’s influence, the varying load will enabled the features are not monotonous. Under this case, all RUL prediction methods will not work.
In order to address this problem, Dempsey and Zakrajsek [19] modified the NA4 calculation to minimize the load effects. Results indicated the revised NA4 was no longer sensitive to load changes and also can reflect the pitting damage of gear. However, in their experiment, only 10 percent load change was considered. Li et al. [20] developed a new method using energy ratio to depict the bearing’s degradation under abnormal operating conditions which the bearing spins on the shaft. The energy ratio is calculated based on the following concepts. Vibration signal of one component contains two parts: one is deterministic part; the other is the residual part. In the paper, these two parts was separated by AR model. When the component is in normal condition, the deterministic part denotes normal vibrations of this component and the other parts which contained in the test rig. The residual part only denotes random noise. When the component is working under constant conditions, the faults of the component will increase the residual part while the deterministic part will remain the same. This is because the residual part contains periodic impulsive signals produced by the component faults. When the faults progress with time, the energy of the residual part will also increase. So, the energy ratio of these two parts will increase with the component’s degradation. When the component is working under varying conditions, the energy of these two parts will increase or decrease at the same time. So the energy ratio is not sensitive to varying conditions. Recently, Zhang et al. [21] used this method to extract the degradation feature of gearbox under non-stationary conditions. They compared the energy ratio with the traditional features and demonstrated the effectiveness of this method. Inspired by this concept, in this paper, we will use the NIC to separate the deterministic and residual part and use the new energy ratio to track the degradation of gearbox under non-stationary conditions. The NIC technique can both resolve the problems of incipient fault detection and degradation indicator extraction. In this paper, two gearbox RTF test were conducted to illustrate the effectiveness of this method. The effectiveness of energy ratio based on NIC under relative stationary conditions is compared to another sideband index also based on NIC proposed by Zhang et al. [22]. In addition, its effectiveness under non-stationary condition is compared to the AR based energy ratio. Both these comparisons demonstrated the validity of the proposed method. And, the parameter optimization of NIC also was considered when implemented the data analysis.
The remainder of this article can be organized as follows. Section 2 introduces the NIC theory and the energy ratio calculation. Section 3 describes the two RTF experiments and detail test process. Section 4 concentrates on the enhanced fault detection based on NIC. The degradation indicator extraction based on NIC under non-stationary condition and comparison work with the AR model and sideband index are shown in Section 5. Section 6 has a discussion and future work outlook. Section 7 concludes the paper.
2. Theoretical background of narrowband interference cancellation
For gear faults, they will produce impulse signals with relative characteristic frequencies. So the vibration signals collected from machines contain gear mesh, shaft rotation, bearing vibration and random noise. For the signals produced by gear and shaft, they are narrowband. But the impulse signals generated by gear faults are in a wideband. Usually, gear fault signals are very weak compared to the gear mesh tones and shaft rotation. So, if we can filter out these narrowband signals, the signals of gear faults can be detected easier. A machine system can be modeled as:
where is the signal of interest, is the signal associated with gear mesh, shafts rotation, e.g. interference, is random noise.
The interference signal is usually large compared to the signal of interest. It is necessary to remove the interfering signal from while preserving the signal of interest . Since the measured signal and the interference signal are correlated, one can estimate the interference using an optimal linear estimator:
where is an integer delay operator. If 1, then Eq. (2) is the least square forward linear predictor. If , the output of the filter is . This means we can completely remove the interference and only the desire signal and noise remains. In practice, signal is not available. To overcome this obstacle, we can use a minimum means square error -step forward linear predictor, such that:
where:
For this modeling, the components of the observed signal have the following properties:
• The signal of interest , the interference signal , and the noise signal are mutually uncorrelated.
• The noise signal is white.
• The signal of interest is wideband and has a short correlation length (e.g. it’s impulsive).
• The interference signal has a long correlation length: its autocorrelation length takes significant values over the range , for .
In practice, the second and third properties mean that the desired signal and the noise are approximately uncorrelated after a certain small lag. These are precisely the properties exploited by the canceller to separate the narrowband interference from the desired signal and the background noise.
According to the first assumption, we have:
If the second and third modeling assumptions hold true, we have:
The exclusion of the lags for in and is critical, and we have arranged for that by forcing the filter and the predictor to form their estimates using the “delayed” data vector . From Eqs. (5), (8), and (11), we conclude that and therefore . Thus, the optimum narrowband interference estimator is equal to the -step linear predictor , which can be determined exclusively from the input signal . Then, the signal with interference removed is:
which is identical to the -step forward prediction error. This leads to the linear prediction NIC shown in Fig. 1. For a full description of the analysis, we can see [23].
Fig. 1Block diagram of linear prediction NBI canceller
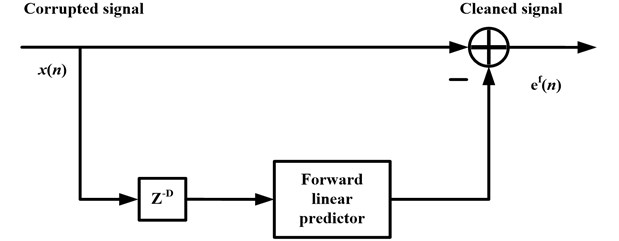
From the above analysis, we know the is the periodic impulsive signal produced by gear faults and the denotes the normal vibration signal except the faults. The purpose of the NIC is to filter the out from the signal . This means the NIC can separate the deterministic part and the residual part. So, we can use to denote the deterministic part and the to denote the residual part. Therefore, the energy ratio based on NIC (ER-NIC) can be depicted as:
3. Experiment setup
In order to validate the effectiveness of proposed method, there are two gearbox RTF data sets can be used. One was operated under relative stationary conditions. The other was operated under non-stationary conditions. These data sets were collected in the full life gearbox degradation processes. Vibration signals collected at each inspection point is relative stationary. This means the speed and load of gearbox will not vary in a very short time. For experiment 1, the speed and load had a very small fluctuation around a certain value in the whole degradation process. However, for experiment 2, the speed and load were varying with a great degree.
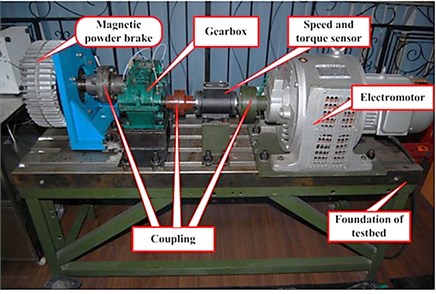
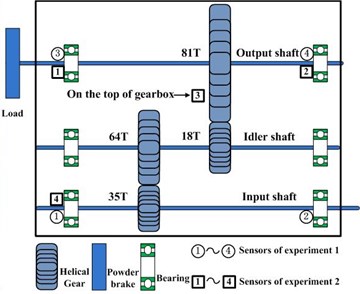
Fig. 2a) Test-rig of gearbox, b) Gearbox structure and sensor location
a)
b)
The experiment system used in this paper can be shown in Fig. 2(a). This system contains a gearbox, a 4 kW three phase asynchronous motor for driving the gearbox, and a magnetic powder brake for loading. The motor is an electromagnetic speed-adjustable motor which allows the tested gear to operate under various speeds. As depicted in Fig. 2(b), the gearbox has three shafts, which are mounted to the gearbox housing by rolling element bearings. Gear on low speed (LS) shaft has 81 teeth and meshes with gear on the right intermediate speed (IS) shaft which has 18 teeth. Gear on left IS shaft has 64 teeth and meshes with gear on the high speed (HS) shaft which has 35 teeth. These teeth information are very important for us to know the mesh frequencies. The data acquisition system contains acceleration transducers, PXI-1031 mainframe, PXI-4472B data acquisition cards, and LabVIEW software. The type of transducers is 3065B4 of Dytran Company. There are four transducers which are mounted in different places on gearbox. In order to acquire the speed and torque information, a speed and torque transducer is installed in the input shaft as depicted in Fig. 2(a). For this transducer, one shaft revolution will produce 60 impulses.
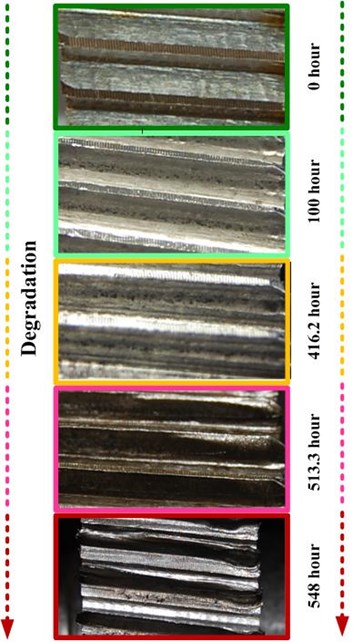
Fig. 3a) Fault propagation over time of experiment 1, b) Fault propagation over time of experiment 2
a)
b)
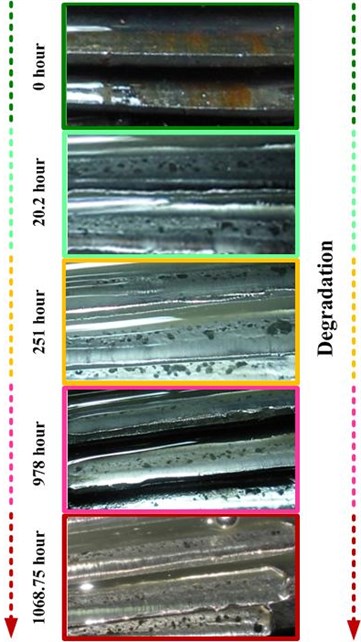
For experiment 1, the transducers’ locations are denoted using circle symbols in Fig. 2(b). The rotation speed of input shaft is about 1,200 rpm and the torque is about 15 Nm. The operation conditions are relative stationary because of the small fluctuation. In this experiment process, the vibration signals were acquired every ten minutes and last 12 seconds. The sampling frequency is 20 KHz. When the experiment system operated 548 hours, the gear of LS shaft had many broken teeth and this experiment was ended. The whole degradation process can be depicted as follows. When a normal gear operates some time, some pitting faults will appear on the gear face. With the time elapse, these pitting faults will extend to the spalling and lead to broken teeth finally. The degradation process of LS shaft gear can be depicted in Fig. 3(a).
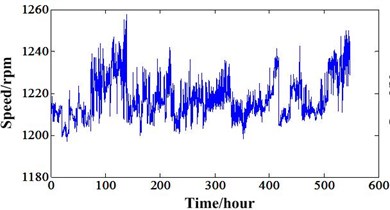
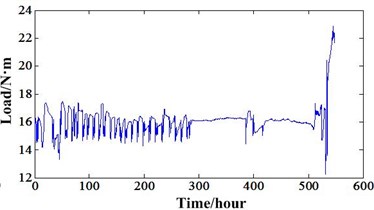
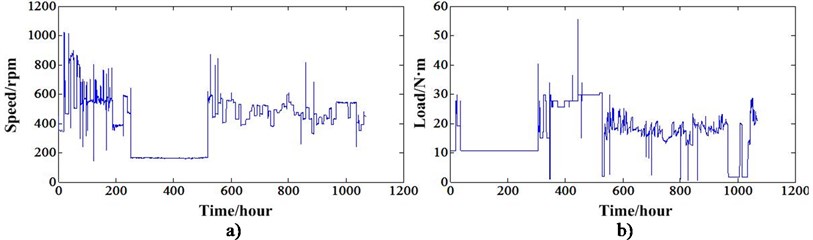
For experiment 2, the transducers’ locations are denoted using square symbols in Fig. 2(b). The rotation speed and torque were controlled to vary with time. The rotation speed was varied in range 200-1200 rpm and the torque was varied in range 0-60 Nm. The operation conditions are non-stationary because of the large fluctuation. The vibration signals were acquired every 5 minutes and last 2 seconds. Similar to the experiment 1, the sampling frequency is 20 KHz. When the experiment system operated 1068.75 hours, the gear of the right IS shaft had severe wear of many teeth and the experiment was ended. The degradation process of this gearbox is very similar to the experiment 1. The degradation process of the IS shaft gear can be depicted in Fig. 3(b).
In order to show the rotation speed and torque variation of these two experiments. They can be calculated through the speed and torque signal acquired in the experiment process. After calculation, they can be depicted in Fig. 4 and Fig. 5.
Fig. 4a) Speed variation of experiment 1, b) Torque variation of experiment 1
a)
b)
Fig. 5a) Speed variation of experiment 2, b) Torque variation of experiment 2
4. Enhanced fault detection based on NIC
Take experiment 1 for example, in order to demonstrate the effectiveness of enhanced fault detection ability based on NIC, the data collected near the failure is selected as the analysis object. This data was collected at time point 3,241 (interval between two inspections is ten minutes). The data of sensor 4 which is near the gear of LS shaft is used. Because the rotation speed has small fluctuation near the 1200 rpm, the signal was resampled using time synchronous technology to remove the variation of rotation speed first. The HS shaft is the synchronous shaft. Then, it is processed by NIC to extract the impulsive signal produced by gear faults while suppressing the narrowband signal produced by no fault components. In this analysis, the parameters and of NIC are selected as 1 and 4096. The FFT spectrum of resampled signal can be seen in Fig. 6(a). After NIC processing, the FFT spectrum can be seen in Fig. 6(b).
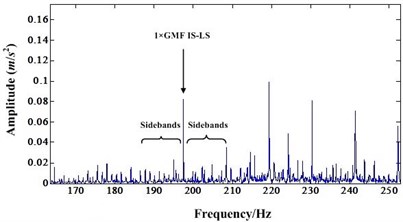
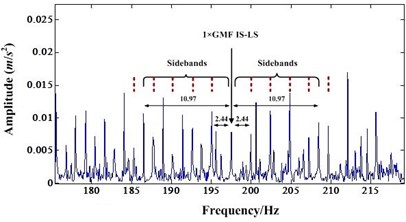
In the Fig. 6, GMF denotes gear mesh frequency. IS-LS denotes the gear mesh of IS shaft and LS shaft. HS-IS denotes the gear mesh of HS shaft and IS shaft. The Fig. 6(b) showed that the narrowband signals which mainly the mesh frequency of HS-IS and its harmonics were suppressed. In order to further validate the proposed method, the detail spectrum of mesh frequency of IS-LS and its harmonics can be illustrated as Figs. 7-9.
Fig. 6a) FFT spectrum of resampled signal, b) FFT spectrum after NIC processing of resampled signal
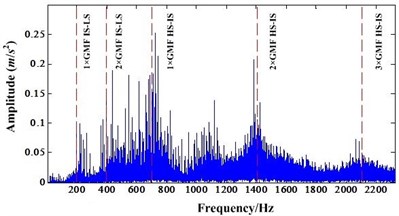
a)
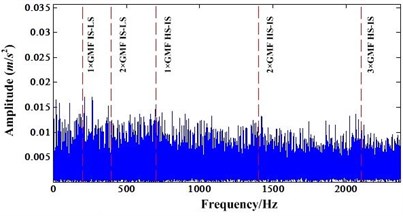
b)
Fig. 7a) Detail spectrum of first order IS-LS GMF before NIC processing, b) Detail spectrum of first order IS-LS GMF after NIC processing
a)
b)
Fig. 8a) Detail spectrum of second order IS-LS GMF before NIC processing, b) Detail spectrum of second order IS-LS GMF after NIC processing
a)
b)
Fig. 9a) Detail spectrum of third order IS-LS GMF before NIC processing; b) Detail spectrum of third order IS-LS GMF after NIC processing
a)
b)
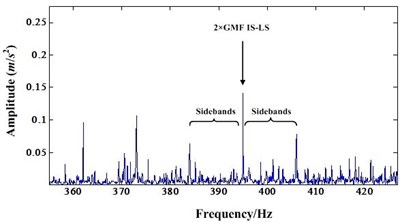
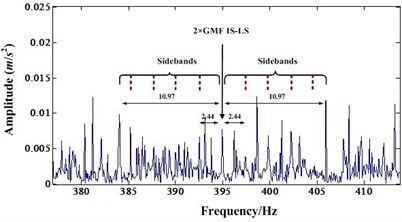
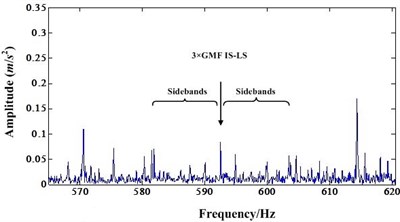
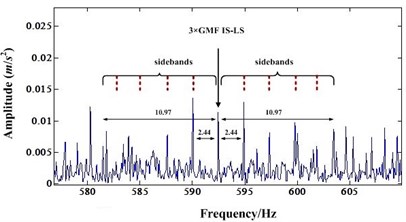
Fig. 7(a) is the spectrum around the mesh frequency with a frequency range from 170 Hz to 250 Hz (the first order mesh frequency of IS-LS is 197.5 Hz). It shows that there is a IS shaft rotation modulation sideband occurring around the mesh frequency component. There is also a first order LS shaft rotation modulation sideband around the mesh frequency component. However, the amplitude of this first order sideband is very small compared to the amplitude of mesh frequency component. Fig. 8(a) and Fig. 9(a) are very similar to Fig. 7(a). In these figures, the sidebands are not dominant.
After NIC processing, the impulse signals are extracted while the narrowband signals are suppressed. Fig. 7(b), Fig. 8(b) and Fig. 9(b) are the detail spectrum after NIC processing. A careful study of these figures indicates that the LS shaft rotation sidebands become dominant. In particular, the mesh frequency components are almost immersed by the sidebands. These Figures shows that some sidebands have higher amplitude than the mesh frequency component. This test indicates that NIC technology can enhance the impulsive signal produced by gear faults which leads to fault detection easier. Therefore, when some incipient faults emerged for the gear, NIC can detect these faults easier than other methods.
5. Degradation analysis based on NIC
Many traditional statistical features developed especially for gear fault diagnosis only can track the gear degradation under relative stationary operating conditions. These features are ER (Energy ratio), FM0, FM4, FM4*, NA4, NB4, M6A and M8A etc [24]. Reference [21] had a detail analysis of part of these features. This paper only shows the results of FM4 and FM4* of the two RTF tests. They can be depicted in Fig. 10 and Fig. 11.
Fig. 10a) FM4 value of experiment 1, b) FM4* value of experiment 1
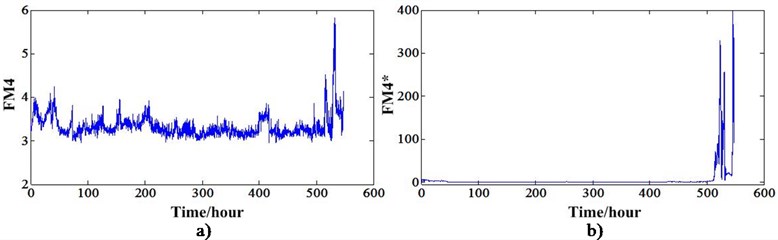
Fig. 11a) FM4 value of experiment 2, b) FM4* value of experiment 2
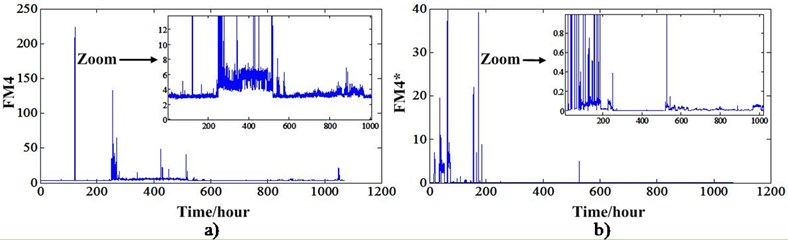
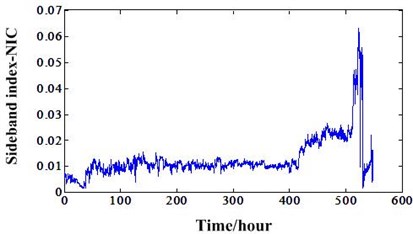
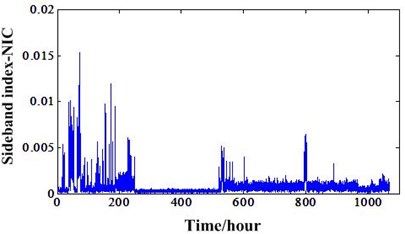
From these two figures, we can see that FM4 and FM4* can track the degradation of experiment 1 but cannot track the degradation of experiment 2. This further demonstrates these two features can only reflect the degradation under stationary conditions. When the operation conditions fluctuate in a great extent, these features also will fluctuate with the varying speed and load. This type features cannot be used to do the RUL prediction. For experiment 1, Fig. 10 shows that the FM4 and FM4* have an increase trend only after the 500 hours. This means even if the RUL prediction methods have a good performance, the RUL is not enough for planning the maintenance actions. In order to overcome this problem, Zhang et al. [22] developed a new sideband index enhanced by the NIC. This indicator has an increase trend at about 400 hours. This means there will have more hours to plan the maintenance actions and lower the risks of breakdown. This new degradation indicator can be depicted in Fig. 12(a). In order to do a comparison with non-stationary conditions indicator, this sideband index also extracted for the experiment 2 as depicted in Fig. 12(b). From this figure, we know this indicator also can work only under the relative stationary conditions. Otherwise, this indicator will have a great fluctuation with the varying conditions. This new sideband index is extracted based on the time synchronous and NIC processing. The HS shaft is the synchronous shaft and data of sensor 4 is used because it outperforms other sensor data.
Fig. 12a) Sideband index based NIC of experiment 1, b) Sideband index based NIC of experiment 2
a)
b)
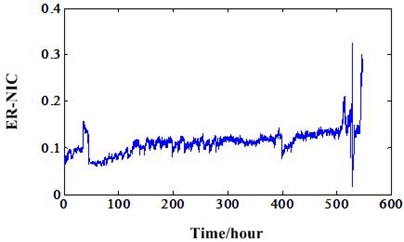
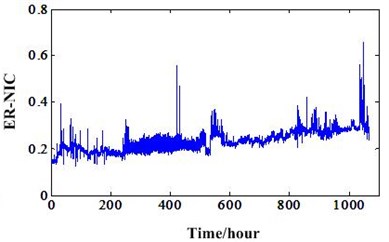
Fig. 13a) ER-NIC value of experiment 1, b) ER-NIC value of experiment 2
a)
b)
Then, the new energy ratio value mentioned in Section 2 should be investigated based on these two different RTF experiments. Many traditional indicators developed for gear fault diagnosis and prognosis need to process the signal using time synchronous averaging (TSA) algorithm. However, for this new energy ratio, it not needs the TSA processing which will make it useless. This new energy ratio values of the two experiments based on NIC can be depicted in Fig. 13. It shows that this new feature can track the gear degradation better than other traditional statistical features under the non-stationary conditions. In addition, we can also compare this indicator with the sideband index value based on NIC of experiment 1. This comparison can be illustrated in Fig. 14. It shows ER-NIC degradation indicator is better than the sideband index value based on NIC. From the overall degradation process view, the ER-NIC indicator has better trend which are suitable for the RUL prediction than sideband index value based on NIC. As shown in ellipse of the figure, the sideband index value is decreased at the end of the gearbox life because of the operation conditions’ influence. However, the ER-NIC has not been influenced by the varying operation conditions and has a good trend. So, we can conclude the ER-NIC can be used as a good degradation feature for RUL prediction regardless of the operation conditions. Fig. 15 is the energy ratio based on AR (ER-AR) model. Compared to the Fig. 13(b), we can see ER-NIC has a good performance than ER-AR. Features FM4, FM4*, ER-NIC of experiment 1 was extracted from the data of sensor 2. For experiment 2, these features and ER-AR were extracted from the data of sensor 1. Because the energy ratios extracted from these sensors are the best. So, in order to keep consistence, others features were extracted from the data of same sensors.
Fig. 14Comparison of ER-NIC and Sideband index based NIC
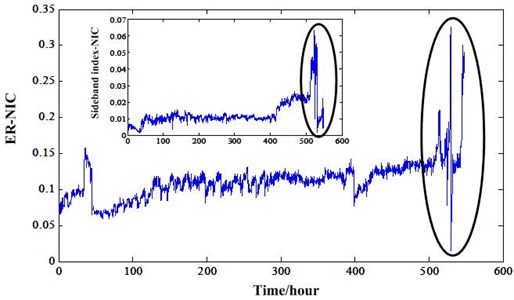
Fig. 15AR model based energy ratio of experiment 2
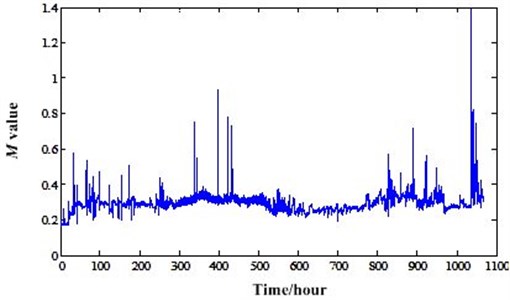
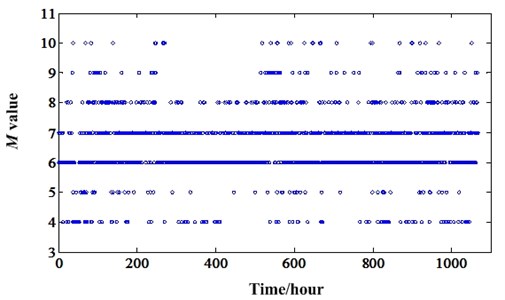
There are two parameters in NIC calculation. They are and which can be found in Section 2. Different parameters will lead to different results and effectiveness. So, we need to optimize these parameters enabling the NIC has better perfoemance. Usually, the value of is one according to the experience which will be a least square linear predictor. The value of is always the power of two such as 16, 32, 64 etc. So, we only need to optimize the value of in this paper. We consider NIC has a better performane when the residual siganl has a high Kurtosis value. So, we can use Kurtosis value as an indicator to optimize the value of . For the overall degradation process of long RTF experiments, the values of in different inspection points will be different. So, we need to give a value which can make most of the residual signals of inspection points more impulsive. The optimum values of whole degradation processes of the two experiments can be calculated and illustrated in Fig. 16 and Fig. 17. It shows that the optimum values of should be 25 and 26 for the two experiments. In the optimization process, we only set the value in a power range [4, 10], because too big value will lead to the computer out of memory.
Fig. 16Optimum M value variation of degradation process of experiment 1
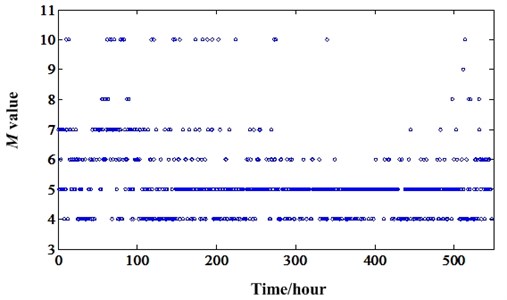
Fig. 17Optimum M value variation of degradation process of experiment 2
6. Discussion and future work
From the above data analysis based on NIC presented in Section 4 and 5, we can conclude the NIC can be used to do the incipient fault detection and can extract robust feature for RUL prediction no matter what operation conditions the gearbox faces. However, there are some issues which need to be discussed and do deep research in future work.
1) In the process of ER-NIC feature extraction, it stated the ER-NIC extracted from the time synchrounous signals will do not work. However, the ER-NIC extracted directly from the original signals can have a good degradation trend under varying operating conditions. The reason of this phenomenon shoud be further investigated in future.
2) Except the AR and NIC methods, we need to develop other methods which can separate the deterministic signal from the residual signal. Then, many reliable degradation features can be extracted to facilitate the RUL predictions.
3) For gearbox, if only exist gear faults or bearing faults, the degradation process can be tracked using the proposed method. However, this case only exist in the laboratory. Bearing and gear faults usually exsit at the same time. In most cases, the gear faults can be detect easier than bearing faults. So, how to track the bearing degradation using proposed method when both bearing and gear faults exist need to be researched deeply in future.
4) The ER-NIC can as a good degradation feature mainly because it is not influenced by the varying oprerating conditions. In engineering real, varying operating conditions are a very ordinary phenomenon. So, the NIC can enhance the fault detection ability and can extract a good degradation feature has two reasons. One is it can filter out the fault unrelated signals out. So, the signals produced by faults are enhanced. The other is it indeed separate the vibration signals to two parts (fault signals and non-fault signals). The energies of these two parts of signals always vary with the speed and load. However, the energy ratio of these two parts can remove the condition variation effect. Therefore, it is robust to do degradation analysis under non-stationary conditions.
5) Sometimes, real equipments have complex structures than gearbox experiment system used in this paper. Take vehicles for example, they always have gearbox, engine, and other necessary transimission components. All these components will have great vibrations when it operates. Especially for the gearbox used in vehicle, it has many gears, shafts and bearings. It contains parallel transimission and planetary transimissions. In the condition monitoring work, there will be big noise which will has a bad influence to proposed method in this paper. So, we can set more sensors on the gearbox which can alleviate the energy lost because of the long transimission path. Shorter path between the fault and the sensor will lead to better performance of proposed method.
7. Conclusions
In this paper, a new incipient fault detection and degradation feature extraction method under varying operating conditions has been developed. This is an adaptive signal processing method called narrowband interference cancellation. It can filter the narrowband signals out which are mainly the vibration signals of normal gear mesh and shaft rotation. Then, the residual signals are mainly the periodic impulsive signals induced by the gear or bearing faults. This process indeed enhances the fault detection. So, usually when the gearbox has some incipient faults, this method will work well to detect the faults than other methods. In order to address the degradation feature extraction dilemma under non-stationary operating conditions, the energy ratio of deterministic and residual part signals which are separated by NIC is developed. Before extract the degradation feature, the parameter of NIC is optimized according to the Kurtosis criterion. The proposed methods are verified using two RTF gearbox experiments. At the end, some works which need to be researched deeply in future has been discussed.
References
-
Jardine A. K. S., Lin D., Banjevic D. A review on machinery diagnostics and prognostics implementing condition-based maintenance. Mechanical Systems and Signal Processing, Vol. 20, Issue 7, 2006, p. 1483-1510.
-
Wang Z. S., Jiang H. K. Robust incipient fault identification of aircraft engine rotor based on wavelet and fraction. Aerospace Science and Technology, Vol. 14, Issue 4, 2010, p. 221-224.
-
Sun H. L., Zi Y. Y., He Z. J. Wind turbine fault detection using multiwavelet denoising with the data-driven block threshold. Applied Acoustics, Vol. 77, 2014, p. 122-129.
-
Yan J. H., Lu L. Improved Hilbert-Huang transform based weak signal detection methodology and its application on incipient fault diagnosis and ECG signal analysis. Signal Processing, Vol. 98, 2014, p. 74-87.
-
Abad M. R. A. A., Ahmadi H., Moosavian A., Khazaee M., Kohan M. R., Mohammadi M. Discrete wavelet transform and artificial neural network for gearbox fault detection based on acoustic signals. Journal of Vibroengineering, Vol. 15, Issue 1, 2013, p. 459-463.
-
Wang W., Wong A. K. Autoregressive model-based gear fault diagnosis. ASME Transactions, Journal of Vibration and Acoustics, Vol. 124, Issue 2, 2002, p. 172-179.
-
Endo H., Randall R. B. Enhancement of autoregressive model based gear tooth fault detection technique by the use of minimum entropy deconvolution filter. Mechanical Systems and Signal Processing, Vol. 21, Issue 2, 2007, p. 906-919.
-
Zhan Y., Makis V. A robust diagnostic model for gearboxes subject to vibration monitoring. Journal of Sound and Vibration, Vol. 290, Issue 3-5, 2006, p. 928-955.
-
Liu B., Makis V. Gearbox failure diagnosis based on vector autoregressive modelling of vibration data and dynamic principal component analysis. IMA Journal of Management Mathematics, Vol. 19, Issue 1, 2008, p. 39-50.
-
Yang M., Makis V. ARX model-based gearbox fault detection and localization under varying load conditions. Journal of Sound and Vibration, Vol. 329, Issue 24, 2010, p. 5209-5221.
-
McDonald G. L., Zhao Q., Zuo M. J. Maximum correlated Kurtosis deconvolution and application on gear tooth chip fault detection. Mechanical Systems and Signal Processing, Vol. 33, 2012, p. 237-255.
-
Bechhoefer E., Li R. Y., He D. Quantification of condition indicator performance on a split torque gearbox. Journal of Intelligent Manufacturing, Vol. 23, Issue 2, 2012, p. 213-220.
-
Si X. S., Wang W. B., Chen M. Y., Hu C. H., Zhou D. H. A degradation path-dependent approach for remaining useful life estimation with an exact and closed-form solution. European Journal of Operational Research, Vol. 226, Issue 1, 2013, p. 53-66.
-
Tran V. T., Pham H. T., Yang B. S., Nguyen T. T. Machine performance degradation assessment and remaining useful life prediction using proportional hazard model and support vector machine. Mechanical Systems and Signal Processing, Vol. 32, 2012, p. 320-330.
-
Wei M. H., Chen M. Y., Zhou D. H. Multi-Sensor information based remaining useful life prediction with anticipated performance. IEEE Transactions on Reliability, Vol. 62, Issue 1, 2013, p. 183-198.
-
Gašperin M., Juricic D., Boškoski P. Prediction of the remaining useful life: An integrated framework for model estimation and failure prognostics. IEEE Conference on Prognostics and Health Management, Denver, USA, 2012.
-
Qiu H., Lee J., Lin J., Yu G. Wavelet filter-based weak signature detection method and its application on rolling element bearing prognostics. Journal of Sound and Vibration, Vol. 289, Issue 4-5, 2006, p. 1066-1090.
-
Jiang K. S., Xu G. H., Liang L., Zhao G. Q., Tao T. F. A quantitative diagnosis method for rolling element bearing using signal complexity and morphology filtering. Journal of Vibroengineering, Vol. 14, Issue 4, 2012, p. 1862-1875.
-
Dempsey P. J., Zakrajsek J. J. Minimizing load effects on NA4 gear vibration diagnostic parameter. NASA technique report, NASA/TM-2001-210671, 2001.
-
Li R. Y., Sopon P., He D. Fault features extraction for bearing prognostics. Journal of Intelligent Manufacturing, Vol. 23, Issue 2, 2012, p. 313-321.
-
Zhang X. H., Kang J. S., Zhao J. S., Cao D. C. Features for fault diagnosis and prognosis of gearbox. Chemical Engineering Transactions, Vol. 33, 2013, p. 1027-1032.
-
Zhang X. H., Kang J. S., Bechhoefer E., Zhao J. M. A new feature extraction method for gear fault diagnosis and prognosis. Maintenance and Reliability, Vol. 16, Issue 2, 2014, p. 295-300.
-
Manolakis D., Ingle V., Kogon S. Statistical and adaptive signal processing. New York, NY, McGraw-Hill, 2005.
-
Samuel P. D., Prines D. J. A review of vibration-based techniques for helicopter transmission diagnostics. Journal of Sound and Vibration, Vol. 282, Issue 1-2, 2005, p. 475-508.
About this article

The authors would like to thank anonymous referees for their remarkable comments and great support by Key Project supported by National Science Foundation of China (51035008).
