Abstract
According to application characteristics of the multi-rope friction hoisting catenaries, a linear transverse parametric vibration model of axially moving string was setup with fixed length and inhomogeneous boundary conditions. The Galerkin method was applied to discretize the dynamic governing equations. Using the Newmark method, the coupling coefficient second-order ODEs were solved. The parametric resonance vibrations of catenaries generated by tension variation along with forced boundary excitations were diagnosed with analytical and experimental validations. The transverse vibration amplitudes and frequencies of catenaries measured and analyzed by non-contact video gauge method were consistent with simulation outputs. The simulation outputs were based on practically measured parameters such as boundary displacement excitations and tension variations. The research results indicated that tension imbalance distributions of the catenaries could change their natural frequencies and result in transverse resonance under boundary harmonic displacement excitations. Therefore specific measures should be provided to maintain tension balance in multi-rope hoisting applications.
1. Introduction
Cables are widely used in various vertical hoisting installations such as mine winders, elevators and cranes. Using multiple ropes to carry the same hoisting load as a single rope can reduce the size of the power transmission system, whereas tension imbalances of various ropes could aggravate the friction of drum groove and dramatically reduce the service life of the ropes and drum grooves. To solve this problem, multi-rope elevators use combination springs to compensate rope length variation with one end attached to the car and the other end attached to the ropes. For mine winders, more complicated equipment such as a tension equilibrator is used to minimize the tension imbalances.
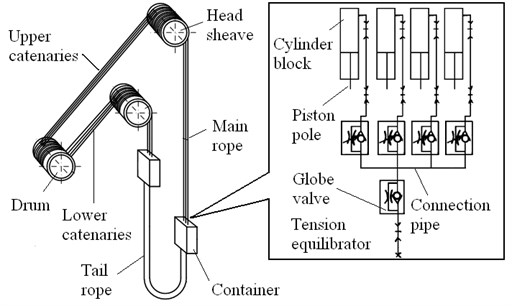
The tension equilibrator made of a combination of hydro-cylinders is installed between the hoisting ropes and container [1], whose location and function principle are shown in Fig. 1. The main ropes are attached to the piston poles with the container attached to the cylinder blocks. Under the condition that one rope’s tension is higher than the others, the higher pressure generated in its hydro-cylinder will squeeze the hydraulic fluid into the other cylinders through the connection pipes and extend the attached rope’s load bearing length to reduce its tension. When the hydraulic fluid stops flowing, the tension of various ropes reaches a new theoretical balance. In reality the ropes tensions could not be totally equal to each other. Sometimes the imbalanced working condition deteriorates when the piston pole reaches the top or bottom limit position of the cylinder blocks in industrial applications due to the lack of inspection and maintenance.
Fig. 1 shows that the steel rope spanning from the flange of the drum to the head sheave. This is referred to as catenary. Excessive transverse vibration of catenary could make two adjacent ropes collide with each other or throw the rope out of its friction groove resulting in hoisting disasters. The paper’s research was based on a severe rope collision case, and studied the dynamic modeling, numerical simulation, experimental validation, and fault diagnosis methodologies of transverse resonance vibration of axially moving catenaries.
Fig. 1Schematic diagram of multi-rope friction winder
2. Transverse vibration model of axially moving catenary
Transverse vibrations of ropes have been studied with a long history and still are challenging subjects due to the applications in various industrial areas. Many researchers have studied the horizontal vibration of elevators [2-5]. Y. Terumichi [2] examined the non-stationary vibration of a time-varying length of rope with a mass-spring container system excited by end horizontal displacement, where resonances resulted from the relation between axial velocity and mass-spring system natural frequencies. By including the bending stiffness in stationary and non-stationary cables models, Zhu [3] analyzed the dynamic stability of traveling equipments with different boundary conditions. Considering the non-linear kinematics of cable deformation, Bao [4] and Zhang [5] investigated the forced coupled longitudinal-transverse vibrations and the energy of time-varying length cable hoisting system based on Hamilton’s principle. The stability of axially moving media parametrically excited by the factors such as tension and speed fluctuations were studied based on the linear parametric model [6-10]. Chen [9] also developed a numerical method to simulate the vibration response. Guilhem [10] presented experiments and analytical validation of the stability problem.
Due to its super-length and super-weight characteristics compared to elevator cables, mine cables were usually modeled as a continuum medium with arbitrarily varying length. Based on the numerical non-linear and non-stationary coupled dynamic model, Kaczmarczyka [11] studied the coupled lateral-longitudinal dynamic response of deep mine cables with external, parametric and auto-parametric resonance features. Gong [12] examined the transverse resonance of catenaries based on static tensions and forced sinusoidal boundary excitations. In fact the transverse vibrations of axially moving catenaries are subjected to boundary harmonic excitations and tension variation excitations, which could be caused by malfunctions of the winding drum, head sheaves or tension equilibrator. In this study the catenaries are investigated as an axially moving string, so its torsional vibrations are ignored. Likewise the nonlinear deformation of catenaries and aerodynamic resistance are also ignored.
2.1. Transverse vibration model of catenary
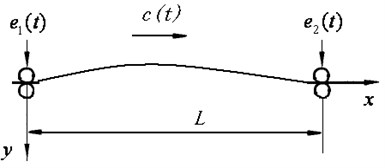
We consider that the gravity difference of catenary can be neglected compared to its large tension. The inclined catenary shown in Fig. 1 can be modeled as a horizontal axially moving string in Fig. 2.
In this diagram represents the length of the string. , are the line density and the axial moving speed. is the transverse displacement of the string at position at time . , are the axial deflection displacements of the drum or head sheave grooves along the axis.
Fig. 2Axially moving string model with boundary excitations
The transverse vibration of catenary in the plane is governed by:
where is the string tension at time . Under the condition of imbalanced tensions, the imbalance coefficient is introduced to take that fact into account. is the number of the catenaries. and are the tension of catenary and the mean balanced tension of all catenaries. The and are given by Eq. (2) and Eq. (3):
where is the whole equivalent mass of the hoisting equipments along the catenary side [1]. is the equivalent mass of the head sheave. denotes the number of the main ropes. is the gravitational acceleration. The whole equivalent mass is given by:
where is the line density and is the number of the tail ropes. is the hoisting height. denotes the time-varying length of main ropes during hoisting process., and are the masses of the hoisting load, the container and the attached parts respectively. The attached parts include the tension equilibrator.
2.2. Boundary harmonic excitations
As shown in Fig. 1 and Fig. 2, the axial deflection displacements of the winder drum or the head sheave grooves generates the transverse displacement excitations to both ends of moving catenary. These inhomogeneous boundary excitations are given by Eq. (5):
where , are the deflection displacements and can be simulated and give by:
where is the axial speed and is the rotation radius of the drum or the head sheave grooves. The dependent -order displacement amplitudes , and phases , are subjected to equipment faults or deformations.
The vibration function with inhomogeneous boundary conditions can be further decomposed by Eq. (7):
refers to the function with homogeneous boundary conditions given by:
is the function with inhomogeneous boundary conditions given by:
The excitations are transferred from the boundary to the domain without losing the generality by Eq. (10):
2.3. Vibration equations solution
Galerkin’s method is used to discretize the governing partial differential Eq. (1). The assumed form of the displacement response of the moving string homogeneous function is:
where is the number of included modes. are the generalized coordinates relevant to time . are the trial functions and defined by Eq. (12):
Substituting Eq. (6), Eq. (7), Eq. (11) and Eq. (12) into Eq. (1), then multiplying the equation by 1, 2,…,, integrating it from to , and using the boundary condition yields the discretized equations as:
where is the vector of generalized coordinates. The mass, stiffness, damping and force matrices are:
where is the Kronecker delta. Damping and stiffness matrices , in the discretized equation Eq. (13) are subjected to axial velocity of catenaries, where the generalized force matrix is decided by axial velocity , and deflection displacements of the winder drum and head sheaves grooves , .
Eq. (13) is the coupling coefficient second order ordinary differential equations. The numerical method to solve it is to discretize the movement cycle into time internals, where during each time internal the matrices in Eq. (13) remain constant. The Newmark-beta method was applied into the numerically evaluation of the Eq. (13), with 0.25.
3. Catenaries vibrations test and simulation
The vibration displacements of catenaries need to be measured and analyzed to investigate the vibration characteristics both in the time domain and in the frequency domain.
3.1. Transverse vibrations displacements test of catenaries
The non-contact video gauge system was used to measure the transverse vibrations displacements of catenaries. The processed images were shown in Fig. 3. The left part of the figure indicates the catenaries’ distribution with marked numbers 1# to 4# and the measurement plane with grids. The right part shows two frames of measured videos.
Fig. 3Non-contact video gauge processed images
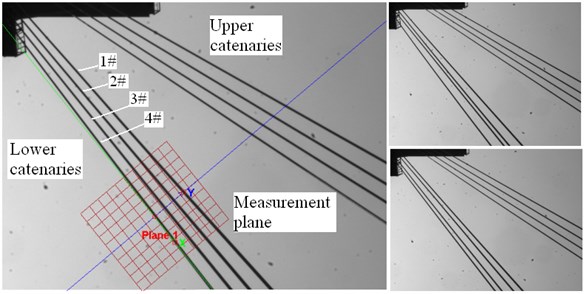
The plane appearing as a red grid overlaid in the image in Fig. 3 is the coordinates frame to define the measuring scale of vibration displacements. The -axis points to the longitudinal direction of catenaries while axis points to the lateral. The scaling factor to the pixel measurements is calculated by two points over a known distance from 1# to 4# catenary in the image, which appears from origin of plane to the point with “o” mark along the axis. With these coordinates for the geometry measurement, the catenaries transverse vibration displacements were recorded and analyzed.
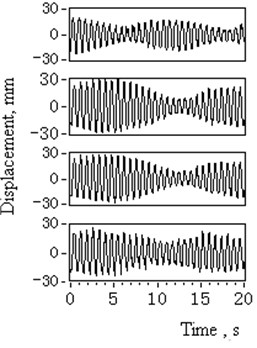
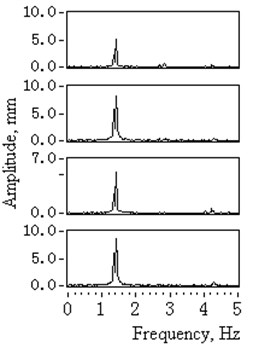
The vibration displacements of four lower catenaries with were shown in Fig. 4 and the statistic results were listed in Table 1. Fig. 4(a) shows the measured 42 seconds time domain curves numbered by 1# to 4# with constant high hoisting speed. Fig. 4(b) shows the corresponding zoomed amplitude spectrum with the 0.024 Hz frequency resolution.
The vibration spectrum of 2#, 3# and 4# catenaries under empty container circumstances had the same characteristic of resonance. The main frequency ranged from 1.35 Hz to 1.38 Hz and was close to the 1.34 Hz, which is the 2nd harmonic of the winder drum and head sheaves rotation frequency. The spectrum of 1# catenary had main frequencies such as 1.43 Hz, 1.35 Hz and 2.85 Hz without any characteristic of resonance.
The displacement amplitudes of 1# to 4# catenaries under a fully loaded container circumstance were normal and significantly less than those under empty container circumstances. The amplitude spectrum shows the main vibration frequencies varying from 1.62 Hz to1.64 Hz. Under the fully loaded container circumstances, all four catenaries' vibrations showed no characteristic of resonance.
According to Eqs. (14)-(16), all four catenaries shared the same parameters and should have had the same natural frequencies. The measured vibration displacements had different amplitudes and frequencies. The accountable parameters leading to these conditions could be attributed to excitation amplitudes , phases , and imbalance catenaries tension . Further tests need to be conducted on the axial vibration displacements of the winder drum and head sheaves grooves, along with the tension.
Fig. 4Time domain and spectrum diagram of lower catenaries transverse vibrations (1# to 4#)
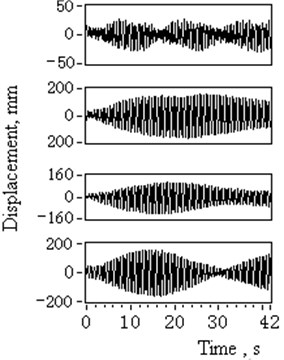
a) Time domain signal
b) Amplitude spectrum
Table 1Statistical results of catenaries vibration displacement measurements
Container condition | Catenary number | Measured maximum amplitudes (mm) | Measured main frequencies (Hz) |
Empty | 1# | 20 | 1.35, 1.43,2.85 |
2# | 157 | 1.35 | |
3# | 105 | 1.37 | |
4# | 149 | 1.38 | |
Fully loaded | 1# | 24 | 1.62,1.35 |
2# | 20 | 1.64,1.35 | |
3# | 29 | 1.64,1.35 | |
4# | 40 | 1.64,1.35 |
3.2. Deflection displacements test of the winder drum and head sheaves
Fig. 1 shows that each catenary has the same numbered separate head sheave, so the axial groove deflection displacement was measured through the steel outer ring of the head sheave indicated in Fig. 5.
A bearing rod bolstered the CCD laser displacement sensor facing the outer ring. The catenaries shared the same drum so they had the same axial vibration displacement of the drum grooves. The statistical measurement results obtained are listed in Table 2. The measured time domain displacement and its amplitude spectrum of 3# head sheave are illustrated in Fig. 6. The rotation frequency of the head sheaves is 0.67 Hz.
Table 2Statistical results of head sheave and drum axial deflection displacement, where the rotation frequency is 0.67 Hz and 2nd harmonic frequency is 1.34 Hz
Excitation | Catenary number | Displacement amplitude (mm) | Condition | Amplitude of 2nd harmonic frequency (mm) |
Head sheave | 1# | 1.9 | Regular | 0.92 |
2# | 4.1 | Over-limit | 2.51 | |
3# | 5.85 | Over-limit | 3.5 | |
4# | 7,75 | Over-limit | 4.53 | |
Drum | 1# to 4# | 0.5 | Regular | 0.18 |
Fig. 5Measurement schematic of head sheaves axial deflection displacement
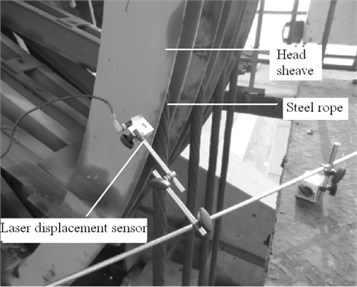
Fig. 6Deflection displacement and amplitude spectrum of 3# head sheave
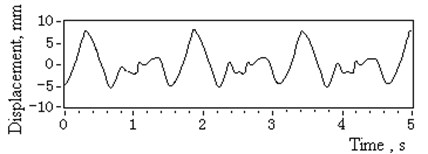
a) Time domain signal
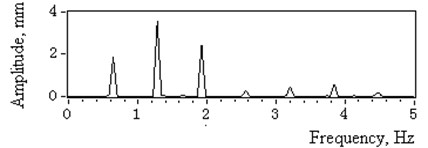
b) Amplitude spectrum
See Table 2. Note that the deflection displacement amplitudes of 1# head sheave and the drum are within the normal range, while the others exceed the 2 mm limit and could be identified as a faulty condition. The amplitude of harmonic frequency 1.34 Hz referred as or in Eq. (6) was listed as the main boundary excitation of catenaries.
3.3. Catenaries tension test
The tension imbalance condition can be derived from the measurement of oil pressure of tension equilibrator. Fig. 7 presents the pressure-time cures of the container downward movements from shaft top to shaft bottom. The thick solid line represents measured tensions of certain catenaries, while the thin dot line represents the normal cure of mean balanced tension recorded before and validated by analytical calculation.
Fig. 7Oil pressure of tension equilibrator under the empty container circumstance
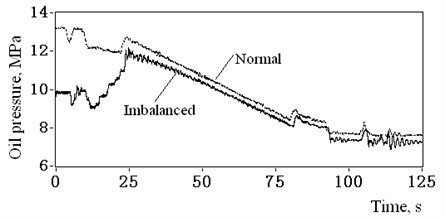
It could be concluded through the comparison of the two cures that the measured data indicated a serious imbalanced tension problem. Some catenary tensions are far too low to average balanced tension with the relative ratio varying from 75 % to 92 %, whereas the others were greater than the .
The tension measurement of each catenary could not be conducted due to practical technical problems. Observations indicated that the piston pole of 1# hydro-cylinder reached the top limit position of cylinder blocks, and, therefore, it had the greater tension. It was clear that the difference in catenaries’ tensions was induced by the malfunction of the tension equilibrator, while the relation of tension variation and vibration resonance still needs to be studied in this case.
4. Vibration simulation and fault diagnosis
4.1. Transverse vibrations displacements simulation
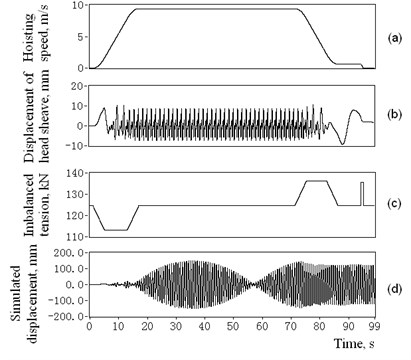
In order to validate the dynamic model of catenaries transverse vibrations in Eq. (1) and to determine the major factor leading to parametric vibration, the practical test data collected in Section 3.2 and Section 3.3 were synthesized into the simulation cures plotted in Fig. 8(a)-(c), which are the hoisting speed , the deflection displacements of 4# head sheave groove, imbalanced tension of 4# catenary with imbalance coefficient 0.9 under the circumstance of empty container. The other parameters required in the simulation are provided in Table 3.
Table 3Technical parameters of the hoist system
Parameters | Implication | Value | Unit |
Hoisting height | 670 | m | |
Radius of head sheaves and drum | 2.25 | m | |
Length of catenaries | 43.74 | m | |
Equivalent mass of head sheave | 7.25e3 | kg | |
Mass of hoisting load | 1.92e4 | kg | |
Container mass | 2.48e4 | kg | |
Attached parts masses | 6.96e3 | kg | |
Number of main ropes | 4 | – | |
Number of tail ropes | 3 | – | |
Main rope line density | 7.86 | kg/m | |
Tail rope line density | 10.45 | kg/m |
The 4# catenary displacement-time simulation response with and the included mode number 16 was shown in Fig. 8(d), which shows a characteristic of resonance with its main frequency as 1.37 Hz. Taking the deflection displacements measured results into account and assuming the tension imbalance coefficients of catenaries 1# to 4# are 1.31, 0.89, 0.91, 0.90, the maximum simulation vibration amplitudes of 1# to 4# catenaries at are 17.5 mm, 155 mm, 102 mm and 147 mm. These amplitudes are close to the measured data in Table 1 and are characterized primarily by the same amplitude spectrum. The simulation validates the applicability and reliability of the model in Eq. (11), along with its numerical method.
Fig. 8Simulation of the excitation signals and the response vibration displacements of 4# catenary
4.2. Fault diagnosis
The simulation results in Section 4.1 showed that the transverse displacements of catenaries had different maximum amplitudes with different tension imbalance coefficients. They were constrained by the boundary excitation results from deflection displacements of the head sheaves and drum grooves. The effects of tension and boundary excitation on large vibrations need to be investigated to identify the fault sources.
4.2.1. Tension variation and vibration simulation
Due to the dynamic tension variation of certain catenary, the imbalance coefficient can vary within a given range. Take 4# catenary as the example to illustrate the effect of different imbalance coefficients on its vibration amplitudes. When varies from 0.8 to 1.2, with its boundary excitation of deflection displacements shown in Fig. 8, the 3D surface graph of catenaries vibration amplitudes of descending movement under empty load condition is presented in Fig. 9(a). Also the transverse natural frequencies of 4# catenary during constant speed period are presented in Fig. 9(b), where the dotted lines indicate the 1st to 5th boundary harmonic excitation frequencies. The solid lines indicate the first two natural frequencies of 4# catenary.
Note that when 0.86, the first two natural frequencies 1.334 Hz and 2.668 Hz coincide to the 2nd and 4th boundary harmonic excitation frequencies, which eventually leads to the vibration resonance of 4# catenary.
With the same simulation method, the maximum vibration amplitudes of 1# to 4# catenaries are shown in Fig. 10, which are based on the boundary deflection displacements in Table 2 with imbalance coefficient varying from 0.84 to 1.14.
When 0.895, the maximum simulated vibration amplitude of 3# and 4# catenaries are 165 mm and 201 mm. The sum is 366 mm and larger than the 350 mm design distance between 3# and 4# catenaries, subsequently, the 3# and 4# catenaries could collide with each other just as it happened in reality. When the tension equilibrator functions normally and 1, even with the largest boundary excitation displacement, the maximum displacements of 4# catenary is 53.6 mm and remains within the safe range of vibration.
Fig. 94# catenary vibration amplitudes and natural frequencies with varying imbalance coefficient
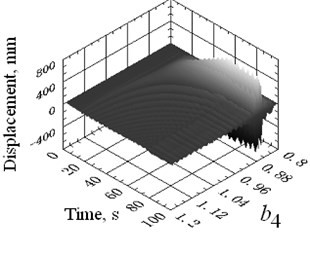
a) 3D surface graph of displacement
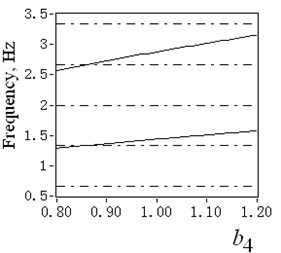
b) Transverse natural frequencies
Fig. 10Maximum displacement amplitudes of 1# to 4# catenaries with varying imbalance coefficient
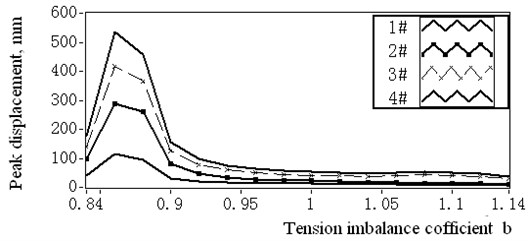
When varies from 0.895 to 1, the first natural frequency of 4# catenary changes from 1.36 Hz to 1.47 Hz and goes away from the boundary harmonic excitation frequency 1.34 Hz. Also the maximum simulated vibration amplitude decreases magnificently from 201 mm to 53.6 mm. It can be interpreted that the tension variation excitation played a vital role to change the resonance status and reduce the vibration displacement.
4.2.2. Boundary displacement excitation analysis
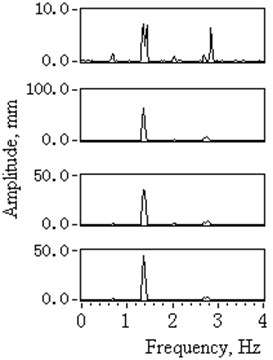
Based on the same boundary excitation displacements from Table 2, the simulated and measured vibration amplitudes from Table 1 and Fig. 10 are listed below in Table 4.
Table 4Simulated and measured vibration amplitudes with same boundary excitation displacements and under tension imbalanced circumstance
Catenary number | Deflection displacement amplitude of head sheave (mm) | Measured maximum amplitude with tension imbalanced (mm) | Measured main frequencies with tension imbalanced (Hz) | Simulated maximum amplitude with tension imbalanced (mm) |
1# | 1.9 | 20 | 1.35, 1.43, 2.85 | 12.6 |
2# | 4.1 | 157 | 1.35 | 23 |
3# | 5.85 | 105 | 1.37 | 41.9 |
4# | 7,75 | 149 | 1.38 | 53.6 |
When the tensions of each catenary fluctuate due to tension imbalance, the vibration displacements of catenaries are subjected more to tension variation than the deflection displacements of the head sheaves. For example, even the deflection displacement ratio of 4# catenary to 2# catenary is 1.9, while the maximum vibration amplitudes ratio of that is 0.95, because the natural frequency of 2# catenary is closer to boundary harmonic frequency than the 4# catenary under imbalanced circumstance. It can be inferred from this comparison that boundary displacement excitation is a minor factor to change the resonance status of catenary vibration.
The measured amplitudes of each catenary are larger than the simulated ones, while their variation tendency is coherent, which shows the effectiveness of the simulation. The difference could result from model errors, which are acceptable when the primary aim is the fault diagnosis.
4.2.3. Fault diagnosis and experimental validation
Considering the above analysis, it is reasonable to assume that the major factor leading to the catenaries' large parametric transverse vibration could be tension variation excitations. In this sense, the malfunction of the tension equilibrator generates tension variation of the four catenaries, and changes its natural frequencies to coincide to boundary harmonic excitation frequencies, which eventually leads to transverse resonance vibration. In order to reduce the vibration amplitude, the tension equilibrator must be repaired even be replaced to maintain the tension balancing status.
After the tension equilibrator was replaced, its oil pressure reflecting the balance condition was measured and proved to be normal. The maximum vibration displacements amplitude of 4 catenaries under the balanced tension circumstance were measured again and listed in Table 5, from 1# to 4# as 22 mm, 35 mm, 51 mm and 67 mm. In order to reduce the transverse vibration amplitude of catenaries to normal level, the head sheave was replaced by a new one to reduce its axial deflection displacement. The vibration displacements of the head shave grooves along with catenary vibration amplitudes were measured again, the time domain and spectrum diagram of catenaries transverse vibrations were shown in Fig. 11. The statistical data were presented in Table 5.
Table 5Measured and simulation results of maximum catenaries vibration amplitudes after the head sheave and the tension equilibrator were replaced
Catenary and head sheave numbers | Measured deflection displacement amplitudes of head sheave (mm) | Simulated maximum amplitudes of catenaries (mm) | Measured maximum amplitudes of catenaries (mm) |
1# | 1.4 | 6.1 | 18 |
2# | 1.8 | 12.2 | 30 |
3# | 1.45 | 10 | 26 |
4# | 1.5 | 10.6 | 25 |
Fig. 11Time domain and spectrum diagram of catenaries transverse vibrations after the head sheave and tension equilibrator was replaced (1# to 4#)
a) Time domain signal
b) Amplitude spectrum
Table 5 and Fig. 11(a) show that even the measured maximum catenary vibration amplitudes differ from that of simulation ones. They have been minimized to normal range. Fig. 11(b) shows that the main vibration frequency has transferred from resonance state frequency 1.34 Hz to its new natural frequency 1.42 Hz. These measured results provide evidence that the resonance vibration of catenaries should be attributed to the severe tension imbalances and boundary displacement excitations, which are caused by the malfunction of the tension equilibrator and the over-limit head sheave groove deflection displacements.
5. Discussion
In general, for the applications of many engineering devices with multi-rope hoisting methods such as mine winders and elevators, the malfunction of certain equipment leading to severe rope tension variation or imbalance could result in the parametric resonance state. Especially when the mine winders have the possibility of parametric resonance, the tension equilibrator should be intensively checked or repaired to maintain tension-balancing status and avoid large catenary vibration.
The linear dynamic model of transverse vibration of an axially moving string used in this case could be applied to small vibration amplitude motion applications without serious errors; it could simplify the process of fault diagnosis when the vibration amplitude difference between practical measured and theoretical simulation were acceptable. On the basis of these findings, it is recommended that during the primary design process of mine hoisting system, the dynamic vibration model put forward by this article could be used to simulate the dynamic vibrations of catenaries and to perfect the design results.
6. Conclusions
Based on the fault diagnosis case of a multi-rope hoisting catenary vibration resonance, this research has studied the parametric transverse vibration of catenaries with dynamic modeling, numerical simulation and experimental validation method. The main conclusions can be summarized as the following lists: (1) A time-varying and tension variation parametric vibration model with boundary harmonic excitations was setup to study the transverse resonance of axial moving catenaries; (2) The tension variation induced by imbalance condition in multi-rope hoisting equipments could change the natural frequencies to coincide to the boundary harmonic excitation frequencies and result in parametric resonance. Also the vibration amplitude could be augmented by the harmonic excitation amplitude induced by boundary equipment deformation; (3) The dynamic model, vibration test and fault diagnosis methodologies of axial moving string put forward by this study have been proven to be applicable to multi-rope mine hoisting dynamics analysis and application research.
References
-
Hong Xiaohua Mine Transporting and Hoisting. Second Edition, China University of Mining and Technology Press, Xuzhou, China, 2005, (in Chinese).
-
Terumichi Y., Ohtsuka M., Yoshizawa M. Nonstationary vibration of a string with time-varying length and a mass–spring system attached at the lower end. Nonlinear Dynamics, Vol. 12, 1997, p. 39-55.
-
Zhu W. D., Xu G. Y. Vibration of elevator cables with small bending stiffness. Journal of Sound and Vibration, Vol. 263, 2003, p. 679-699.
-
Zhang Peng, Zhu Changming, Zhang Liangjuan Analysis of forced coupled longitudinal-transverse vibration of flexible hoisting systems with varying length. Engineering Mechanics, Vol. 25, Issue 12, 2008, p. 202-207, (in Chinese).
-
Bao Jihu, Zhang Peng, Zhu Changming Modeling and analysis of rope transverse vibration for flexible hoisting systems with time-varying length. Journal of Shanghai Jiaotong University, Vol. 46, Issue 3, 2012, p. 341-345, (in Chinese).
-
Mockensturm E. M., Perkins N. C., Galip Ulsoy A. Stability and limit cycles of parametrically excited axially moving string. Journal of Vibration and Acoustics, Vol. 118, Issue 3, 2005, p. 346-351.
-
Parker R. G., Lin Y. Parametric instability of axially moving media subjected to multi-frequency tension and speed fluctuations. Journal of Applied Mechanics, Vol. 68, Issue 1, 2000, p. 49-57.
-
Chen Liqun Analysis and control of transverse vibration of axially moving strings. ASME Applied Mechanics Reviews, Vol. 58, Issue 3, 2005, p. 91-116.
-
Guilhem M., Lionel M., Robert P. Parametric instability of an axially moving belt subjected to multi-frequency excitations: experiments and analytical validation. Journal of Applied Mechanics, Vol. 75, Issue 4, 2008, p. 140-147.
-
Chen Liqun, Zhao Weijia A numerical method for simulating transverse vibrations of an axially moving string. Applied Mathematics and Computation, Vol. 160, Issue 2, 2005, p. 411-422.
-
Kaczmarczyk S., Ostachowicz W. Transient vibration phenomena in deep mine hoisting cables Part1: Mathematical model. Journal of Sound and Vibration, Vol. 262, 2003, p. 219-244.
-
Gong Guofang. Vibration analysis of mine winder catenaries. Mining and Processing Equipment, Vol. 12, 1990, p. 48-50, (in Chinese).
About this article

The authors thank the staff of Yaoqiao Coal Mine of Shanghai Datun Joint Co. Ltd., who assisted in various ways throughout this study. The generous support of the Science Fund of the National Natural Science Foundation of China (No. 60974126) is to be acknowledged. We also extend our thanks to the reviewers of this paper for their helpful comments.
