Abstract
Residual heat removal pumps used in nuclear power plants are activated by an emergency or accident such as an earthquake. Their antiseismic performance is therefore a critical factor. In this study, we used a new method based on computational fluid dynamics and finite element analysis to investigate the seismic response of a residual heat removal pump under a 1/2 SSE seismic load. The fluid-induced vibration was also considered in the simulation to ensure accurate prediction of the antiseismic performance. The deformation of the trailing edge of the impeller at startup was quantitatively analyzed by examining the seismic response and fluid-induced vibration. The expression for the clearance between the impeller and diffuser at startup was obtained by combining the effects of the seismic load and fluid-induced vibration. An analysis of the results showed that the deformation of the trailing edge of the impeller produced a greater safety margin in the pump structure when it is subjected to a seismic load. The fluid-induced vibration had greater effect on seismic response analysis at startup. The expression of the clearance between the impeller and diffuser at startup was obtained as a damped oscillation function that combines an exponential function and a sine function.
1. Introduction
Nuclear power plants are often located near an ocean, which is critical to environmental safety. The failure of the residual heat removal system of the Fukushima nuclear power plant after an earthquake in 2011 caused the leakage of 300 ton of concentrated nuclear radiation water. The leaked water was dispersed over 388 km2 of the adjoining ocean, resulting in the pollution of seafood because some marine animals fed on vegetables and smaller animals that had been exposed to radiation. Human beings would be the ultimate victims if this leads to the entry of a variant DNA into the food chain [1, 2].
Improved development of nuclear power to meet electricity demands and environment requirements is the present consensus of the government and the community [3-5]. A residual heat removal pump is one of the important parts of the first loop of the residual heat removal system of a nuclear power plant. It is a level-2 nuclear pump, which is among the most important nuclear power equipment [6]. The residual heat removal pump is not used during normal operation of a nuclear power plant, and only starts working in the event of an accident such as one caused by an earthquake. It is used to remove the residual heat after normal or accidental shutdown of the reactor to maintain the safety of the nuclear power plant in accordance with antiseismic requirement level I.
Numerical methods for solving the seismic response spectrum have been developed for seismic response analysis over the last decade, and most of the research works have focused on analyzing the deformation or stress under seismic load. Suarez studied the seismic response characteristic of rotating machines under simulated base excitations using different principles regarding the speed-dependent gyroscopic parameters, base-rotation-dependent parameters, and several forcing function parameters [7]. Karasudhi used infinite elements in the far field and finite elements in the near field to analyze seismic response by imposing three concentrated orthogonal forces [8]. Zhou analyzed the seismic response of a nuclear reactor coolant pump under multi-seismic spectra with multi-input angles [9]. Studies on the startup of pumps have mainly focused on the hydraulic performance characteristics. Lefebvre conducted an experimental study on the startup of a centrifugal pump with a high specific speed using three starting accelerations [10]. The results revealed an obvious transient effect at startup. Farhadi developed a unified mathematical model for forecasting the transient performance of a pump at startup [11].
Whereas seismic response analyses have been conducted in the field of civil structures, studies on rotating machines have been rear. Moreover, the rotation of a rotor has not been properly considered in the seismic response analysis of a rotating machine, which is because the rotor is often simplified as a bar. The force that the stationary component transfers to the rotating component has not been adequately considered. There has also been little study on the seismic response analysis of a heat removal pump at startup and the attendant effect of the fluid on the pump structure. Known seismic response analysis methods cannot be used to predict the antiseismic performance at startup taking into consideration the fluid-induced vibration.
It is thus evident that there is very limited published literature on seismic response analysis that focus on the deformation and a detailed consideration of the transient fluid-induced vibration at startup in evaluating the antiseismic performance of residual heat removal pumps. In our study, we undertook a numerical analysis of the displacement at startup using the method of response spectrum and fluid-solid interaction. The seismic load and fluid-induced vibration were both considered. The displacement of the trailing edge of the impeller caused by seismic and fluid-induced vibration was quantitatively analyzed. Experimental data were also collected to verify the accuracy of the simulation.
2. Description of the pump structure
As shown in Fig. 1, the RRA system comprises two residual heat removal pumps, two heat exchangers, valves, and pipes. The residual heat removal pumps RRA 01PO and 02PO direct water into a main pipe. A relief valve is located on the main pipe to avoid overpressure of the RRA system. Water in the main pipe flows into RRA 01RF, RRA 02RF, and the bypass line; the water then converges again. A minimum flow recirculation line leads to the pump inlet, a low-pressure discharge pipeline leads downstream, and the connecting pipeline leads to the reactor cavity and spent fuel pit cooling and treatment system (PTR). A pipeline is connected to the PTR at the inlet of the pump, and there is a returning pipeline downstream of the gasification system. The residual heat removal pump is installed in the containment shell of a nuclear power plant to maintain the pressure characteristics by completing the water-filling and high-pressure water-injection [12-13].
Fig. 1Residual heat removal system
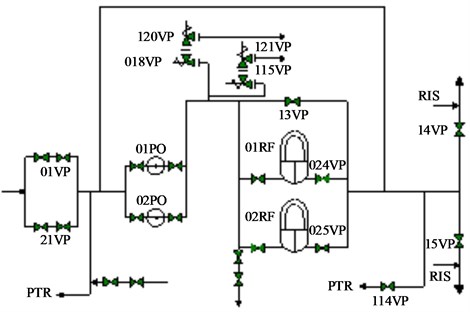
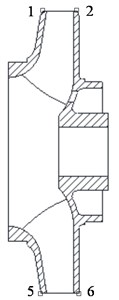
Fig. 2Schematic of the pump structure
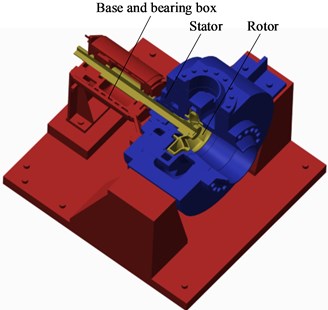
A horizontal centrifugal residual heat removal pump with a diffuser was selected as the simulation model. An overview of the pump structure is shown in Fig. 2. The design parameters of the pump are given in Table 1. The diffuser was designed to produce a more uniform flow, and the annular volute afforded greater structural stability of the pump. The bearing box functioned as a heat shield that isolated the motor from the heat transferred from the fluid in the pump chamber. The material properties of the residual heat removal pump are given in Table 2.
Table 1Parameters of the pump
Parameters | Value |
Flow rate / m3h-1 | 910 |
Delivery head / m | 77 |
Rotation speed / rpm | 1490 |
Suction diameter / mm | 270 |
Impeller outlet diameter / mm | 513 |
Blade width at impeller outlet / mm | 49 |
Table 2Material properties
Component | Stator | Rotor | Base and bearing box |
Material | Z2CND13-04 | Z2CN18-10 | 20MN5M |
Density (kgm-3) | 7690.65 | 7270.06 | 7991.96 |
Young’s modulus (Pa) | 206e9 | 197e9 | 204e9 |
Poisson’s ratio | 0.32 | 0.3 | 0.3 |
3. Experimental verification
To verify the accuracy of the calculation, experimental data were collected for the model pump. In this paper, the fluid-induced vibration at startup due to the fluid-solid interaction was considered using a computational fluid dynamics method. The curve of the performance was obtained by establishing the control equation, determining the calculation domain, choosing a turbulent model, and determining the boundary condition using ANSYS CFX14.5. The accuracy of subsequent calculations of the fluid-induced vibration could be improved by the experimental verification through modifications of the simulation model and the boundary condition. The temperature of the test water was 28°C, the rotation speed was 1490 rpm, and the power rating of the matched motor was 350 kW. Fig. 3 is a comparison of the numerically and experimentally determined delivery head curves for all the operational conditions at the nominal speed. As can be seen, the results of the numerical simulation are in good agreement with those of the experiment. The maximum error between the experimental and calculated values is below 5 %, which confirms the credibility of the calculation.
Fig. 3Head curve of test pump
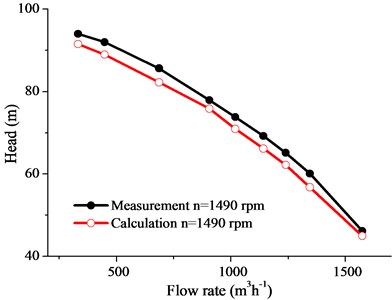
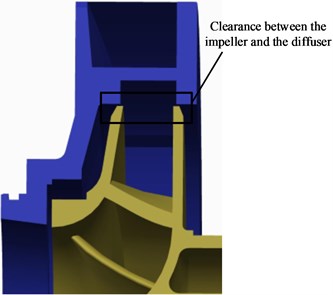
Fig. 4Clearance between the impeller and the diffuser
4. Analysis of the seismic response under extreme conditions
To evaluate the integrity and operability under seismic loading in accordance with the RCC-M 2000 standard, the clearance between the impeller and the diffuser was examined, and the deformation of the trailing edge of the impeller under seismic loading was calculated. The maximum seismic response was calculated based on the input seismic acceleration. The square root of the sum of the squares (SRSS) was obtained, which is applied in the probability statistics of random events with complete independence between their dates of occurrence, without requirement for a coupling relationship. The accelerations of the horizontal and vertical walls as presented in Tables 3 and 4 were imposed on the integral structure. The accelerations of the horizontal and vertical walls can be considered to be independent. The SRSS was used to analyze the maximum deformation in the section perpendicular to the shaft. As shown in Fig. 4, the clearance between the impeller and the diffuser should be guaranteed to ensure that there is no rub or disturbance between the rotor and the stator as required by RCC-M 2000 [14].
Table 3Input seismic acceleration of the horizontal wall
Frequency / Hz | 0.2 | 1 | 3.4 | 6.2 | 14.7 | 18 | 35 | 100 |
Acceleration / m2s-1 | 0.5 | 2.2 | 8 | 12 | 5.6 | 2.9 | 2 | 2.1 |
Table 4Input seismic acceleration of the vertical wall
Frequency / Hz | 0.2 | 2.4 | 5 | 9.8 | 14.2 | 20 | 35 | 100 |
Acceleration /m2s-1 | 0.3 | 3.7 | 3.7 | 6.8 | 6.8 | 2 | 1.4 | 1.4 |
Fig. 5Deformation of the impeller
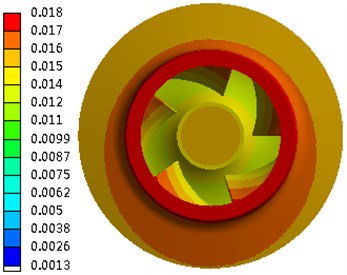
a) Deformation of the shroud in the horizontal direction
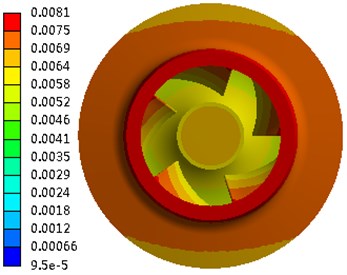
b) Deformation of the shroud in the vertical direction
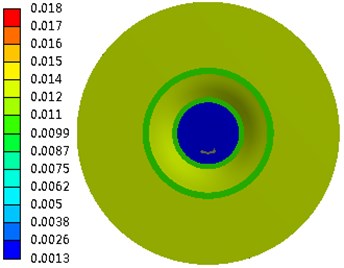
c) Deformation of the hub in the horizontal direction
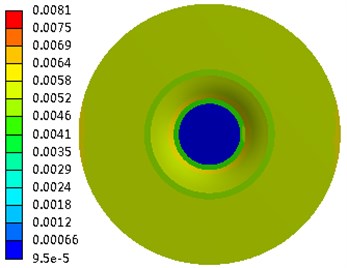
d) Deformation of the hub in the vertical direction
The absolute deformation of each component was very small, which implied that the integral structure was very rigid. The deformation of the impeller is shown in Fig. 5. When subjected to seismic loading in the horizontal direction, the deformation of the trailing edge of the impeller on the shroud was 0.016 mm, and that of the trailing edge of the impeller on the hub was 0.011 mm. Under seismic loading in the vertical direction, the deformation of the trailing edge of the impeller on the shroud was 0.0069 mm, and that of the trailing edge of the impeller on the hub was 0.0058 mm. In the section perpendicular to the shaft, the maximum total deformation of the trailing edge of the impeller obtained by the SRSS method was 0.0174 mm. This value is far below the unilateral clearance of 2 mm between the impeller and the diffuser, which indicates that there was no rub or disturbance between the rotor and the stator. The antiseismic requirement was therefore guaranteed. However, the value was smaller than that when the effect of the fluid on the structure is considered.
5. Displacement caused by fluid-induced vibration at startup
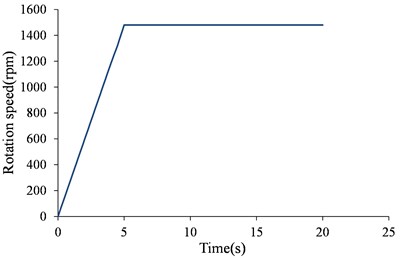
To consider the displacement of the trailing edge of the impeller at startup caused by fluid-induced vibration, a simulation that considered the vibration was carried out. The displacement of the trailing edge of the impeller at startup was numerically determined. The startup-process curves of the flow rate and the rotation speed in the time domain as obtained by the Flowmaster software are shown in Figs. 6 and 7, respectively. As can be observed from the figures, residual heat removal pumps need to be started and operated at a low flow rate for a period of time.
Fig. 6Flow rate curve
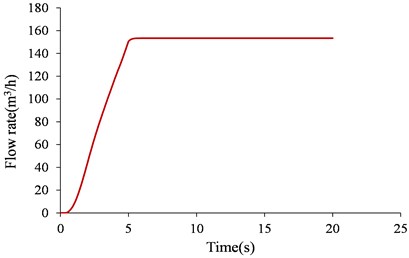
Fig. 7Rotating speed curve
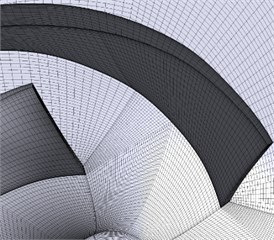
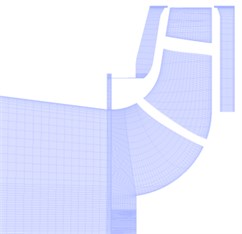
The effect of the fluid on the pump structure at startup was determined by the method of fluid-solid interaction. To do this, the structural dynamic equation, unsteady Reynolds-averaged Navier-Stokes equations, and continuity equation were simultaneously solved. In this study, the three-dimensional transient flow field was simulated using ANSYS CFX 14.5 and the shear stress transport turbulence model developed by Menter [15]. The transient dynamic characteristic of the structure was calculated using ANSYS Workbench 14.5. The structured grids of the computational domains were generated using the grid generation tool ICEM-CFD 14.5. The grid details in the rotating domain are shown in Fig. 8. A total of 5,351,483 grid nodes were used for the rotating and stationary domains. The independence of the solutions obtained using this number of grid nodes has been previously proven by simulation of the flow field using different numbers of grid nodes [16]. Fig. 7 shows the grid of the fluid domain; both the hub and shroud side chambers between the impeller and the pump casing are included in the grid to take the leakage flow effects into consideration. The details of the grid of the structure domain are shown in Fig. 9; a total of 180,940 grid nodes were used for the rotor system. To examine the deformation of the trailing edge of the impeller, the grid on it was refined.
The discretization of the space had a second-order accuracy, and the second-order backward Euler scheme was used for the time discretization. The interface between the impeller and the casing was set to “transient rotor-stator” to capture the transient rotor-stator interaction in the flow. This was because the relative positions of the impeller and the casing change from one time step to another for this type of interface. The inlet boundary condition was set to the total pressure, and the outlet boundary condition to the mass flow rate. A smooth wall condition was applied to the near-wall function. The time step for the transient simulation was set to 10-3 s, and the total time to 7.5 s. For stable numerical simulation, the applied initial distribution of the flow parameters was obtained as accurately as possible. This initial distribution was obtained in advance by the frozen rotor strategy. The surface of the blade was set as the computational coupling surface between the fluid and structure domains. In the structure domain, a fixed support was imposed on the surfaces that were in contact with the bearings, and a thermal load was applied to take into consideration the effect of temperature. A multi-field solver was used to transfer the transient information in the fluid domain to the structure domain.
Fig. 8Grid of the fluid domain

a)
b)
c)

d)
Fig. 9Grid of the structure domain
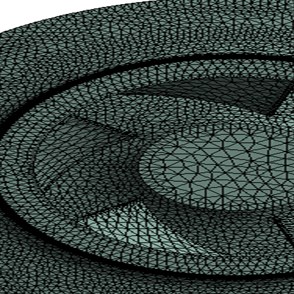
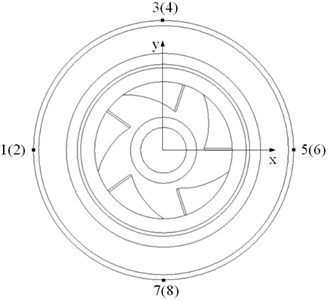
Fig. 10Positions of the monitoring points
a)
b)
The monitoring points on the trailing edge of the impeller are shown in Fig. 10. Spaced at 45°, points 1, 3, 5, and 7 were set on the trailing edge of the impeller on the shroud, and points 2, 4, 6, and 8 were set on the trailing edge of the impeller on the hub. The displacements of the monitoring points in the time domain are shown in Fig. 11. At the beginning of the startup process, the displacements changed violently with time, but gradually stabilized. After 0.2 s, the displacements were basically constant and much smaller than those at the beginning of the startup. We therefore focused on the first 0.2 s.
Fig. 11Displacements of the monitoring points
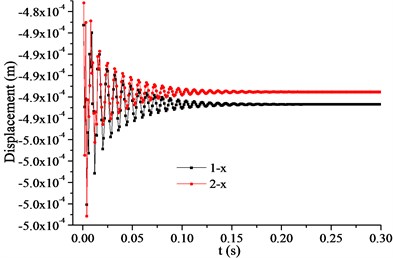
a) Horizontal displacements of points 1 and 2
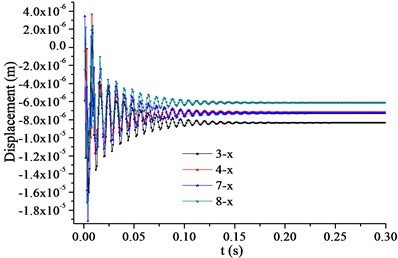
b) Horizontal displacements of points 3, 4, 7, 8
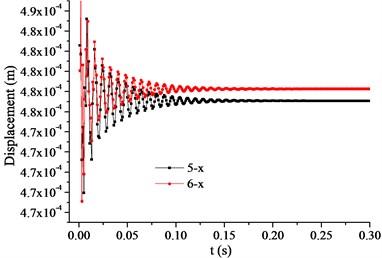
c) Horizontal displacements of points 5 and 6
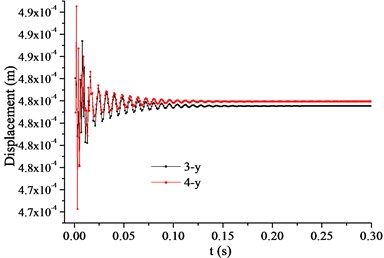
d) Vertical displacements of points 3 and 4
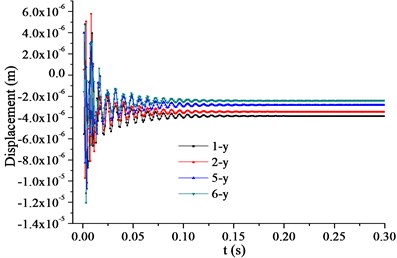
e) Vertical displacements of points 1, 2, 5, and 6
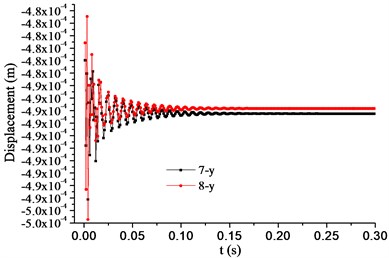
f) Vertical displacements of points 7 and 8
Because the clearance between the impeller and the diffuser should be guaranteed, the displacement of the trailing edge of the impeller at startup was studied. Axis is in the horizontal direction and axis in the vertical direction. Points 1 and 2 were located in the negative horizontal direction, and points 5 and 6 in the positive horizontal direction. Points 3 and 4 were located in the positive vertical direction, and points 7 and 8 in the negative vertical direction. As shown in Fig. 11, the horizontal displacements of points 3, 4, 7, and 8 (Fig. 11(b)) were two orders of magnitude smaller than their respective vertical displacements, (Figs. 11 (d) and 11(f)). The vertical displacements of points 1, 2, 5, and 6 (Fig. 11(e)) were two orders of magnitude smaller than their respective horizontal displacements (Figs. 11(a) and 11(c)). The vertical displacements of points 3 and 4 (Fig. 11(d)) were positive, indicating that their direction was vertically up. The vertical displacements of points 7 and 8 (Fig. 11(f)) were negative, indicating that their direction was vertically down. The horizontal displacements of points 1 and 2 (Fig. 11(a)) were negative, indicating that their direction was horizontally left. The horizontal displacements of points 5 and 6 (Fig. 11(c)) were positive, indicating that their direction was horizontally right. Therefore, the direction of the horizontal and vertical deformations of the impeller was outward.
The displacements of the monitoring points in the two directions are shown in Fig. 12. The displacements of points 1 and 6 in the horizontal direction were larger than those of points 2 and 5, respectively. The displacements of points 4 and 7 in the vertical direction were larger than those of points 3 and 8, respectively. The deformation in the section perpendicular to the shaft was neither in the vertical direction nor the horizontal direction, but inclined at certain angles to the vertical and horizontal, respectively. The displacements of the points in the horizontal direction are shown in Fig. 12(a), where lines and are of the same length, although line is horizontal whereas line is inclined at an angle to the horizontal. The projection of line to the horizontal is shorter than that of line , which indicates that there was a larger clearance between the impeller and the diffuser in the horizontal direction. The displacements of the points in the vertical direction are shown in Fig. 12(b), where lines and are of the same length, although line is vertical whereas line is inclined at an angle to the vertical. The projection of line to the vertical is shorter than that of line , which indicates that there was a larger clearance between the impeller and the diffuser in the vertical direction. The angles and increase the clearance between the impeller and the diffuser, and produce a safer margin in the event of an earthquake.
Fig. 12Displacements of the monitoring points
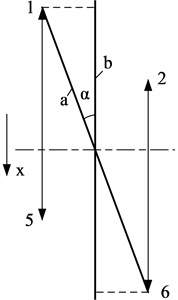
a) In the horizontal direction
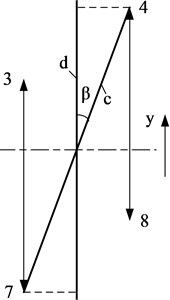
b) In the vertical direction
The maximum displacements on the shroud in the horizontal direction (point 1) and vertical direction (point 7) and the maximum displacements on the hub in the horizontal direction (point 6) and the vertical direction (point 4) during the first 0.2 s were respectively fitted using the Matlab software. The results of the fitting are shown in Fig. 13.
The results of the fittings are as follows.
Horizontal displacement on the shroud:
Vertical displacement on the shroud:
Fig. 13Fitting of the displacements
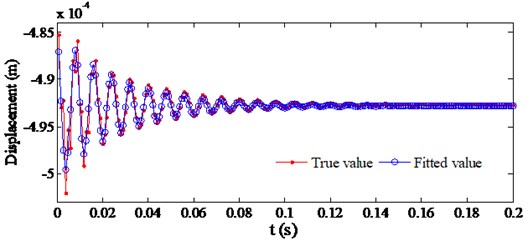
a) Horizontal displacement on the shroud
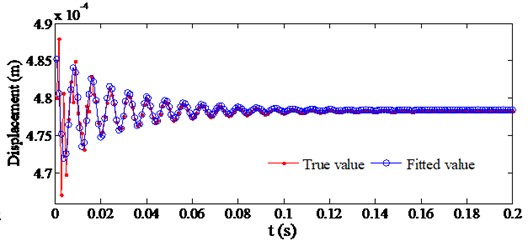
b) Horizontal displacement on the shroud
The fitting of the displacement on the hub is similar to that on the shroud.
Horizontal displacement on the hub:
Vertical displacement on the hub:
6. Displacement considering the seismic load and fluid-induced vibration
To determine the characteristics of the clearance between the impeller and the diffuser at startup, the displacements of the trailing edge of the impeller on the shroud and hub caused by fluid-induced vibration were respectively studied. Because these points had the maximum displacements in the horizontal and vertical directions on the shroud and hub, respectively, their expressions are partially conservative. The stable horizontal and vertical displacements on the shroud caused by the fluid-induced vibration were respectively 30 and 43 times those caused by a 1/2 SSE seismic load. Furthermore, the stable horizontal and vertical displacements on the hub caused by the fluid-induced vibration were respectively 71 and 83 times that caused by a 1/2 SSE seismic load. The forgoing indicates that the fluid-induced vibration significantly affects the analysis of the seismic response at startup. The periodicities of all the displacements were the same. The phases of the vertical displacements on the shroud and hub were also the same. However, the phase of the horizontal displacement on the hub was ahead of that on the shroud. The amplitudes of the horizontal displacements on the shroud and hub were also the same, although the amplitude of the vertical displacement on the hub was larger than that on the shroud. The expressions of the displacements at startup under a 1/2 SSE seismic load were obtained by combining the foregoing expressions with the displacements caused by a 1/2 SSE seismic load. As the following expression indicates, the total displacement consists of the displacement caused by the 1/2 SSE seismic load and that caused by the fluid-induced vibration:
where is the total displacement caused by the 1/2 SSE seismic load and the fluid-induced vibration, is the displacement caused by the 1/2 SSE seismic load, and is the displacement caused by the fluid-induced vibration.
The maximum displacements of the trailing edge of the impeller on the shroud and hub caused by the 1/2 SSE seismic load were used to obtain a partially conservative result of the seismic response analysis at startup. The total horizontal and vertical displacements on the shroud and hub are as follows:
Horizontal displacement on the shroud:
Vertical displacement on the shroud:
Horizontal displacement on the hub:
Vertical displacement on the hub:
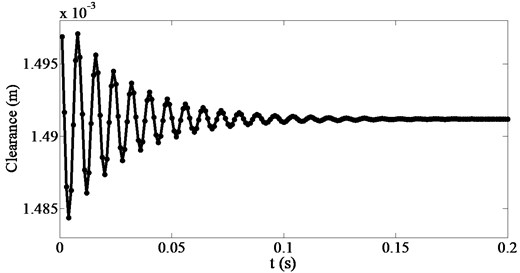
The expression of the horizontal displacement on the shroud has a stable maximum value and was used as the expression of the displacement on the trailing edge of the impeller. The expression of the clearance between the impeller and the diffuser at startup was obtained as follows:
where is the designed clearance between the impeller and the diffuser; is a coefficient; and determine the periodicity of the displacement; is the initial phase, namely, the phase of the displacement at 0 s; and is the stable displacement at startup caused by the fluid induced vibration.
The clearance between the impeller and the diffuser at startup in the time domain is shown in Fig. 14. As can be seen, the clearance varies violently over the first 0.1 s of the startup process, but gradually stabilizes over the next 0.1 s. The stable value of the clearance is much smaller than the initial values; the minimum value at the beginning of startup is about 1.485×10⁻³ mm. This indicates that the pump structure has very good seismic response characteristics and satisfies the requirements of integrity and operability under seismic loading.
Fig. 14Clearance between the impeller and the diffuser
7. Conclusions
A residual heat removal pump is not operated during normal operation of a nuclear power plant, and is only activated by accidents such as those resulting from an earthquake. The antiseismic performance of the pump at startup is therefore important and its improvement is an essential factor that should be considered in the optimal design of the pump. In our study, CFD and FE predictions and analyses of the deformation of the trailing edge of the impeller of a residual heat removal pump caused by seismic loading and fluid-induced vibration were conducted to evaluate the clearance between the impeller and the diffuser of the pump for antiseismic considerations. The numerical results were experimentally verified.
The numerical results clearly showed that asymmetrical deformation in two orthogonal directions in the section perpendicular to the shaft was possible, as well as expansion deformation of the impeller. The deformation of the trailing edge of the impeller in the section is inclined to both the horizontal and vertical, and the inclination increases the clearance between the impeller and the diffuser, which affords greater margin of safety in the pump structure in the event of an earthquake. The expression of the clearance between the impeller and the diffuser at startup is a damped oscillation function that combines an exponential function and a sine function. The clearance between the impeller and the diffuser at startup exhibits very good seismic response based on the RCC-M 2000 standard. The findings of this study should be considered in the optimal design of a residual heat removal pump. Compared to former methods for analyzing the seismic response of pumps, the method employed in the present study enables direct and easy evaluation of the clearance between the rotor and stator in assessing the integrity and operability of the pump under seismic loading, taking into consideration the effect of fluid-induced vibration.
The effects of the fluid on the structure of a pump at startup should be considered for accurate prediction of the antiseismic performance of the pump because it is subjected to large deformations by seismic loading. The optimized design procedure for a residual heat removal pump for good antiseismic performance at startup will not be accurate if conducted using only an FE tool; the deformation caused by fluid-induced vibration should also be considered using a CFD tool.
References
-
Yujie L., Huimin L., Serikawa, et al. Segmentation of offshore oil spill images in leakage acoustic detection systems. Research Journal of Chemistry and Environment, Vol. 17, 2013, p. 36-41.
-
ChaoFeng L., JingYu S., Wei W. ArcGIS-based regional seismic hazard environment evaluation based on catastrophe progression method. Research Journal of Chemistry and Environment, Vol. 16, 2012, p. 122-127.
-
Alvarado-Corona Rafael, Santos-Reyes Jaime Applying MORT to the analysis of the Haiti’s earthquake. Disaster Advances, Vol. 5, Issue 4, 2012, p. 102-109.
-
Park H. S., Choi K. Y., Cho S., et al. Experiments on the heat transfer and natural circulation characteristics of the passive residual heat removal system for an advanced integral type reactor. Journal of Nuclear Science and Technology, Vol. 44, Issue 5, 2007, p. 703-713.
-
Bhardwaj R., Sharma M. L., Kumar A. Inclusion of Q-value in parameters used for earthquake early warning systems. Disaster Advances, Vol. 6, Issue 5, 2013, p. 54-60.
-
Lv X., Yan C., Gu H. Experimental study of density lock in passive residual heat removal system. Power and Energy Engineering Conference (APPEEC), Asia-Pacific, 2012, p. 1-5.
-
Suarez L. E., Singh M. P., Rohanimanesh M. S. Seismic response of rotating machines. Earthquake Engineering and Structural Dynamics, Vol. 21, Issue 1, 1992, p. 21-36.
-
Karasudhi P., Wijeyewickrema A. C., Lai T. Seismic response to a prescribed seismogram of a body embedded in a multilayered half space. Computational Mechanics, Vol. 22, Issue 1, 1998, p. 70-76.
-
Zhou Wenxia, Zhang Jige, Wang Dezhong Analysis and assessment on seismic response of reactor coolant pump in nuclear power plant. Atomic Energy Science and Technology, Vol. 45, Issue 1, 2011, p. 54-59.
-
Lefebvre P. J., Barker W. P. Centrifugal pump performance during transient operation. ASEM Journal of Fluids Engineering, Vol. 117, Issue 1, 1995, p. 123-128.
-
Farhadi K., Bousbia-Salah A., D’Auria F. A model for the analysis of pump start-up transients in Tehran research reactor. Progress in Nuclear Energy, Vol. 49, Issue 7, 2007, p. 499-510.
-
Wu Y. W., Su G. H., Qiu Suizheng, et al. Development of a thermal-hydraulic analysis software for a passive residual heat removal system. Annals of Nuclear Energy, Vol. 48, 2012, p. 25-39.
-
Vaithiyanathan V., Raj Anishin M. M., Venkatraman B. Disaster avoidance in industries through weld flaw detection from radiographic weld images using radon transform and improved fuzzy C-means clustering. Disaster Advance, Vol. 6, Issue 8, 2013, p. 47-53.
-
French Association for Design, Construction and In-service Inspection Rules for Nuclear Island Components. Design and Construction Rules for Mechanical Components of PWR Nuclear Islands, 2000.
-
Menter F. R. Two-equation eddy-viscosity turbulence models for engineering applications. AIAA Journal, Vol. 32, Issue 8, 1994, p. 1598-1605.
-
Benra F. K. Numerical and experimental investigation on the flow induced oscillations of a single-blade pump impeller. ASME Journal of Fluids Engineering, Vol. 128, Issue 4, 2006, p. 783-793.
About this article

This research is supported by the Key Program of National Natural Science Funds of China (Grant No. 51239005) and the National Science and Technology Pillar Program of China (Grant No. 2011BAF14B04) and the Graduate Innovation Funds of Jiangsu Province (CXZZ13_06).
