Abstract
This research proposes an experimental procedure and ground noise cancellation method for detecting the presence of a person in a 3.5 ton truck, in an environment with high levels of ground noise. This study addresses the need for non-intrusive detection system that involves using velocity sensors placed on the chassis-frame to detect the weak vibrations generated by any human inside the vehicle. An additional velocity ground sensor is placed near the front tire to collect the ground noise signals that are used to estimate the ground noise response of the truck by manipulating a 2-DOF (degree of freedom) equivalent truck model. To increase the discriminative rate in the context of two scenarios, a person present and a person absent from the vehicle, a valid algorithm is proposed that decreases the ground noise effect emanating from the environment. Furthermore, two types of sensor location are discussed to promote the practicability of the proposed system.
1. Introduction
Digital signal measurement techniques are widely applied in extracting different types of biometric signal, such as the human heartbeat, breathing rate, and blood pressure. Applications include monitoring the condition of patients [1-3], searching the survivors from the rubble after powerful earthquake with a through wall radar [4-6], and using infrared ray for monitoring the body temperature in a public environment is a useful method to reduce the disease spread. In recent years, detecting stowaways in trucks was recognized as an increasingly crucial application, regarding the prevention of illegal immigration and the global context of national security [7-9]. These types of measurement technique can help protect personnel and save time when vehicles are inspected.
Human vibrations generate frequencies within multiple ranges [10]. Heartbeat and breathing frequencies are always below 2 Hz. It is difficult to detect this low frequencies when the transmission occurs through the chassis of a vehicle. The sounds generated by the heartbeat and breathing have audible frequencies from 30 to 300 Hz. Detecting and processing human sounds by using a microphone is difficult because of the interference of external noise. However, studies have shown that the human body generates vertical vibrations at low frequencies, mainly because of an involuntary phenomenon called “ballistocardiac vibrations” [11-12]. These vibrations can be detected using suitable sensors operating within the frequency range of 4 to 8 Hz. If a person is present within a vehicle, these vibrations are involuntarily transmitted to the chassis and suspension system, causing the vehicle to resonate within the same frequency range.
To detect the ballistocardiac vibrations and distinguish them from other noise in the vehicle chassis, a novel detection system that features noise cancellation capability and involves employing highly sensitive sensors was developed in a related study [13]. However, the validity of the detection system has been tested only by using a small passenger vehicle. In the present study, to extend the system practicability, a 3.5-ton truck was utilized to conduct verification tests of the detection system. In addition, the sensor locations, parameters of an equivalent vehicle model separated between the front and rear sets of the vehicle body, and a method to determine the threshold when a person is present and absent were discussed.
2. System and data processing
2.1. Measuring system and sensor locations
The measuring system consisted of five passive velocity sensors: four vehicle sensors, and one ground sensor [13]. A data acquisition (DAQ) system was used to collect the voltage signals, representing real world physical vibrations, and convert the voltage samples into digital-numeric values that could be processed by a computer. To reduce the ground noise effect, a ground sensor was placed near the front tire of the truck for detecting the disturbance of the environment in real time, as shown in Fig. 1. Fig. 2(a) shows one of the vehicle sensor locations on the chassis-frame of the truck. To evaluate the signal sensitivities and discriminative rate, two sets of sensor locations were adopted, as shown in Fig. 2(b) and 2(c).
Fig. 1Ground sensor location
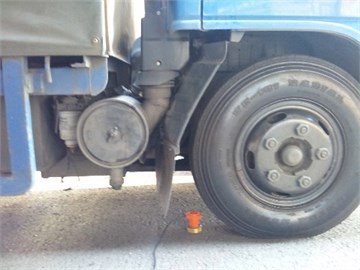
Fig. 2Sensor locations a) one of the sensor locations and b) sensors placed at two chassis-frames and c) sensors placed at one chassis-frame
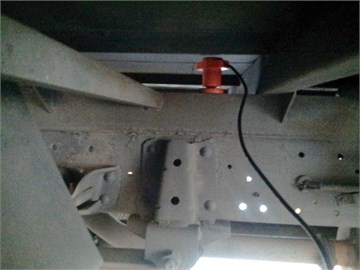
a)
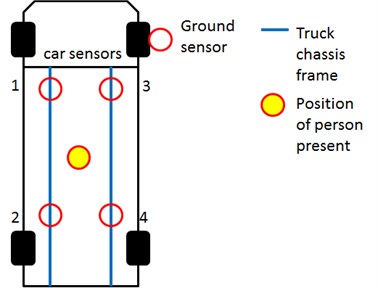
b)
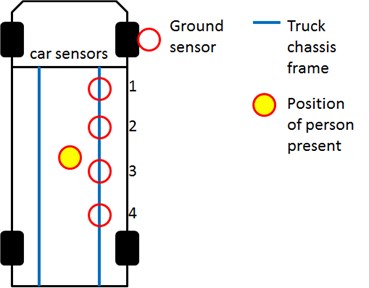
c)
2.2. Data processing
To enhance the accuracy of measuring the ballistocardiac vibrations from the vehicle chassis and to process raw data, a bandpass filter with a range of 2 to 10 Hz was used. To measure the vital-sign levels, the root-mean-square (RMS) method was used to calculate the average energy of the vehicle vibration, with 1-s interval between each channel (four channels in total). Computing the sum of the RMS sequences from each of the four channels generated 32 sequence values during each 32-s measuring procedure.
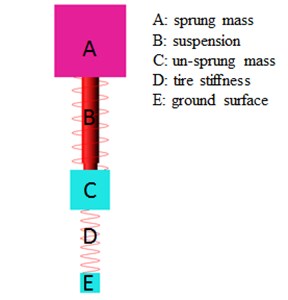
To determine how the vehicle sensor response was affected by ground noise, the signals measured by the ground sensor were imported to a corresponding 2-DOF equivalent vehicle model, as shown in Fig. 3. Because of the truck’s particular suspension system and vehicle structure, the parameters for the front and rear sets of the sensors were defined independently. Thus, two sets of parameters, as listed in Table 1, were used to simulate the ground response of the vehicle. When the vehicle sensors were placed on both chassis-frames, as shown in Fig. 2(b), the front set of sensors (No. 1 and No. 3) and the rear set of sensors (No. 2 and No. 4) were simulated according to the corresponding parameters shown in Table 1. To understand how the accuracy of the simulation was affected by employing alternate sensor locations, four sensors were placed on only one chassis-frame, as shown in Fig. 2(c). Thus, the front set of sensors (No. 1 and No. 2) and the rear set of sensors (No. 3 and No. 4) were also simulated according to the mentioned method.
Table 1The parameters of the equivalent car model
Vehicle types | Parameter types | Sprung mass (Kg) | Un-sprung mass (Kg) | Suspension stiffness (N/m) | Suspension damping (Ns/m) | Tire stiffness (N/m) |
3.5 ton truck | Front set of parameters | 550 | 200 | 500000 | 2300 | 1600000 |
Rear set of parameters | 550 | 200 | 1200000 | 4000 | 1600000 |
Fig. 3Equivalent vehicle model (quarter vehicle)
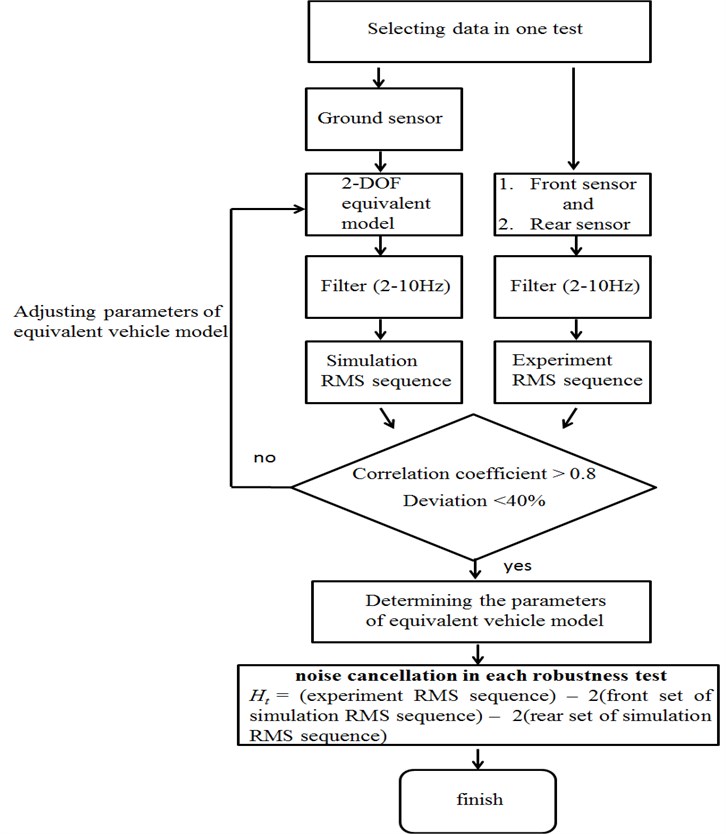
To cancel the ground noise effect, the ground noise response of the vehicle was processed by calculating the 32 RMS time sequences. When the simulated RMS time sequence and experimental time sequence from each channel showed similar values, through adjusting the equivalent M-C-K (mass, damping, stiffness) parameters, both RMS time sequences were subtracted to obtain the values for the sequence . The definition of values is modified from the values presented in our previous study [13]. A flowchart illustrating the noise cancellation method is shown in Fig. 4. The values for was calculated using the following equation:
sum of the RMS sequence from each vehicle sensor 2 × the front set of the simulated RMS sequence 2 × the rear set of the simulated RMS sequence:
where is the sampling time, 0.001 s. is the calculating interval, 1 s, and , , , and are the vibration signals of each of the vehicle sensors. is the ground noise signal and and are the ground noise responses of the vehicle.
Fig. 4The flowchart of noise cancellation method
3. Experiment results
To demonstrate the noise cancelling capability of the proposed system, the experiments were conducted under a freeway overpass with significant levels of ground noise, as shown in Fig. 5. The truck used for the experiment was a 1998 ISUZU Lona.
To evaluate the performance of the system, the experiment was performed in three stages. First, to detect the ground noise level, the time domain of the raw data measured on the ground surface was transferred to the frequency domain, using fast Fourier transform (FFT). To demonstrate the cancellation ability, the signals were then processed using the proposed method for cancelling the ground noise effect. Finally, to determine whether a person inside a vehicle could be detected using the processed data, robustness tests were conducted by applying two sets of sensor locations.
3.1. Ground noise level
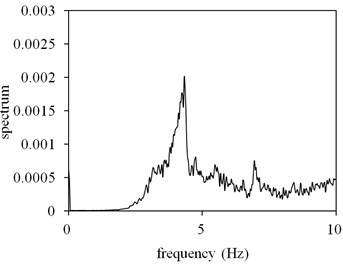
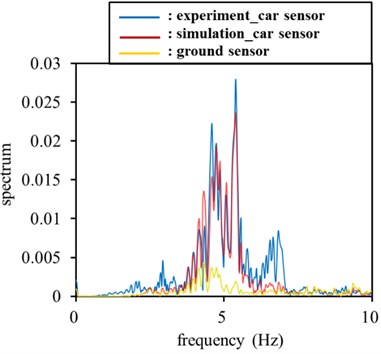
The detection procedure entailed simultaneously measuring the ground signals acquired by the system. Fig. 6 shows a typically measured FFT spectrum. The FFT spectrum exhibited a pronounced noise band from 4 to 10 Hz, which overlapped the frequency range of the ballistocardiac vibrations. When high levels of ground noise affected the vehicle chassis, detecting the vital signs of a person was difficult. Thus, the noise cancellation method had to be used.
Fig. 5Freeway overpass with significant levels of ground noise
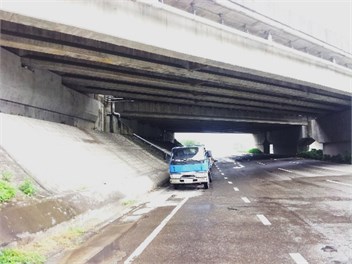
Fig. 6FFT spectrum measured under freeway overpass
3.2. Ground noise cancellation
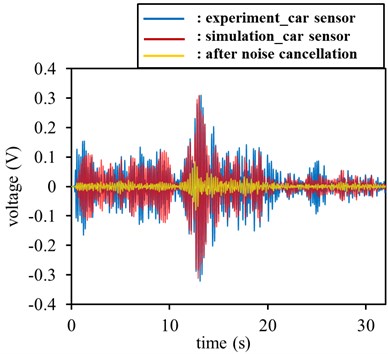
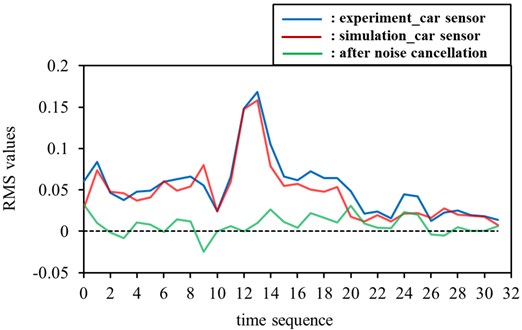
According to the proposed method for calculating the ground noise response of the front set of sensors, a typical simulation result was compared with the result of the experiment, as shown in Fig. 7(a) and 7(b). In Fig. 7(a), the time-domain response of the experiment was similar to that of the simulation response. In Fig. 7(b), the experimental FFT signals were similar to those of the simulation FFT signals. The two maximum peaks of both FFT signals were near 0.08, and both resonant frequencies were near 4.5 Hz.
The algorithm used in Equation 1 and shown in Fig. 4 was used to cancel the ground noise effect. To demonstrate the relationships between the simulated RMS sequences and those of the experiment, the two results were compared using an average-deviation estimation and correlation-coefficient analysis. In this test, the correlation coefficient and average deviation were 0.921 and 32.94 %, respectively, as shown in the column Test 1 of Table 2. Thus, the green line in Fig. 8, which represents the difference between the simulation and the experiment, is relatively flat and close to zero. As shown in Table 2, 10 tests were conducted to demonstrate reproducibility under the condition of no person being present within the vehicle. Table 2 also shows that each result of the correlation-coefficient analysis was higher than 0.8, and each average deviation computed between the experiment and the simulation was less than 40 %. In other words, the ground noise measured on the chassis of the truck was accurately captured, and its effect successfully reduced.
As shown in Fig. 9(a) and 9(b), the ground noise response of the rear set of sensors was compared with the experimental result of the typical test. The results of the simulation and those of the experiment were adequately close for ground noise cancellation, as shown in Fig. 10. The correlation coefficients and average deviations listed in Table 3 demonstrated the reproducibility of the proposed method.
Fig. 7Experiment signals versus simulation signals in front set of sensors: a) experiment time signals versus simulation time signals, b) experiment FFT signals versus simulation FFT signals
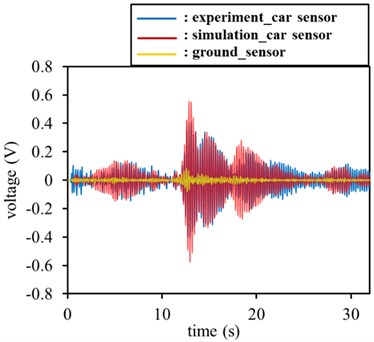
a)
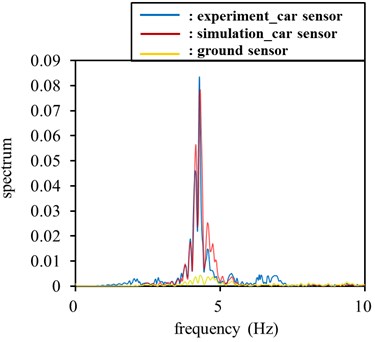
b)
Fig. 8Noise cancellation of front set of sensor
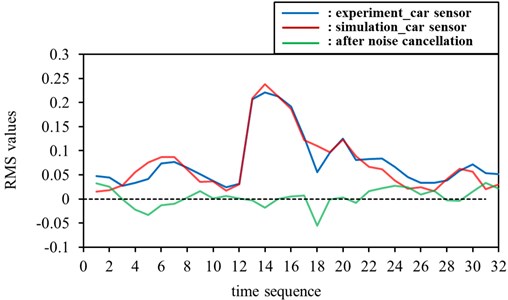
Table 2The statistics of ten tests with correlation coefficient and average deviation (front set of sensor)
Test 1 | Test 2 | Test 3 | Test 4 | Test 5 | Test 6 | Test 7 | Test 8 | Test 9 | Test 10 | |
Correlation coefficient | 0.921 | 0.869 | 0.880 | 0.956 | 0.856 | 0.800 | 0.834 | 0.853 | 0.850 | 0.877 |
Average deviation (%) | 32.94 | 37.49 | 36.17 | 30.77 | 39.51 | 38.07 | 37.18 | 38.25 | 31.21 | 31.94 |
Table 3The statistics of ten tests in correlation coefficient and average deviation (rear set of sensor)
Test 1 | Test 2 | Test 3 | Test 4 | Test 5 | Test 6 | Test 7 | Test 8 | Test 9 | Test 10 | |
Correlation coefficient | 0.926 | 0.814 | 0.811 | 0.860 | 0.953 | 0.913 | 0.902 | 0.885 | 0.835 | 0.940 |
Average deviation (%) | 25.27 | 23.47 | 32.19 | 32.6 | 39.8 | 34.65 | 26.84 | 38.15 | 26.85 | 24.16 |
Fig. 9Experiment signals versus simulation signals in rear set of sensor: a) experiment time signals versus simulation time signals, b) experiment FFT signals versus simulation FFT signals in rear set of sensors
a)
b)
Fig. 10Noise cancellation of rear set of sensor
3.3. Robustness tests
To demonstrate the ability to detect the presence of a human in the truck under a freeway overpass, 10 tests were conducted with a person present in the vehicle, and 10 without a person present. The position of person present was allocated at the center of cargo area as shown in Fig. 2(b) and 2(c). To compare the signal sensitivities, the tests were conducted with different placement locations of the two sets of sensors.
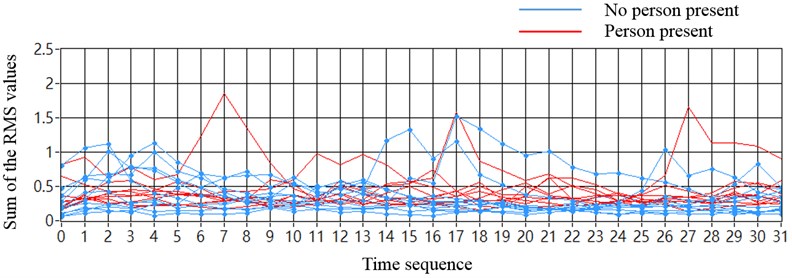
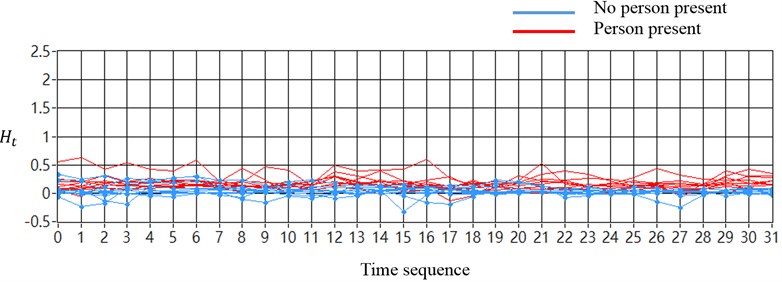
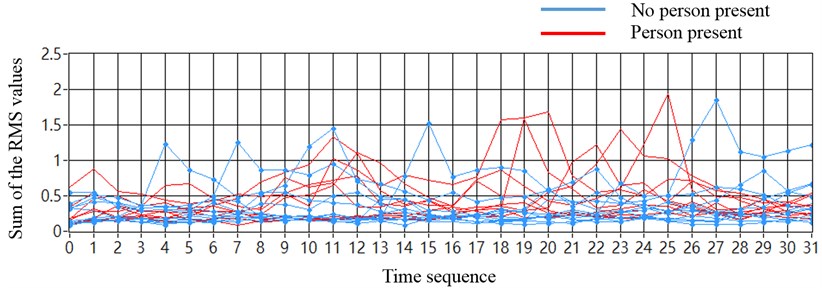
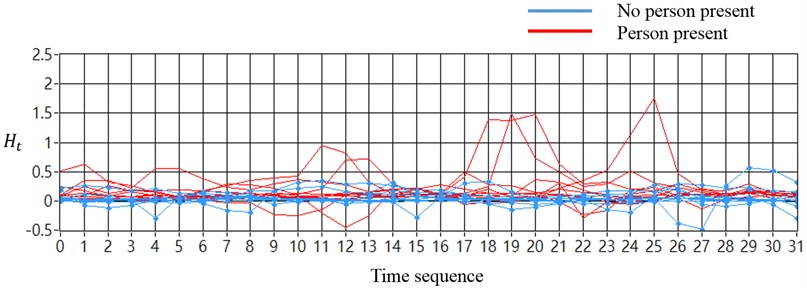
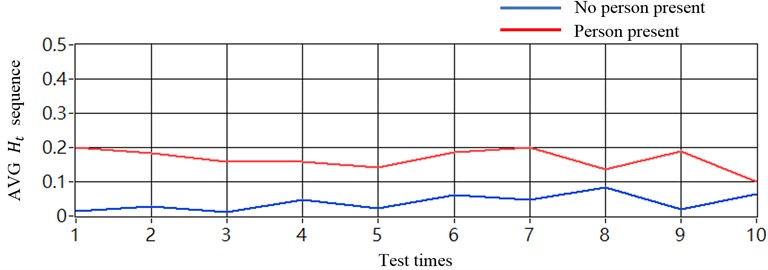
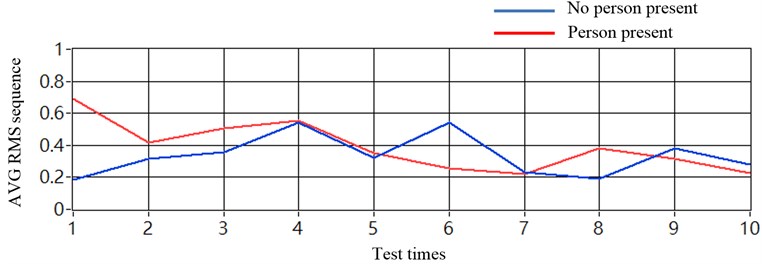
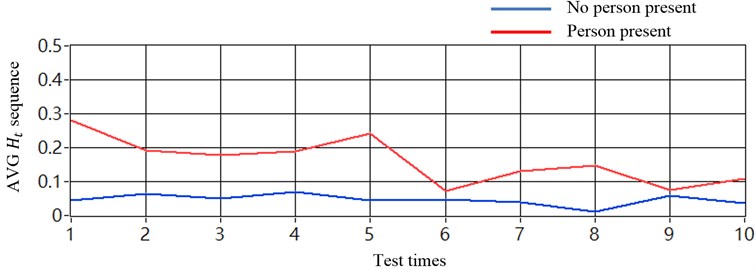
When the sensor locations were placed on both chassis-frames of the truck, the test data of each of the four vehicle sensors were collected by the proposed system and used to compute the sum of the RMS sequences from each channel, without employing a noise cancellation method. The magnitudes of the sequences from tests with no person present were not distinguishable from those of tests with a person present, as shown in Fig. 11(a). As shown in Fig. 11(b), processing the data by using the noise cancellation method caused the discrimination of sequences from tests with no person present and tests with a person present to show an increase, and be more stable. When the sensor locations were on only one chassis-frame, similar results were confirmed, as shown in Fig. 12(a) and 12(b).
Fig. 11Tests under freeway over-pass (sensors placed at two chassis-frames): a) tests without using noise cancellation method and b) tests with using noise cancellation method
a)
b)
4. Discussion
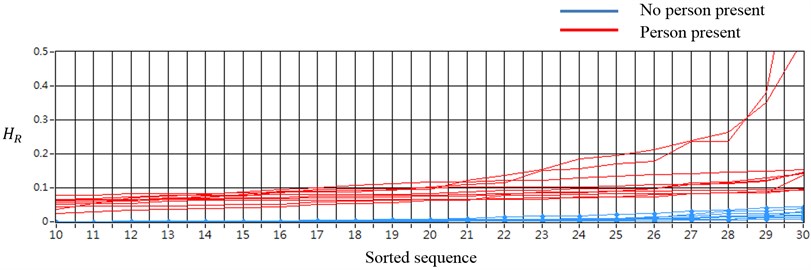
In a related study that we conducted, the results of signal processing that involved using a passenger car [13] demonstrated that the discriminative rate was nearly 100 % accurate in detecting a person inside a vehicle, by using certain portions of the indices, as shown in Fig. 13. When conducting tests to detect human ballistocardiac vibrations by using a 3.5-ton truck, certain parts of the time sequences of tests with no person present were difficult to distinguish from those of tests with a person present. Thus, averaging 32 sequence values from each test was essential for determining the detection results.
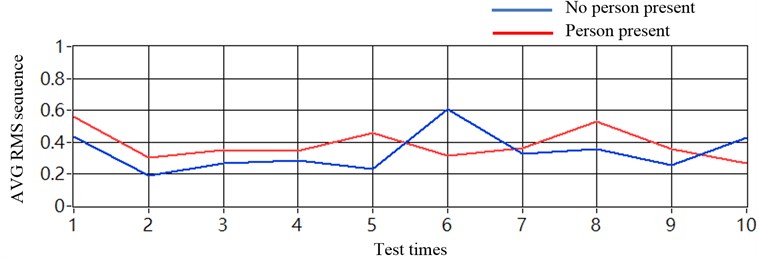
Fig. 11(a) shows the results of the tests in which the vehicle sensors were placed on both chassis-frames and no noise cancellation method was used. The corresponding average results shown in Fig. 14(a) could not be used to determine the threshold. By contrast, using the proposed method for cancelling the ground noise effect and the corresponding average sequence revealed that the discriminative rate was 100 % accurate, and that the threshold could be applied from 0.08 to 0.1, as shown in Fig. 14(b).
The same average method was used to process the results, shown in Fig. 12. The corresponding average results, shown in Fig. 15(a), were also not useful in determining the threshold. When the proposed method of noise cancellation was implemented, the average results demonstrated that the threshold could be applied from 0.07 to 0.08, to obtain a 100 % accurate discriminative rate, as shown in Fig. 15(b).
According to the results of tests using various types of sensor locations, as shown in Fig. 14(b) and 15(b), the tolerance of the threshold tested by placing sensors on the two chassis frames was higher; nevertheless, a suitable threshold tolerance on one chassis frame can be obtained with satisfactory results.
Fig. 12Tests under freeway over-pass (sensors placed at one chassis-frame): a) tests without using noise cancellation method and b) tests with using noise cancellation method
a)
b)
Fig. 13The sorted HR values of the certain parts of time sequence (passenger car)
4. Conclusions
This study presents a system for detecting the vital signs of a person inside a 3.5-ton truck, by detecting the ballistocardiac vibrations generated by humans. To increase the discriminative rates, a valid algorithm for cancelling the ground noise effect is proposed. The 2-DOF equivalent model was successful in predicting the vehicle sensor response by measuring real-time ground vibrations. To demonstrate accurate discriminative rates, averaging the sequence values provided a useful threshold for detecting the presence of a person in a vehicle under the influence of high levels of ground noise.
Fig. 14Results in averaging sequence values (sensors placed at two chassis-frames): a) without using noise cancellation method and b) with using noise cancellation method
a)
b)
Fig. 15Results in averaging sequence values (sensors placed at one chassis-frame): a) without using noise cancellation method and b) with using noise cancellation method
a)
b)
References
-
Cheng C. Y., Lan T. H., Chan C. H. An improved localization algorithm with wireless heartbeat monitoring system for patient safety in psychiatric wards. Engineering Applications of Artificial Intelligence, Vol. 26, 2013, p. 905-912.
-
Baek H. J., Chung G. S., Kim K. K., Park K. S. A smart health monitoring chair for nonintrusive measurement of biological signals. IEEE Transaction on Information Technology in Biomedicine, Vol. 16, Issue 1, 2012, p. 150-158.
-
Lim Y. G., Hong K. H., Kim K. K., Shin J. H., Lee S. M., Chung G. S., Baek H. J., Jeong D. U., Park K. S. Monitoring physiological signals using nonintrusive sensors installed in daily life equipment. Biomedical Engineering Letters, Vol. 1, 2011, p. 11-20.
-
Jang B. J., Wi S. H., Yook J. G., Lee M. Q., Lee K. J. Wireless bio-radar sensor for heartbeat and respiration detection. Progress in Electromagnetics Research, Vol. 5, 2008, p. 194-168.
-
Mikhelson I. V., Bakhtiari S., Elmer T. W., Sahakian A. V. Remote sensing of heart rate and patterns of respiration on a stationary subject using 94-GHz millimeter-wave interferometry. IEEE Transactions of Biomedical Engineering, Vol. 58, Issue 6, 2011, p. 1671-1677.
-
Chuang H. R., Kuo H. C., Lin F. L., Huang T. H. 60-GHz millimeter-wave life detection system (MLDS) for noncontact human vital-signal monitoring. IEEE Sensors Journal, Vol. 12, Issue 3, 2012, p. 602-609.
-
Williams D. The immigrants stuffed into car seats and under bonnets trying to get into Europe. Daily Mail, December 29, 2007.
-
Zargham M. Obama to tackle immigration reform this year: Report. Reuters, September 9, 2009.
-
David A. Human occupancy detection. Cargo Inspection Technologies, Vol. 2276, 1994, p. 268-278.
-
Irwin J. D., Graf E. R. Industrial Noise and Vibration Control. Prentice-Hall Inc., 1979.
-
Gottlieb S., Lippold O. C. The 4-6 HZ tremor during sustained contraction in normal human subject. Journal of Physiol, Vol. 336, 1983, p. 499-509.
-
Marsden C. D., Meadows J. C., Lange G. W., Watson R. S. The role of the balllistocardiac impulse in the genesis of physiologic tremor. Brain, Vol. 92, 1969, p. 647-662.
-
Liu C. C., Hung C. H., ChienH. C. Development of vital signs detection system with ground noise cancellation. Journal of Vibroengineering, Vol. 16, Issue 7, 2014, p. 3361-3371.
About this article

