Abstract
In this paper, a new lateral load pattern is proposed for pushover analysis of structures. In order to evaluate the accuracy and performance of the proposed lateral load pattern in estimation of seismic behavior of structures, the capacity curves obtained from the pushover analysis with the proposed lateral load pattern are compared to the capacity curve obtained from the incremental dynamic analysis (IDA) as an exact solution. Moreover, for comparison purposes, the uniform and triangular lateral load patterns proposed by Federal Emergency Management Agency (FEMA) are applied for the pushover analysis. Numerical studies are carried out on three frames with 4, 12 and 20-story and two lateral resisting systems, steel moment-resisting frames (MRF) and concrete special moment-resisting frames (SMRF). The results indicate that in the low-period steel MRF, the triangular load pattern and with the increase of the period, the uniform lateral load patterns are suitable for lateral load distribution. Furthermore, the results show that the proposed load pattern can provide an appropriate accuracy to estimate seismic behavior of the structures. In low-period concrete SMRF, the uniform load pattern proposed by FEMA is a suitable pattern for pushover analysis, but with increase of the period, the lateral load patterns recommended by FEMA cannot provide accurate results. However, the proposed lateral load pattern indicates more accuracy results. Therefore, it is suggested to evaluate the nonlinear behavior of the structures.
1. Introduction
Nonlinear dynamic analysis of structures is the most precise method to investigate seismic demand of the structures. However, because of the some issues and practical complexities of this method, the usage of this method is faced with some limitations. Therefore, extensive efforts have been introduced for development of the applied and simplified methods to nonlinear analysis of the structures. In the recent years, considering to evaluation of buildings based on the displacement, the nonlinear static analysis known as pushover analysis was introduced. In this method, the design of the structural elements is based on their performance levels. This method has been developed in the earthquake engineering as an appropriate applied tool. It can provide useful information about the nonlinear behaviour of the structures, the location of plasti joint formation and the way of redistribution of the loads, etc. which cannot be obtained by the linear static analysis. In this method, firstly a load pattern is assumed to apply to the structure, then, the load pattern is increasingly applied to the structure until the displacement of a certain point of the structure reaches a certain value well-known as target value. In this state, the nonlinear behaviour of structural elements is evaluated. Then, the values of internal displacements and the forces are determined. The sequence of happening of fractures, plastic joints and the failures of structural elements can easily be shown during the process. This process continues until either the structure displacement exceeds to the target displacement or collapse of the structure. In these methods, the target displacement is intended to represent the maximum displacement likely to be experienced during the design earthquake. In order to evaluate the performance of structure, the capacity spectrum of the structure is compared to the seismic demand spectrum (SDS). In fact, the pushover analysis is an alternative simple method from the most complete and precise structural seismic analysis namely the nonlinear dynamic analysis. Nevertheless, in the process of nonlinear static analysis, the quality of the lateral load distribution has a significant effect on assessment of nonlinear behaviour and estimation of the need to the force and displacement of the structure and structural elements. The lateral load pattern is representative of the distribution of the lateral inertia forces applied to the structure subjected to earthquake. The lateral load distribution must be selected in such a way that the most critical conditions to be created. If the structure has linear elastic behaviour, the lateral load distribution will be a function of many parameters such as level and frequency content of earthquake, the frequencies and the mode shapes of the structure. If the structure has nonlinear behaviour, the lateral load distribution will be a function of the abovementioned parameters as well as local or global yield of the elements and hence, it will be more complicated. Although, pushover analysis is the best methods for structural design, but the studies on the accuracy and validity of them results as well as attempts to simplify of this method are still on going.
Yang et al. [1] proposed a lateral load pattern, as an estimation of distribution of the inertia forces of the multi-degree-of-freedom structures. Hosseini and Yaghoobi [2] developed the pushover analysis for asymmetric 3D structures. Their studies focused on asymmetric 8-story steel structure. In this study, the coefficient of 1.7 was recommended for multiplying the lateral forces of earthquake. This suggestion has agreement with the suggestions of many worlds' famous codes in this field. Chopra and Goel [3-4] developed a pushover analysis process based on the structure dynamic theory known as modal pushover analysis (MPA). Comparison of the maximum nonlinear response of a 9-story structure and the offered method shows that this process provides a good estimation of the roof displacement, inter-story drifts and determination of plastic joint location. Moreover, they developed the MPA for asymmetric structures [5]. Kalkan and Kunnath [6] carried out the alternative multi-mode pushover analysis on 8 and 12-story steel structures with SMRF system. They concluded that proposed method provide more appropriate estimations of inter-story drift and the roof displacement in comparison with the load patterns proposed by FEMA. Matsumori et al. [7] compared the distribution of story displacements and ductility demands of members with the obtaind results from IDA and pushover analyses. This study is done on deformation demands of members in the seismic design of reinforced concrete structures. They indicated that if the lateral force distribution were taken to be the sum and the difference of the first two modes, the results provide a reasonable estimate of the distribution of deformation demands of members during an earthquake. De-La-Colina et al. [8] evaluated the pushover analysis by considering the interaction of the flexural moment and the axial force of the columns in low-rise concrete structures. They concluded that this interaction has not significant effect on the capacity curve of the structures. Abhilash et al. [9] compared the capacity curves of a 4-story concrete structure with SMRF considering four lateral load patterns: uniform load adopted from FEMA-273, the equivalent lateral load proposed by FEMA-257, the load pattern suggested by the Indian standard (IS 1893_2002) and the upper band pushover analysis (UBPA) suggested by Janetal in 2004. They concluded that the capacity curves of the structure in four load patterns are almost close to each other. Weixing [10] compared the capacity curves from IDAs and the pushover analysis for two concrete structures. He introduced a load pattern well-known parabola pattern as given by Eq. (1):
where is the amplification of lateral load in the -th story and is the number of stories. He investigated the performance of the proposed lateral load on 17-story and 22-story concrete structures. Then, he compared the capacity curves of pushover analysis with IDAs. He proposed 0.3 and 0.5 for the studied structures, respectively. Trica and Chen [11] investigated the six lateral load distribution patterns for seismic design of low, mid and high-rise zipper braced frame buildings. In addition, they reported significant information for the development of displacement loading protocols. Khoshnoudian et al. [12] proposed a modified consecutive modal pushover procedure. They investigated the accuracy of the proposed procedure by comparing the provided result of the proposed method with the results of FEMA, the practical modal pushover procedure and nonlinear time history analyses. They show that the proposed method is able to estimate the displacements and story drifts accurately. Also, they show that the proposed method introduces a great improvement in predicting the plastic hinge rotations.
In this paper, a new and simple lateral load pattern has been presented. The proposed lateral loads pattern provides an accurate estimation of nonlinear behaviour of the structures subjected to earthquake excitations. In order to assess the accuracy and performance of the lateral load pattern, the capacity curves obtained from the pushover analysis with the proposed lateral load pattern is compared to the capacity curve obtained from IDA. Furthermore, the uniform and triangular lateral load patterns proposed by FEMA are compared with the offered lateral load pattern.
2. Structural models
The numerical simulations are carried out on three regular symmetric frames with 4, 12 and 20-story. They are sample of common structures with low, intermediate and high period, respectively. Two lateral resisting systems: steel MRF and concrete SMRF are assumed for structural models. Structural models with span ratios in the range of 1.5, 1.5 3 and 3 have been optioned. and present the height and width of the frams. The specifications of the structural models and the nomenclature used for each of them have been inserted in Table 1. The properties of the materials used in the structural elements have been summerized in Table 2. In this Table , , and are modulus of elasticity, yield stress, ultimate stress and concrete compressive strength, respectively.The structural models are shown in Fig. 1. The studied structures have been designed based on the uniform building code [13]. For this purpose, it has been assumed that the structures are located in the region 4 and the soil under the structures is type.
Table 1The specifications of the structural models
Story | MRF | SMRF | |
4 | 1.5 | MRF-4 | SMRF-4 |
12 | 1.5 3 | MRF-12 | SMRF-12 |
20 | 3 | MRF-20 | SMRF-20 |
Table 2Material properties
Material properties (Unit: kg/m2) | |
Steel | 2.0e10, 2.4e7, 3.6e7 |
Concrete | 2.3e9, 2.4e5 |
The static and nonlinear dynamic analyses of the structures have been carried out by the SAP software [14]. The - effects have been considered in the seismic analysis of the structures. Also, the moment-curvature nonlinear equation of the columns and beams, proposed by the FEMA-273 [15], are used to assign the nonlinear properties to the structural elements.
3. Analysis of the structural models
3.1. Incremental dynamic analysis
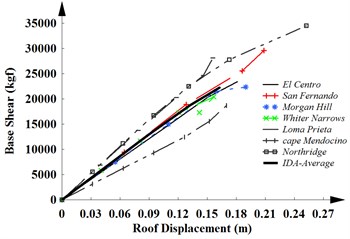
The nonlinear dynamic analysis has direct relation with the records of selected earthquakes. Therefore, it is very costly, time-consuming and non-economical. Because these issues, IDA has recently emerged in several different forms to estimate the seismic performance of structures under seismic loads. IDA is a parametric analysis method to perform a comprehensive assessment of the behaviour of structures subjected to earthquake excitations. It this method, the structural model is subjected to one (or more) ground motion record(s) which is (are) scaled to multiple levels of intensity. The results provide one (or more) curve(s) of response parameterized versus intensity level [16]. The dynamic pushover curve is obtained by depicting the maximum values of the base shear versus the maximum displacement of the structure (the target displacement) after every implementation of the analysis. This method displays the capacity and seismic behaviour of the structures. In this paper, In order to achieve more accurate results, the IDA of the structural models as an exact solution are carried out for seven earthquakes. The earthquakes used in the numerical simulations are El Centro (1940), San Fernando (1971), Morgan Hill (1984), Whiter Narrows (1987), Loma Prieta (1989), Cape Mendocino (1992) and Northridge (1994) earthquakes. The absolute peak ground accelerations (PGA) of these earthquak records are 0.313, 0.210, 0.224, 0.227, 0.417, 0.590 and 0.356, respectively. is the acceleration of gravity.
Fig. 1The studied structural models
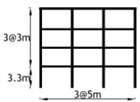
a) 4-Story frame
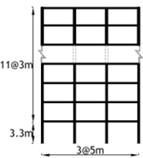
b) 12-Story frame
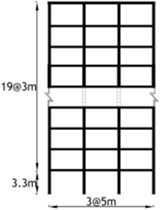
c) 20-Story frame
3.2. Pushover analysis
The nonlinear static analysis is accompanied by some estimations and simplifications. Therefore, there are some inaccuracies in the results of this method. The advantage of this method compared with the IDA is the lesser time of the analysis. The load pattern applied to the structure is one of the most important issues in the pushover analysis. There are many methods for determining the load pattern that each of them has led to acceptable results in some cases. Nevertheless, in some cases, the good results have not been obtained. The FEMA code suggests that at least two types of load patterns must be applied to the structures to reach more confidence level. This method has been described in different codes such as Eurocode8, SEAOC (1995) and ATC40. The uniform and triangular lateral load, recommended by the FEMA-356 [17] and the proposed lateral load are described in this Section.
Triangular lateral load pattern present the distribution of lateral load according to Eq. (2):
where is weight of the -th story, is the height of base level to the -th story, is the pseudo lateral load and is the fundamental period of the structure. Also, the lateral load have been considered as a ratio of the total structure mass in each floor in uniform lateral load pattern as presented in Eq. (3):
where is the mass of the -th story and is the pseudo lateral load. The suggested lateral load pattern is given by Eq. (4):
where is the height between the base and the -th story, is the total height of the structure. The is a constant which should be calculated according to the height of strcture and the type of the lateral resisting system. The suggested load pattern is a suitable representative of the two described lateral load patterns namely uniform and triangular lateral load patterns. Actually, it can provide every form of load pattern between them. By determine an appropriate value for the constant ; one can determine a suitable lateral load pattern for each structure. For this purpose, the capacity curve of the structure is depicted using the IDAs. Then the capacity curves of the structure from the pushover analysis are depicted using the presented lateral load pattern and with different values of . The curve which has more agreement with the structural capacity curve from the IDAs is selected and its corresponding value is used for next analyses of the same structures in terms of height and type of the lateral resistance system.
4. Results and discussion
In the first phase, the IDAs of the structural models subjected to seven earthquakes are carried out. The capacity curves obtained from these analyses are depicted. Then, the final capacity curve is obtained from the average value obtained from these curves. In the second phase, to investigate the accuracy and performance of the uniform, triangular and the proposed lateral load patterns in estimation of the seismic behavior of the structures, the capacity curve obtained from the results of the pushover analysis are compared with the capacity curve provided by the IDA-average.
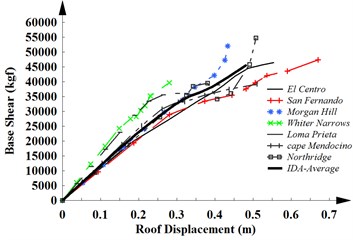
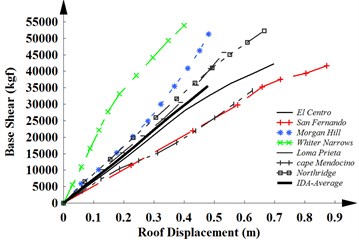
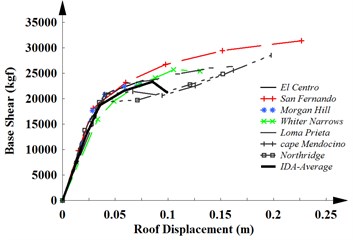
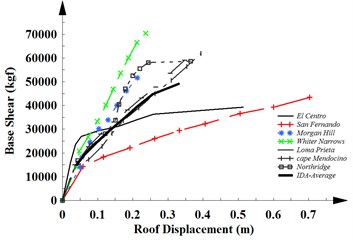
Fig. 2The capacity curves of a) MRF-4, b) MRF-12 and c) MRF-20 obtained from IDAs
a)
b)
c)
4.1. Steel moment-resisting frame
The capacity curves of 4, 12 and 20-story frames with MRF system obtained from the results of the IDAs for seven considered earthquakes and the average curve of them are shown in Fig. 2. The same results are obtained in the linear region for weak and medium earthquake. As can be seen, the capacity curve represents the global nonlinear response of structures subjected to strong motions. The stiffness of the structure is reduced in the nonlinear region. The ductility of structures is increased with increasing the height of the structures. In this case, they will experience large displacements.
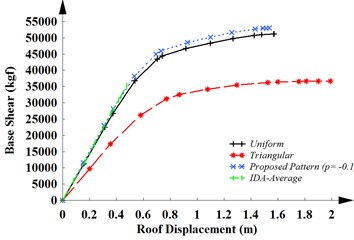
In order to consider the accuracy and performance of the uniform, triangular and the proposed lateral load patterns, the capacity curves obtained from the results of the pushover analysis are compared with the capacity curve provided by the IDAs. The results of this comparison for 4, 12 and 20-story frames are illustrated in Fig. 3.
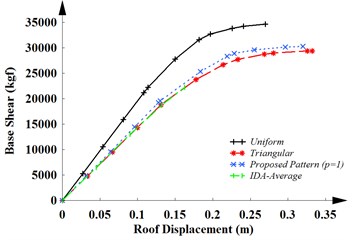
Fig. 3The capacity curves of a) MRF-4, b) MRF-12 and c) MRF-20 for three different load patterns and IDA-average
a)
b)
c)
Fig. 3(a) shows a good coincidence among of the capacity curves obtained from the triangular and the proposed load patterns ( 1) with the capacity curve obtained from the IDAs. The similar results are obtained in the linear and nonlinear regions. The uniform load pattern, especially in the nonlinear regions, isn’t an appropriate pattern for the structure. The result provided by the uniform load pattern shows that energy depreciation of the structure is more than its real value. Therefore, in the low-rise structures with low period, the triangular and the proposed lateral load pattern ( 1) are apposite load patterns to pushover analysis and estimate of the seismic behavior of the structures.
Fig. 3(b) indicates that the uniform load pattern recommended by FEMA and the offered lateral load pattern (0.1) provide more precise results compared with the triangular load pattern in the middle-period structures.
The capacity curves of MRF-20 for three different load patterns and IDA-average is shown in Fig. 3(c). This figure reveals that the uniform load pattern recommended by FEMA and the offered lateral load pattern (–0.1) provide more precise results in comparison with the triangular load pattern in the high-period structures. Therefore, this lateral load patterns can be used to estimate the performance level of the high-rise structures.
4.2. Concrete special moment-resisting frames
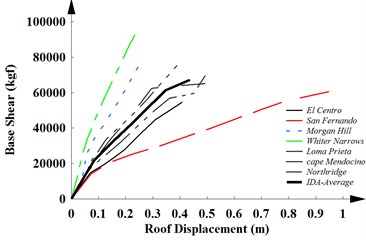
Considering seven earthquakes, the capacity curves of 4, 12 and 20-story frames with SMRF system obtained from IDAs and also the average curve of them are demonstrated in Fig. 4. Furthermore, in order to evaluate the accuracy and performance of the uniform, triangular and the proposed lateral load patterns in estimation of the seismic behavior of the structures, the capacity curve of pushover analysis are compared with the average capacity curve obtained from IDAs. Considering 4, 12 and 20-story frames, the results of this comparison are shown in Fig. 5.
Fig. 4The capacity curves of a) SMRF-4, b) SMRF-12 and c) SMRF-20 obtained from IDAs
a)
b)
c)
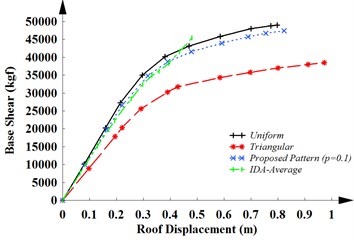
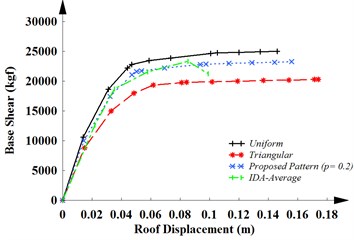
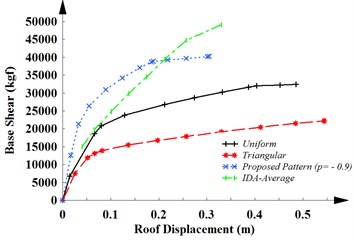
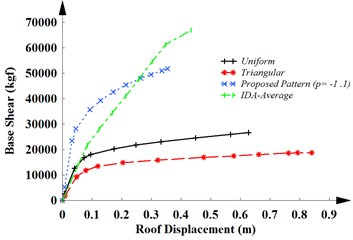
Fig. 5The capacity curves of a) SMRF-4, b) SMRF-12 and c) SMRF-20 for three different load patterns and IDA-average
a)
b)
c)
The capacity curves obtained from the suggested load pattern with 0.2 is shown in Fig. 5(a) for 4- story frame. This curve is located in the region between the pushover analyses with uniform and triangular distribution. Also, it can be seen that it has a good coincide with the capacity curve obtained from the IDAs. Furthermore, the results show that the uniform load pattern is a more appropriate pattern than the triangular pattern for the concrete low rise structure.
Considering 12-story structure, Fig. 5(b) illustrates a significant different between the capacity curves obtained from the pushover analysis of the structure using the triangular and uniform patterns recommended by FEMA. This figure shows that energy depreciation of the structure is smaller than its real value resulted from IDAs. In other words, these lateral load patterns aren’t appropriate lateral load patterns. However, the capacity curve resulted from the pushover analysis with the proposed lateral load pattern with –0.9 has a good coincided with the capacity curve obtained from the IDAs. Therefore, the proposed lateral load pattern can provide an accurate estimation of the seismic behavior of the middle-height structures with SMRF system.
The capacity curves of SMRF-20 for three different load patterns and IDA-average is shown in Fig. 5(c). This figure shows that the uniform and triangular load pattern recommended by FEMA give smaller energy absorption than the real value obtained from the IDAs. Thus, these lateral load patterns aren’t suitable lateral load patterns for the systems. The proposed lateral load pattern ( –1.1) provide more precise results compared with other lateral load pattern. Therefore, the proposed lateral load can estimate the performance level of the high rise structures. A summary of the simulation results is inserted in Table 3.
Table 3A summary of the simulation results
Number of stories | 4 | 12 | 20 | 4 | 12 | 20 |
1.5 | 1.5 3 | 3 | 1.5 | 1.5 3 | 3 | |
Nomenclature | MRF-4 | MRF-12 | MRF-20 | SMRF-4 | SMRF-12 | SMRF-20 |
The suitable load pattern recommended by FEMA | Triangular | Uniform | Uniform | Uniform | Not suitable | Not suitable |
The proposed load pattern () |
5. Conclusions
In the current paper, the accuracy and performance of the two lateral load patterns recommend in FEMA, the uniform and the triangular lateral load patterns, were compared with the reliable results of IDAs as an exact solution. Also, a new lateral load pattern was proposed. Considering the studies on the steel moment-resisting frames, the simulation results show that the triangular lateral load patterns are able estimate the ultimate capacity in the low- period structure and with the increase of the period, the uniform lateral load patterns are appropriate for lateral load distribution. Additionally, the results showed that the proposed load pattern has a good accuracy to estimate seismic behavior of the structures. The studies on the low-period concrete special moment-resisting frames indicated that the uniform load pattern proposed by FEMA is a suitable pattern for pushover analysis, but with increase of the period in these structures, the recommended lateral load patterns by FEMA cannot provide accurate results. However, the proposed load pattern indicated more accuracy. Therefore, the proposed lateral load pattern is suggested to assess of nonlinear behavior of structures.
References
-
Yang P., Li Y., Wang Y. A Study on Improvement of pushover Analysis. Journal of Building Structures, Vol. 1, 2000, p. 44-51.
-
Hosseini M., Yaghoobi F. Design verification of an Existing 8-Story Irregular steel building by 3-D Dynamic and pushover Analyses. 12th World Conference on Earthquake Engineering, New Zealand, 2000.
-
Chopra A. K., Goel R. K. A Modal pushover analysis procedure to estimate seismic demands for buildings: theory and preliminary Evaluation. PEER Report, Pacific Earthquake Engineering Research Center, College of Engineering Uninvesting of California Berkeley, 2001.
-
Chopra A. K., Goel R. K. A modal pushover analysis procedure to estimate seismic demands for buildings: theory and preliminary evaluation. Earthquake Engineering and Structural Dynamics, Vol. 31, Issue 3, 2002, p. 561-582.
-
Chopra A. K., Goel R. K. A modal pushover analysis procedure to estimate seismic demands for unsymmetric-plan buildings. Earthquake Engineering and Structural Dynamics, Vol. 33, Issue 8, 2004, p. 903-927.
-
Kalkan E., Kunnath S. K. Lateral load distribution in nonlinear static procedures for seismic design. Processing of the ASCE Structures, Nashville, TN., 2004.
-
Matsumori T., Otani S. H., Shiohara H., Asawa T. K. Estimation of the seismic demand in r/c frame structures using push-over analysis. 13th World Conference on Earth quake Engineering, Canada, 2004.
-
De-La-Colina J., Hernandez M., Acuna Q. Column interaction effect on pushover 3D analysis of irregular structures. 13th World Conference on Earth quake Engineering, Canada, 2004.
-
Abhilash R., Biju V., Leslie R. Effect of lateral load patterns in pushover analysis. 10th National Conference on Technological Trends, India, 2009.
-
Weixing L. A new lateral load pattern for nonlinear pushover analysis of high-rising rc frame-wall structures. International Conference on Mechanic Automation and Control Engineering, China, 2010.
-
Trica L., Chen L. The influence of lateral load patterns on the seismic design of zipper braced frames. Engineering Structures, Vol. 40, 2012, p. 536-555.
-
Khoshnoudian F., Kiani M., Yang T. Y. A new pushover procedure for two-way asymmetric-plan tall buildings under bidirectional earthquakes. Structural Design of Tall and Special Buildings, Vol. 23, Issue 14, 2014, p. 1097-1117.
-
International Code Council. Uniform Building Code (UBC), Vol. 2, 1997.
-
Computers and Structures Inc., SAP2000. Static and Dynamic finite element analysis of structures, Version 14, Berkeley, USA, 2001.
-
Federal Emergency Management Agency. FEMA 273, Washington D.C, 1997.
-
Vamvatsikos D., Fragiadakis M. Incremental dynamic analysis for estimating seismic performance sensitivity and uncertainty. Earthquake Engineering and Structural Dynamics, Vol. 39, Issue 2, 2010, p. 141-163.
-
Federal Emergency Management Agency, FEMA 356. Pre standard and Commentary for the Seismic Rehabilitation of Buildings, 2000.
About this article

