Abstract
In the era of embedded systems the qualifications of engines, machines and on-board vehicle devices into no-fault and fault categories on the basis of vibration signals is the process in conformity with the paradigm of pattern recognitions. The most popular way of looking for vibrodiagnostic features is based on frequency analysis and spectral properties of the observed signals. There is no doubt that the ‘a priori’ knowledge concerning objects being diagnosed is important in gathering information on technical states of mechatronic systems of vehicles. The diagnostic task of vehicle systems solved in the article was considered as the process realised according to properties of statistical signals originated from sensors of vibrations accelerations and not as searching for filtration algorithms of selective time-frequency properties. The data set originated from the observation of time series after angular resampling, without any transformations encompassing a frequency domain, was used in the selection procedure of diagnostic features. Orthogonal decompositions of subspace data matrices allowed to obtain the empirical model of the system. This fact was utilised for non parametric way of generating residual matrix, assessed in no-fault state as being ‘null’. The new non parametric way of diagnosing defects, on the basis of averaged first singular values of residuals determined for the investigated operation states, was also presented. The verified method allowed to perform the statistical analysis of the valve system of the SI engine, based on data originated from the single recording channel.
1. Introduction
Multi-domain character of mechatronic systems of vehicles creates several problems in the diagnosing processes of virtual subsystems on the basis of prototypes as well as in the on-line or off-line diagnosing during operations. New solutions based on the concept of obtaining diagnostic relations according to models or data, are continuously realised [1-3]. This approach is a consequence of more and more accurate monitoring of parameters of variables during operations. Models of dynamic systems are applied in simulations, controls and monitoring. The purpose – for which they are intended for – decides on their complexity. An assumption of an extended model, can cause that its identification for the diagnostics needs will be very difficult or just impossible.
The diagnostics method according to data, useful in case of the lack of the possibility of constructing the proper structural model or its excessive complexity to be applied in practice, will be proposed. This is the process, which requires the proper purpose definition, collecting, predicting, cleaning and normalisation of data, transformation of data, statistical selection of essential diagnostic features and decisions undertaking. An application of various linear and non-linear methods is used in data mining. Identification methods of dynamic models known from the control and systems theory [4-7], are applied in the diagnostic process, based on observations of input and output signals. Time series forecasting procedures include different techniques and models [8]. Projections between spaces determined by sets of signals eliminate correlations or statistical dependencies, providing the possibility of obtaining and putting in order the diagnostic features of the given system. These methods are applied in various practical applications [9-15]. This idea is used in the structural health monitoring (SHM) [16, 17]. The result of the vibroacoustic analysis constitute the modal model in a form of the natural frequencies set, damping ratios and mode shapes, utilised in various detection procedures of structure defects, based on these parameters [18].
Algorithms of diagnostics by subspace methods lead to determining the system pattern and residual assessed in the no-fault state as being ‘null’. There are two methods of preparing diagnostics on the bases of statistical residuals.
The first method of undertaking the decision on the defect detection on the basis of the values of residuals vectors is the realisation of the local approach to statistical analysis of changes in dynamic systems [19]. It is assumed that the distance between the tested models or measured experiments, represented by the error vector, is sufficiently small, if the observation set is large. Statistics of the diagnostic parameters constructed on the no-fault system observations constitute the basis for the null hypothesis formulation, which is tested against the alternative hypothesis corresponding to small deviations of the parameters values. If the system pattern is the observation consequence, its uncertainty is related to the data set value by the dependence and has the local character. These assumptions allow to transfer the problem of the system detection changes on the investigation plate of the expected value of the measured residual in the random vector form of the normal Gaussian distribution, in the no-fault state as well as during the further monitoring process. The analysis of two first components of the residual transferred into Taylor’s series expansion at using the limit theorems, leads to this conclusion [20]. Applying the generalized likelihood ratio method the rejection criterion of the verified hypothesis is obtained in the form of chi square test with the assumed critical level for the given confidence interval [21-23].
The non-parametric method of preparing diagnostics on the basis of the residual value assessment, applied in the presented study, utilises the null space analysis (NSA) [24]. Indicators of defects, based on their singular values are defined for the obtained residual matrices. The singular value decomposition (SVD) is the tool of several techniques of the vibrodiagnostic assessment of the technical state of rotating systems [25, 26]. Methods based on decompositions of orthogonal observation spaces, e.g. PCA and KPCA, were also applied in the proposed – up to now – solutions of vehicles vibration signals. However the classification of features, by means of averaged singular values of statistical residual matrices, were not carried out. Investigation of orthogonality of the left null subspace and image subspace of data matrix allows diagnostics, even when the observation originates from the only one measuring sensor.
2. Non-parametric method of the determination of statistical measures of defects detections
The algorithm of the residual generation of the monitored system requires transformations of original observations into the compact, precisely determined set of diagnostic features. Output matrices or input and output matrices of the measurement data must be properly defined in dependence of the fact whether observations concern only output signals (at assumptions that input functions are of a white noise character) or both input functions and output responses of the monitored systems. In the considered method of the signals transformation, the method of constructing the Hankel matrix of data originated from the transformation of the recorded output signals in successive sampling moments , when is the vector of signals from – measurement sensors, was applied.
If the covariance sequence of the output signals vector : , the Hankel matrix of data covariance for the selected constants and is defined by the equation:
where constant or –1 , when in the recorded measuring signals the white Gaussian noise of the expected value being zero is taken into account or when it is omitted, respectively. The empirical Hankel matrix can be determined on the bases of the covariance estimator:
The subject of considerations constitutes the method of looking for the residual of the system described by equations:
where is the state vector, is the response vector of values corresponding the th sampling moment, , and and represent white Gaussian noises of expected values being zero and covariance matrices: and taking into account the model uncertainty and measurement noise, respectively. The matrix pair or the system observability matrix enable the determination of modal parameters of the object.
For the system considered de facto as the ‘black box’, this method requires operations on matrices of the observation results but is independent of complex analyses and computer simulations leading to the determination of its eigenstructure. The construction of the system pattern is based on a direct utilisation of properties of the left null subspace of the Hankel observation matrix in no-fault state . This matrix meets the condition:
The method of non-parametric generation of residual on the bases of experimental data, requires SVD of the Hankel matrix of data covariance determined by:
where and are orthogonal matrices, and is the square diagonal matrix of – non-zero singular values of the Hankel matrix.
A correct determination of the square diagonal submatrix obtained as a result of the SVD, corresponding to the system order, is difficult and can cause masking of the residual deviations being the result of small changes in the system structure. The algorithm of the matrix residual generation using the active subspace (image) of the Hankel matrix and the left null space of this data matrix, allows to avoid this problem. Regardless of the selected system order, these matrices meet – in no-fault state – the condition:
The orthogonal matrix , determined on the bases of observations in no-fault state, acts as the system reference pattern. For such pattern the residual – in the form of the matrix of the observation subspaces product – is defined by the equation:
where is the active subspace of the Hankel matrix formed of systematically actualised data. The above residual uses a part of data originated from observations and can exhibit too high sensitivity in the defects diagnosing system. The performed simulations indicated that the residual of a lower sensitivity for the changes in observation sets can be obtained, when at its generation the expanded dependence Eq. (7) was used:
The residual matrix Eq. (8) is then in a form:
where is the Hankel matrix Eq. (6), of data systematically obtained due to the system monitoring.
Undertaking the diagnostic decision concerning the monitored object requires to build in the residual matrix the measure being the defect symptom. As this measure, which can be used in diagnostics procedures realised on-line, the index of defects detection defined by the averaged the Euclidean residual matrix norm was selected:
where , , are residual matrices determined on the basis of data recorded at the successive experiment cycles.
Matrices norms determined on the Euclidean norm bases of vector , i.e.:
are equal their highest singular values .
3. Realisation of experiments and diagnostics
Within the framework of the realised experiments leakages in the valve system of the SI engine were tested. Valve systems belong to the engine structure elements causing significant number of defects [3, 27-29].
Data originated from road tests of 4-cylinder engine of a capacity of 1.4 l and a mileage of 400,000 km, during driving on an express road with a constant load and rotational speed of 3000 rpm at a stable thermal state, were used in the verification of the proposed diagnostic method. Signals of vibration accelerations of the engine head in the vertical direction – were recorded from sensors mounted specially for the needs of experiments. The remaining signals originated from the sensor of the crank shaft angle of rotation and from the ignition system. The analysed results concern the following states occurring in the maintenance of exhaust valves:
Good technical state (no-fault category)
– Valve in a good working order, optimal clearance,
– Damaged state (fault category)
– Valve out of order: type 1 (small cut on the valve head), type 2 (big cut – 6 mm – on the valve head), optimal clearance,
– Valve in a good working order, decreased clearance,
– Valve in a good working order, increased clearance.
Each experiment (diagnostic test) generated a set of signals, which after an angular resampling contained 60 time series. Each time series, 3600 samples of vibrations acceleration, contained data recorded during 1 work cycle of the engine at the working conditions determined for the test. At each maintenance state a series of 50 experiments was performed and on their bases the set of patterns was selected.
The performed analysis indicates the algebraic way of constructing the empirical diagnostic model of the system in the state considered as no-fault state. In addition, it leads to the algorithm generating statistical residual matrix. The residual was defined with using the pattern in the form of the null subspace of the Hankel matrix of data in the no-fault state and subspaces of data obtained during observations of the object output signals. The final selection of diagnostic features, used in classifying the observed states is based on the SVD of the residual matrix.
Algorithm of the defects measure for the SI engine valve system
Step 1. To construct the Hankel matrix in no-fault state, according to Eq. (1).
Step 2. To determine the model of the system, based on data obtained in no-fault state:
Step 3. To construct the Hankel matrices , , in experiment cycles.
Step 4. To determine residual matrices , , in a form:
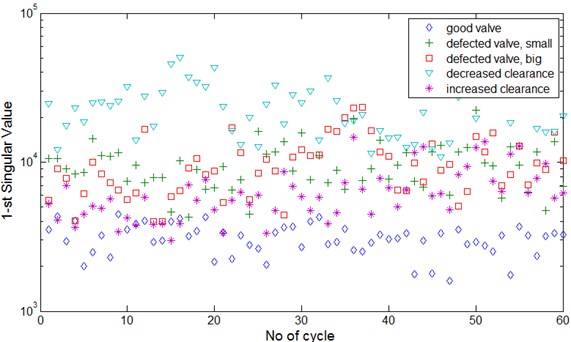
Step 5. To determine for the residual matrix , the largest singular values , .
Step 6. To determine the measure in a form of the averaged singular value of the experiment:
The results of the first five steps of the algorithm for the data recorded in 60 cycles of the engine work are presented graphically in Fig. 1.
Fig. 1The first singular value of the residual Resl, as a function of successive engine work cycles
The defect measure determined according to the 6-th step of the algorithm was used for the analysis of the observation results and identifications of the maintenance states. The sets of data examples obtained during the observations, on which bases the classification by the nearest neighbour method was performed, are graphically presented in Fig. 2.
The method of 5-times cross-validation was applied for the selection of the best classifier and for the accuracy estimation. The classification accuracy (separability coefficient) was defined as a ratio of the number of well classified experimental results to the total number of experiments. All tested states were separated.
Fig. 2Defect measure values (indicator) Res^ for no-fault state and simulated maintenance states of the engine valve system, as the function of successive experiments
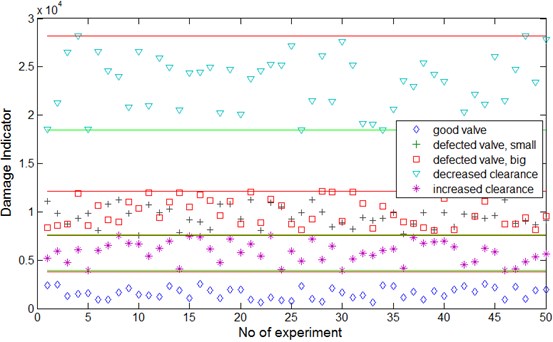
The highest classification accuracy (98-100 %) was obtained for the no-fault state and the system with a decreased clearance. Observations of the system with simulated valve defects and with an increased valve clearance indicated classification accuracy: 88-92 %.
4. Conclusions
The presented example of non-parametric vibrodiagnostics procedures based on the monitoring of vibrations accelerations signal, belongs to filtration algorithms realised according to statistical properties. This approach justifies the random character of the monitored signals, caused by internal wear processes as well as by disturbances accompanying measurements processes and external environmental disturbances. The proposed diagnostics methodology allows obtaining confirmations of early, masked changes of the state of the monitored objects, preceding the transfer of the system into the failure mode. The method was positively verified during the vibroacoustic monitoring of the valve system of the vehicle with spark ignition within the scope of defect detection and isolation. However, the presented results do not allow for the defect identification, it means its size determination.
References
-
Batko W., Dąbrowski Z., Kiciński J. Nonlinear Effects in Technical Diagnostics. Copyright ITE – PIB, Radom, 2008.
-
Cempel C. The evolution of generalized fault symptoms and fault intensities as indicators of observation redundancy and coming system breakdown. Mechanical Systems and Signal Processing, Vol. 25, 2011, p. 3116-3124.
-
Puchalski A., Komorska I. Application of vibration signal Kalman filtering to fault diagnostics of engine exhaust valve. Journal of Vibroegineering, Vol. 15, Issue 1, 2013, p. 152-158.
-
Ljung L. Recursive identification algorithms. Circuit Systems and Signal Processing, Vol. 21, Issue 1, 2002, p. 57-68.
-
Katayama T. Subspace Methods for System Identification. Springer-Verlag London Limited, 2005.
-
Huang B., Kadali R. Dynamic modeling, predictive control and performance monitoring. A data drive subspace approach. Springer-Verlag London Limited, 2008.
-
Isermann R., Münchhof M. Identification of Dynamic Systems. Springer-Verlag Berlin Heidelberg, 2011.
-
Palivonaite R., Ragulskis M. Short-term time series algebraic forecasting with internal smoothing. Neurocomputing, Vol. 127, 2014, p. 161-171.
-
He Q., Kong F., Yan R. Subspace based gearbox condition monitoring by kernel principal component analysis. Mechanical Systems and Signal Processing, Vol. 21, 2007, p. 1755-1772.
-
Borguet S., Leonard O. Coupling principal components analysis and Kalman filtering algorithms for on-line aircraft engine diagnostics. Control Engineering Practice, Vol. 17, 2009, p. 494-505.
-
Gould C. R., Bingham C. M., Stone D. A., Bentley P. New battery model and state-of-health determination through subspace parameter estimation and state-observer techniques. IEEE Transactions on Vehicular Technologies, Vol. 58, Issue 8, 2009, p. 3905-3916.
-
He Q., Yan R., Kong F., Du R. Machine condition monitoring using principal component representations. Mechanical Systems and Signal Processing, Vol. 23, Issue 2, 2009, p. 446-466.
-
Hu Y., Yurkovich S. Linear parameter varying battery model identification using subspace methods. Journal of Power Sources, Vol. 196, 2011, p. 2913-2923.
-
Burdzik R., Konieczny, Figlus T. Concept of on-board comfort vibration monitoring system for vehicles. Springer, Heidelberg, 2013, p. 418-425.
-
Konieczny Ł., Burdzik R., Figlus T. The possibility to control and adjust the suspensions of vehicles. Springer, Heidelberg, 2013, p. 378-383.
-
Uhl T. The use and challenge of modal analysis in diagnostics. Diagnostyka, Vol. 30, 2004, p. 151-161.
-
Farrar Ch. R., Worden K. An introduction to structural health monitoring. Philosophical Transactions of the Royal Society, Vol. 365, 2006, p. 303-315.
-
Mendrok K. Inverse Problem in Structural Health Monitoring. Copyright ITE-PIB, Radom, 2010.
-
Benveniste A., Basseville M., Moustakides G. V. The asymptotic local approach to change detection and model validation. IEEE Transactions on Automatic Control, Vol. AC-32, Issue 7, 1987, p. 583-592.
-
Basseville M., Benveniste A., Zhang Q. Towards the handling uncertainties in statistical FDI. 18th IFAC World Congress, Italy, 2011, p. 13203-13208.
-
Basseville M., Abdelghani M., Benveniste A. Subspace-based fault detection algorithms for vibration monitoring. Automatica, Vol. 36, 2000, p. 101-109.
-
Puchalski A. Detection of changes of the system technical state using stochastic subspace observation method. Advances in Science and Technology, Vol. 5, Issue 21, 2014, p. 13-17.
-
Yan A. M., Kerschen G., deBoe P., Golinval J. C. Structural damage diagnosis under varying environmental conditions –I, A linear analysis. Mechanical Systems and Signal Processing, Vol. 19, 2005, p. 847-864.
-
Yan A. M., Golinval J. C. Null subspace-based damage detection of structures using vibration measurements. Mechanical Systems and Signal Processing, Vol. 20, 2006, p. 601-626.
-
Yiang Y., Tang B., Qin Y., Liu W. Feature extraction method of wind turbine based on adaptive Morlet wavelet and SVD. Renewable Energy, Vol. 36, 2011, p. 2146-2153.
-
Kang M., Kim J. M. Singular value decomposition based extraction approach for classifying faults of induction motors. Mechanical Systems and Signal Processing, Vol. 41, Issue 1-2, 2013, p. 348-356.
-
Lotko M., Lechowski M. Variety areas of car engine faults as an indicator of their quality. Technika Transportu Szynowego, Vol. 10, 2013, p. 1023-1028, (in Polish).
-
Komorska I. Adaptive model of engine vibration signal for diagnostics of mechanical defects. Mechanika, Vol. 19, Issue 3, 2013, p. 301-305.
-
Puchalski A. Selected problems of technical diagnostics of vehicle mechatronics systems. Copyright ITeE – PiB, Radom, 2013, (in Polish).
About this article

