Abstract
This paper discusses the construction of a model of phononic crystals and the calculation of the band gap by the finite element method. The physical parameters on the band structure are studied in order to find the proper material suitable for a low frequency vibration. We investigate modal analysis, forbidden band gap characteristics, and the resonance mechanism of the crystal’s cavity. We compare the results of the experiments with those obtained for the phononic crystal cavity, such as the use of crystals on the roof or the floor. This study intends to make phononic crystal cavity applicable for engineers, especially in vehicles.
1. Introduction
Phononic crystals are composite materials constituted by a periodical repetition of two or more compounds with different elastic properties [1-3]. When the elastic wave propagates within the crystal structure, a special dispersion curve is formed as a result of its internal periodic structure. The dispersion relation between the frequency ranges of the curve is called the band gap. Acoustic or elastic wave propagation is inhibited or prohibited in this band gap, which can be designed through a change in the periodic structure and material of the crystal. Associated with the possibility of the existence of absolute band gaps, these materials have several potential applications, such as wave guiding, filtering, sound isolation and vibration damping [4-8]. It is for this reason that they have been gaining much attention over the past two decades. Phononic crystals have behavioral characteristics, such as periodic structures, high reflectivity performance with low loss, performance with the phase space compression, and stop bands [9].
There are two types of phononic crystals: Bragg scattering and locally resonant. For the Bragg type, the periodic scale and the magnitude of acoustic or elastic wave length are in the same order. Locally resonant phononic materials contain elastic resonators composed of a heavy core, called a scatter, surrounded by a soft coating. Liu et al. developed a locally resonant cycle of three-dimensional and three-component phononic crystal, which is composed of three materials, a matrix, a scatter, and the coating [10]. The lattice constant of locally resonant phononic crystals is two times smaller than that of Bragg phononic crystals, so it is suitable for controlling low- and medium-frequency noises. A number of experimental and theoretical studies have been carried out, thus proposing various applications.
Engineer applications of phononic crystals have gained attention recently. Dianlong Yu et al. studied the band gap and vibration reduction of the phononic crystal [11, 12]. Honggang Zhao et al. studied the absorptive properties of three-dimensional phononic crystal, proving that it is usable as an underwater anechoic material [13]. Zhizhong Yan studied the flexural vibration band gaps in periodic beams [14]. Shen Li et al. applied phononic crystal structure to the vehicle braking process, designing a two-dimensional air column and steel matrix system [15]. Some experts illustrated the current situation of studies like these in the field of vibration and noise control, particularly the anti-vibration and anti-noise of vehicles [16, 17].
In this work, we investigate the phononic crystal structural plate and study the effect of physical material parameters on the band gap. The cavity structure made of phononic crystal plate is established for use in engineering, especially in vehicle vibration and noise control. Firstly, the Finite Element Method (FEM) is applied to calculate the propagation of the phononic crystal structural cavity. Secondly, a specimen of the cavity is obtained to verify the band gap. Finally, we compare two arrangements, placing the phononic crystals on the roof of the cavity and the floor of the cavity.
2. The phononic crystal plate
2.1. Unit cell of phononic crystal
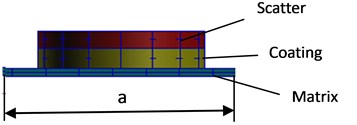
The unit cell of a locally resonant phononic crystal is composed of density high-density scatter, a matrix, and coating of elastically soft material. The distance between two neighboring scatters is referred to as the lattice constant a (Fig. 1(a)). Individual scatters produce resonations under the excitation of elastic waves in a certain frequency range. This causes interaction with incident waves, impeding the propagation. The formation of band gaps relies on the structure of individual scatters and their interaction with elastic waves.
2.2. Calculation of finite element method
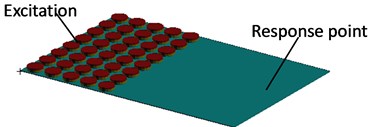
We calculate the band structures of the phononic crystal cavity using the finite element method. The geometric model of the phononic crystal plate is established with the basic unit cells, arranged in five rows along the direction, eight rows along the direction as Fig. 1(b).
Fig. 1The geometric mode of the phononic crystal: a) a basic structure unit of phononic crystal consists of scatter, coating and matrix, b) a geometric model of phononic crystal plate
a)
b)
The matrix made of aluminum has dimensions of 600 mm×400 mm×2 mm. The coating layer, which is 5 mm in thickness and 40 mm in diameter, is made of a silicone rubber with damping rate of 0.1. The steel resonators are 4 mm in thickness and 40 mm in diameter. The lattice constant is set at 50 mm, so the filling fraction is 0.8. The material parameters of the phononic crystal plate are shown in Table 1. The phononic crystal plate is free-standing, and the vertical excitations are mounted at the side closest to the vibrators. Responses are picked up in the other side as Fig. 1(b).
Table 1Performance parameters of materials
Materials | Density (kg/m3) | Elastic modulus (Pa) | Poisson’s ratio |
Steel | 7840 | 2.16e11 | 0.28 |
Silicone rubber | 1300 | 1.37e5 | 0.47 |
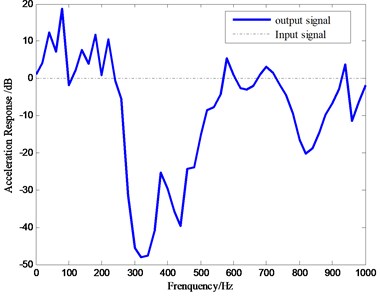
MSC. Patran software is applied to divide the finite element mesh of the phononic crystal plate. Different materials, like steel and silicone rubber, are connected in node equivalence when finite element model is established. The calculation is performed with Nastran software. The results of the propagation characteristic are as shown in Fig. 2. In the figure, there are two forbidden band gaps in the model. The frequency of the first band gap is from 240 Hz to 560 Hz, and the frequency of second one is from 710 Hz to 900 Hz.The attenuation is 45.2 dB at the frequency of 320 Hz and 28.8 dB at the frequency of 160 Hz. There is a strong peak in the attenuation for the frequency 240-560 Hz and the maximum attenuation is 60 dB, reached at 200 Hz.
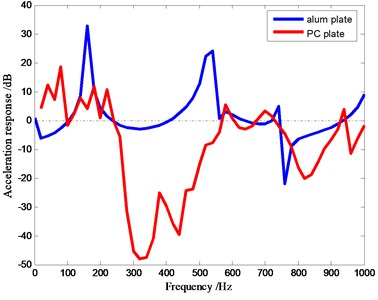
Fig. 2Acceleration response of the phononic crystal plate: a) acceleration response of a 5-cycle phononic crystal plate. There are two band gaps in the figure, b) the comparison of aluminum plates and phononic crystal plates
a)
b)
2.3. Analysis of factors affecting the band gap
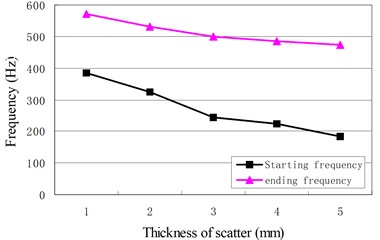
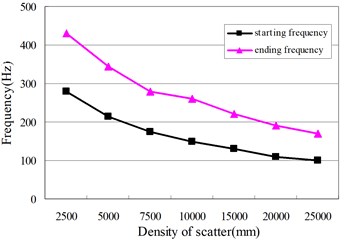
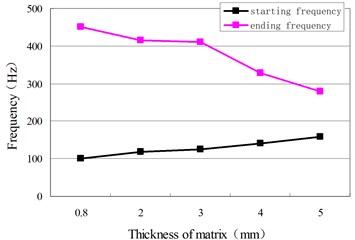
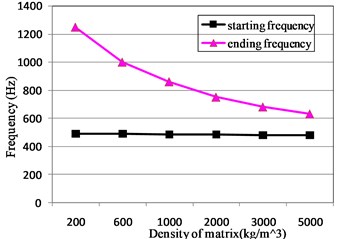
We keep scatter parameters constant, except for the thickness, in order to know its effect on the band gap. Similarly, the density of the scatter, the thickness of the scatter, and the density of the matrix are also taken as the only viable factor. The trends of the band gap of the phononic crystal plate can be seen in Fig. 3.
Fig. 3The factors affecting the band gap: a) the effect of the scatter’s thickness, b) the effect of the matrix’s density, c) the effect of the matrix’s thickness, d) the effect of the matrix’s density
a)
b)
c)
d)
As the density of the scatter increases, frequencies at the beginning and the end have declined, narrowing the bandwidth. The scatter with a large density would be more susceptible to low-frequency band gap characteristics. The band gap moves to a higher frequency if the scatter thickness decreases. As the density of the matrix increases, the frequencies as the beginning and the end decline, causing the bandwidth to decrease. The band gap becomes narrow if the thickness of the matrix increases.
Scatters affect band gap characteristics significantly. Larger bandwidth in low frequencies would be easier to acquire if scatters are made of dense materials like lead, copper and steel, whose magnitude of elastic modulus is 1010 Pa. A wider band gap range would be easier to obtain if the elastic modulus of coating layers are smaller. This is why silicone rubber, whose magnitude of elastic modulus is 106 Pa, is selected as the material for the coating layers.
In order to know the effect of the number of cycles of the resonator on bandwidth, the finite element method is applied to calculate the phononic crystal plate, arranged with resonates in three cycles, five cycles and twelve cycles along the direction. The excitation point and response point are as same as the former.
Fig. 4The effect of number of cycles on the band gap
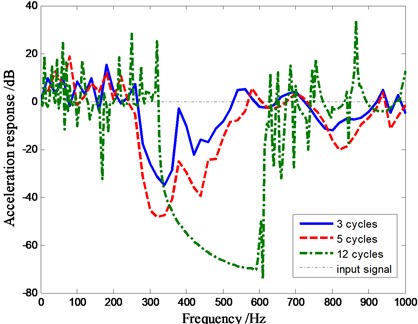
Fig. 4 shows that the effect of periodic structure along the direction on band gap. The initial frequency hardly changes when the number of cycles is three and five. The ending frequency increases slightly, while the attenuation increases greatly when the number of cycles increases. The magnitude of the attenuation decrease is 30 dB for three cycles of phononic crystal plate, and 70 dB for the twelve cycles’ plate. More cycles of phononic crystals arranged on the plate are good for creating a wide band gap when the elastic wave propagates within the plate. In fact, sometimes we need to consider other factors, which will affect the application of the crystals in the engineering field.
3. Vibration analysis of phononic crystal cavity
3.1. Modal analysis of cavity
Modality is a natural vibration characteristic of the mechanical structure. Each mode has a specific natural frequency, damping ratio and mode shapes.
In engineering, the control of the structural vibration is generally based on modal shapes. The main idea is to arrange the masses in the areas with maximum displacement, causing a suppression of the vibration with minimal energy. A geometric cavity is established to analyze the influence of the phnonic crystals on the cube.
The geometric model of the cavity (1000 mm in length, 800 mm in width, 500 mm in height, and 0.9 mm in thickness) is built from steel. The materials’ parameters are as follows: elastic modulus is set as 2.1×10¹¹ Pa, density as 7.8×10³ kg/m3 and Poisson’s ratio as 0.3. A modal analysis is conducted in order to determine the natural vibration characteristics of the cavity structure. A total of 473 modes are calculated in the frequency range of 0-500 Hz. There are 466 orders of modal after discarding six rigid modes. The parts of the modes are shown in Table 2.
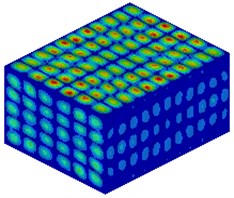
We only concentrate the roof of the cavity since the modes of the upper and lower surfaces of the cavity are the same. In Fig. 2(a), the frequency of a peak or a valley (such as 100 Hz, 220 Hz, 320 Hz and 380 Hz) is selected as an example to analyze the natural frequency of the cavity. It can be seen from vibration modes diagrams, like Fig. 5, that the side on the roof is the area with the maximum modal shapes.
Table 2Modal order and frequency (part)
Modal order | 1 | 2 | 3 | 4 | 5 | 10 |
Natural frequency (Hz) | 8.176 | 10.85 | 15.304 | 16.45 | 17.746 | 24.2 |
Modal order | 15 | 25 | 30 | 40 | 50 | 60 |
Natural frequency (Hz) | 31.35 | 45.53 | 51.84 | 61.82 | 75.78 | 85.057 |
Modal order | 70 | 80 | 100 | 125 | 150 | 200 |
Natural frequency (Hz) | 102.00 | 108.626 | 128.4 | 156.8 | 183.6 | 231.1 |
Modal order | 250 | 300 | 350 | 400 | 430 | 466 |
Natural frequency (Hz) | 285.1 | 335.7 | 385.1 | 431.8 | 459.4 | 499.6 |
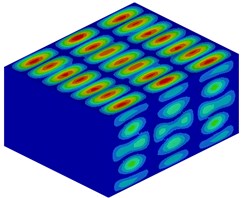
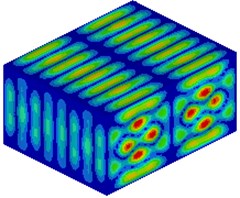
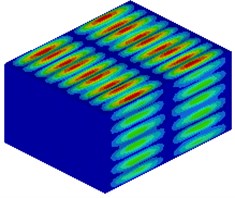
Fig. 5Modal shapes of the upper surface is in the region of 0-500 Hz (part). Figure a), b), d), f) are the frequencies of valleys according to the results of Fig. 2(a). Figure c), e) are the frequencies of peaks
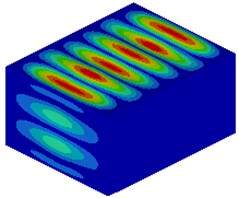
a) 100 Hz
b) 220 Hz
c) 252 Hz
d) 320 Hz
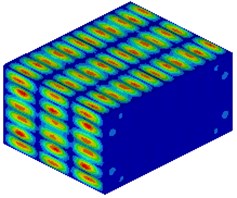
e) 380 Hz
f) 440 Hz
3.2. Analysis of propagation characteristic
A finite element model of the cavity is built, which is same as the geometric one. According to the results of the modal analysis of the cavity, the maximum vibrations occur on the surface’s sides, so the units of phononic crystals are arranged in a formation similar to that of an upside of the surface. Five-cycle basic units (Fig. 1(a)) made of silicone rubber and steel are arranged along the x direction and fifteen-cycle units are arranged along the y direction. The steel resonators are 4 mm in thickness and 40 mm in diameter. The silicone rubber is 5 mm in thickness. The lattice of phononic crystal is set at 50 mm and the filling fraction is 0.8.
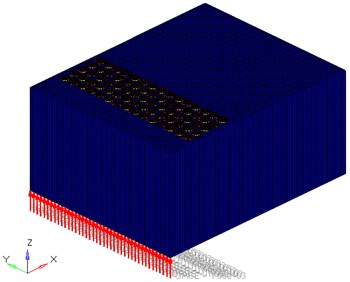
Node equivalence is adopted as the connection between the steel and the silicone rubber. The performance parameters of the materials are the same as before. The finite element simulation is carried out on the model of the phononic crystal cavity. The excitation is loaded onto the bottom of the cavity (Fig. 6). The magnitude of the force is 1000 N along the direction. Points (50, 400, 500) and (750, 400, 500) of the phononic crystal cavity are selected as the points of input and output signal respectively in order to analyze and compare.
Fig. 6Phononic crystal cavity model after FEM is divided. The red arrows represent the force (1000 N, z direction)
3.3. Results of FEM calculation
3.3.1. Phononic crystals arranged on the roof of the cavity
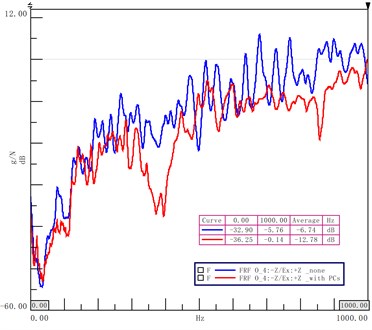
The phononic crystals are arranged on the roof of the cavity in the same manner as in Fig. 6. The signals of two types of cavities are compared at the output point (750, 400, 500). The finite element method is adopted and the material parameters are the same as the former. The results of the acceleration response can be seen in Fig. 7.
In Fig. 7, the red curve is the acceleration response without phnononic crystals, and the blue one is the response curve with phononic crystals. The first forbidden band gap is acquired between 170-210 Hz, and the second one is between 290-310 Hz. The attenuation for frequencies between 170 Hz and 400 Hz drops 10-20 dB. This diagram can illustrate that the acceleration response will decrease with the phnononic crystals on the roof of the cavity under the frequency of 500 Hz.
Fig. 7Comparison of transfer characteristic curves with phononic crystals arranged on the top
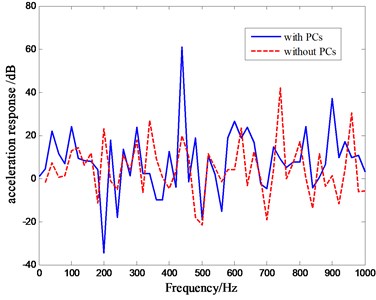
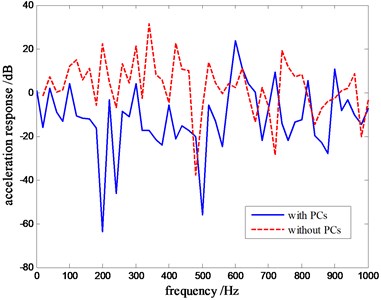
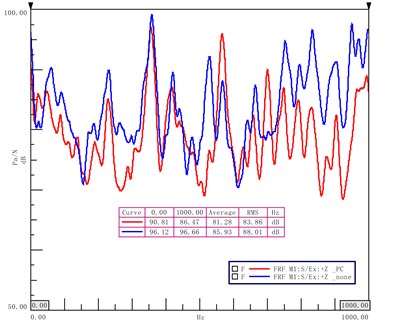
Fig. 8Comparison of propagation characteristic curves with phononic crystals arranged on the floor
3.3.2. Phononic crystals arranged on the floor the cavity
The simulation is done in the same way when the phononic crystals are arranged on the floor of the cavity. The results of acceleration response are as shown in Fig. 8.
There are two forbidden band gaps in the wave propagation when the phononic crystals arrange on the floor of the cavity. The range of the first band gap was 106.6-296.3 Hz while the range of the second band gap was 308-580.3 Hz. In the region below 500 Hz, the band gap decreased.
It can be seen from Fig. 8 that both the width and the attenuation increase. In the range of 106-508 Hz, the frequency of the band gap decreased significantly. There is a strong valley in the attenuation for frequency between 106 and 508 Hz, with the maximum attenuation of 60 dB at 200 Hz.
3.3.3. Noise analysis of phononic crystal cavity
The indirect boundary element method (BEM) is applied in the acoustic field of the phononic cavity. The acoustic BEM mesh of the cavity is built with Virtual.Lab software that is based on the finite element model. In the process of pretreatment, we see the fluid material properties, including its air (the density is 1.29 kg/m3). An acoustic field point within the cavity is selected to simulate the driver’s ear, and the acoustic pressure of the field point is calculated with the Virtual.Lab software. The acoustic pressure is shown in Fig. 9.
Fig. 9The pressure amplitude of the field point within the phononic crystal
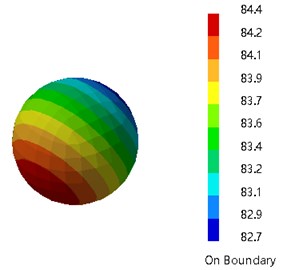
Fig. 10The comparison of phononic crystals and steel cavity at the acoustics response point
It can be seen from Fig. 10 that the acoustic pressure of a cavity with phononic crystals is lower than that of the ones without phononic crystals. In the ranges of 50-90 Hz and 120-150 Hz, the frequency of the band gap significantly decreases. There is a strong valley in the attenuation of the frequency between 50-90 Hz, and 124-144 Hz, with a maximum attenuation of 36 dB seen at 54 Hz.
4. The phononic crystal cavity experiments and specimen preparation
4.1. Specimen preparation and experimental setup
4.1.1. Specimen preparation
A sample cavity with the overall external dimensions of 1000 mm×800 mm×500 mm is made from steel. Choosing the same unit structure of phononic crystals as Fig. 1 builds a specimen of the phononic crystal cavity. The diameter of the steel cylinder and silicone rubber is 40 mm. The thickness is 4 mm and 5 mm respectively. The lattice constant is set 50 mm. The units are arranged in five cycles along the direction of the cavity, and in fifteen cycles in direction. The cavity surface is coated with silica gel in order to connect the silicone rubber and steel cylinder to it. The specimen is left alone for more than 24 hours.
4.1.2. Experimental setup
As is shown in Fig. 11, the experimental measurement and analysis system includes an excitation system, a phononic crystal cavity, a pick-up system and a data analysis and processing system. The excitation system contains of exciters, power amplifiers and force sensors. The acceleration sensors are used to detect the acceleration signal. LMS software test and analyzes the vibration acceleration signal as a function of the position. The list of the test instruments and equipment is shown as Table 3.
Fig. 11Experimental measurement and analysis system model diagram
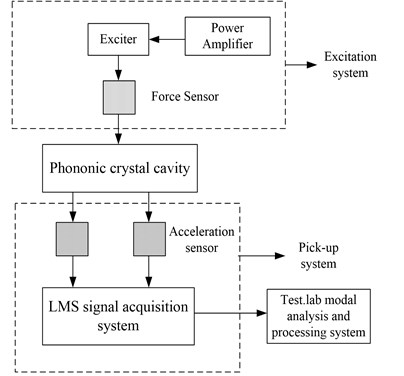
Table 3List of the test instruments and equipment
Item No. | Name | Model No. | Supplier |
1 | Signal generation module | LMS SCADASⅢ | LMS |
2 | Power amplifier | BAA120 | TIRA, Germany |
3 | Exciter | TIRA, Germany | |
4 | Force sensors | PCB, America | |
5 | Acceleration sensor | ICP | PCB, America |
6 | Intelligent acquisition system | LMS SCADASIII | LMS |
7 | Software | Test.lab 11A | LMS |
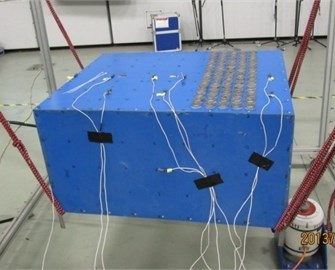
The broadband white noise signal is first generated from the signal generator module system, and becomes amplified by the power amplifier before driving the vibration exciter to generate a corresponding signal. As a result, the vertical vibration elastic wave can be excited on the phononic crystal cavity. Nine acceleration sensors are installed in different vibration signal acquisition positions, as shown in Fig. 12.
Fig. 12a) The phononic crystal cavity specimen consists of acceleration sensor, phononic crystals and exciter, b) the phononic crystal cavity in free standing hanging with rubber rope and LMS signal acquisition system
a)
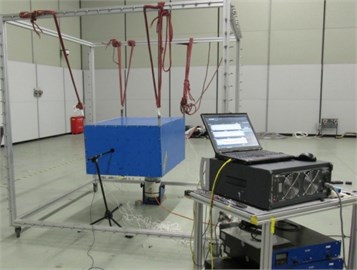
b)
In the experimental setup, the specimen is hung with four soft rubber ropes in order to guarantee its free boundary conditions. A noise excitation signal with a frequency range of 0 to 1000 Hz is excited on the bottom of the cavity at the coordinate (50, 4000, 0), while the acceleration sensors collect the signal for analysis and comparison.
4.2. The analysis of propagation characteristics
LMS SCADASIII SC316W software is adopted to analyze the signals of vibration acceleration sensors. The vibration propagation is obtained from the points on the upper surface of phononic crystal cavity. Test.lab 11A software is used to process the signal. For the purpose of practical utilization, we have studied the case of the phononic crystal cavity with excitation in the roof and the floor.
4.2.1. The phononic crystals arranged on the roof
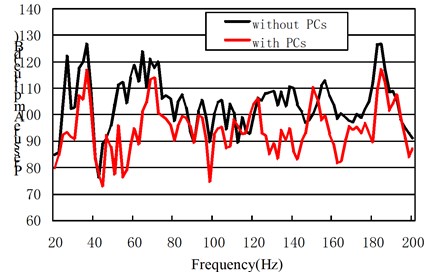
Let us first consider the case that the phononic crystals are arranged on the roof of cavity with 5 cycles along the direction and 15 cycles along the direction. The propagation characteristics of acceleration signals are shown in Fig. 13. The blue line represents the wave propagation of a cavity without phononic crystals, and the red line represents the wave propagation of cavity with phononic crystals. The average attenuation of the phononic crystal cavity is 5.42 dB. The attenuation is 3.1 dB, 11 dB, and 15 dB at the valley frequency of 103 Hz, 219 Hz, and 433 Hz.
Fig. 13Analysis of propagation characteristics of the roof's acceleration signals
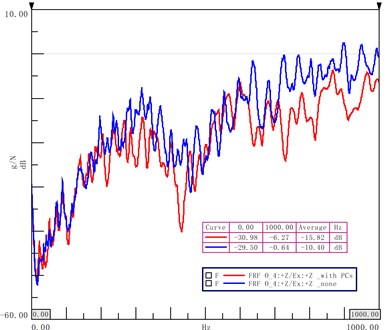
Fig. 14Analysis of propagation characteristics of the floor's acceleration signals
4.2.2. The phononic crystals arranged on the floor
When the phononic crystals are arranged on the floor of the cavity, there are 5 cycles along the direction and 15 cycles are along the direction. In Fig. 14, the blue line represents the wave propagation of a cavity without phononic crystals, and the red line represents the wave propagation of cavity with phononic crystals. The band gap exists between frequency of between 300 Hz and 480 Hz. The average attenuation of phononic crystal cavity is 6.04 dB in the region of 0 Hz-1000 Hz. The attenuation is 11 dB, 15 dB and 16.5 dB, at the frequencies 78 Hz, 188 Hz and 373 Hz.
4.2.3. Noise analysis of phononic crystal cavity
The acoustic pressure of the field points is shown in Fig. 15. The average acoustic pressure of the phononic crystal cavity is 4.65 dB in the range of 0-1000 Hz. The acoustic pressure decreased significantly in the frequency ranges of 50 Hz-132 Hz and 232 Hz-357 Hz. The attenuation is 16 dB at the low frequency of 527 Hz.
Fig. 15The comparison of the acoustic pressure of phononic crystals cavity and steel cavity
5. Conclusions
In this work, the band gap characteristics of locally resonant phononic crystals are applied to anti-vibration of the cavity. According to the damping characteristics of phononic crystal plates, the units are arranged at the roof and floor of the cavity, with 5 cycles in the direction and 15 cycles in the direction.
Attenuation can be obtained between 33.4 Hz and 580.3 Hz. Contrastive analyses were made based on the two states: steel cavities and crystal cavities. The band gap of the phononic crystal cavity is calculated with Finite Element Method. The comparison of phononic crystals and original cavity is made at the acoustics response point.
A specimen of the phononic crystal cavity was built.The propagation curves of the acceleration of phononic crystals on both the upper and lower surfaces were obtained. As the analysis showed,the average frequency of phononic crystals decreased by 5.42 dB and 6.04 dB respectively. The average acoustic pressure of phononic crystals decreased by 4.65 dB.
The present work provides evidence that a phononic crystal, as a metamaterial, has properties that allow it to be used in the field of noise-control. It is also can be made a phnononic crystal products used in engineering field by choosing the materials and the dimensions.
References
-
Yablonobitch Eli Inhibited spontaneous emission in solid-state physics and electronics. Physical Review Letters, Vol. 58, 1987, p. 2058-2062.
-
Kushwaha M. S., Halevi P., Dobrzynski L. Acoustic band structure of periodic elastic composites. Physical Review Letter, Vol. 17, 1993, p. 2022-2025.
-
Sigalas M. M., Economou E. N. Band structure of elastic waves in two-dimensional systems. Solid State Commun, Vol. 86, 1993, p. 141-143.
-
Jensen J. S. Phononic band gaps and vibrations in one- and two-dimensional mass-spring structures. Journal of Sound and Vibration, Vol. 266, 2003, p. 1053-1078.
-
Hirsekorn Martin Small-size sonic crystals with strong attenuation bands in the audible frequency range. Applied Physics Letters, Vol. 84, 2004, p. 3364-3366.
-
Vaseurt J. O., Djafari-Rouhani B., Dobrzynski L., et al. Complete acoustic band gaps in periodic fibre reinforced composite materials: the carbon/epoxy composite and some metallic systems. Journal of Physics: Condensed Matter, Vol. 6, 1994, p. 8759-8770.
-
Martinez-Sala R., Sancho J., SanchezJ. V., et al. Sound attenuation by sculpture. Nature, Vol. 378, 1995, p. 241.
-
Yilmaz C., Kikuchi N. Analysis and design of passive band-stop filter-type vibration isolators for low-frequency applications. Journal of Sound and Vibration, Vol. 291, 2006, p. 1004-1028.
-
Wen Xisen, Wen Jihong, Yu Dianlong, et al. Phononic Crystal. National Defense Industry Press, Beijing, 2009.
-
Zhengyou Liu, et al. Elastic wave scattering by periodic structures of spherical objects. Theory and Experiment. Physical Review B, Vol. 62, Issue 4, 2000, p. 2446-2457.
-
Yu Dianlong, Liu Yaozong, Qiu Jing, et al. Complete flexural vibration band gaps in membrane-like lattice structures. Physics Letters A, Vol. 357, 2006, p. 154-158.
-
Yu Dianlong, Wen Jihong, Zhao Honggang, et al. Vibration reduction by using the idea of phononic crystals in a pipe-conveying fluid. Journal of Sound and Vibration, Vol. 318, 2008, p. 193-205.
-
Zhao Honggang, Liu Yaozong, Yu Dianlong, et al. Absorptive properties of three-dimensional phononic crystal. Journal of Sound and Vibration, Vol. 303, 2007, p. 185-194.
-
Yan Zhi-Zhong, Zhang Chuanzeng, Wang Yue-Sheng Attenuation and localization of bending waves in a periodic/disordered four fold composite beam. Journal of Sound and Vibration, Vol. 327, Issue 1, 2009, p. 109-120.
-
Shen Li, Wu Jiuhui, Chen Hualing Theory and application of phononic crystal structure in vehicle braking noise. Journal of Applied Mechanics, Vol. 27, Issue 2, 2010, p. 293-297.
-
Zhao Shu’en, Li Yinong, Zheng Ling, Xie Minsong Phononic crystals and automotive noise and vibration control. Materials Review, Vol. 21, Issue 4, 2007, p. 84-86.
-
Jin Xiaoxiong, Shao Jianwang, Peng Wei Vehicle interior noise study based on phononic crystals. Vibration and Shock, Vol. 28, Issue 12, 2009, p. 107-109.
About this article

