Abstract
Increasingly ancient ruins are subjected to higher levels of vibrations induced by rail due to urbanization. In this way, to better understand and preserve ancient ruins against train-induced vibrations, vibration measurements and FE analysis were conducted on the Hangu Pass, Luoyang, China, located adjacent to the Longhai railway line. Firstly, damage descriptions of the Hangu Pass are conducted, and train-induced vibrations were recorded at several points on the ground and the ruin. Then, attenuation characteristics of vibration in the ground and on the ruin were examined. Secondly, based on the FE analysis, the stress distributions of the Hangu Pass are present when the train crossed the nearby railway line. The results showed that the maximum stress distribution from the result of the FE analysis is similar to crack distribution of the Hangu Pass, which confirmed that the train-induced vibration is a significant factor to deteriorate the Hangu Pass. Thirdly, in order to protect the Hangu Pass against train-induced vibrations, an anti-vibration system, isolation trench, is introduced. The FE model of the Hangu Pass with isolation trench is established. The effect of the trench’s width, depth, location and filling materials on decreasing the train-induced vibrations of the Hangu Pass are studied. The results showed that the set isolation trench can protect the ancient ruin against environmental vibration.
1. Introduction
In recent years, there is a fast development of railway traffic, with the development of economics. The effect of environmental vibration caused by railway traffic, however, is not ignored [1]. The harm of environmental vibration induced by railway on historic building is obvious, such as small crack on the wall, etc. Consequently, some researches about influences of vibration from railway traffic on nearby buildings have been done by many scholars, such as: Sanayei et al. [2] measured and predicted the train-induced vibrations in a full-scale building. Costa et al. [3] analyzed track ground vibrations induced by railway traffic in-situ measurements and validation of a 2.5 D FEM-BEM model. Some FEM Analysis of vibration for buildings are conducted to draw our attentions [4-6]. Also, some investigations on isolation trench which is used to reducing the vibration induced by train have been done. For example, Kawamura et al.[7] have proposed a new type of vibration isolation measures which is combined with ground groove and dynamic damper. Kuma et al. [8] have studied the damping effect of isolation trench which is filled with water. And other researches on reduction of railway-induced vibration for different isolation trench [9-12].
The most part of those researches are mainly focus on the influence of ancient buildings [13] rather than ancient ruin affected by induced vibration of moving trains. However, the most part of ancient ruin are Cultural Relics Protection Unit, which locate near road traffic because of the demand of economic development. Such phenomenon has more and more influential in the ancient ruin. Thus, it is necessary to study those effects. The main subject of study for this article is Hangu Pass, started to be built in 114 BC, was one of the most important juncture of the Silk Road. Hangu Pass has been destroyed and rebuilt several times during the past 2000 years when wars broken out frequently, and the last time to repair was in 1923. As a part of the Silk Road Project, Hangu Pass was declared world cultural heritage in 2007. In addition, it was announced the seventh batch of national key cultural relics protection units by the State Council in May 2013. Because of the influence of characteristics of structure’s material, the changes of natural environment, the continuous vibration induced by adjacent Longhai Railway and other factors, many different parts of strategic Hangu Pass has broken down or cracked; doorway, observation tower, Cock station already have collapsed, as is shown in Fig. 1. As Hangu Gate Pass is close to Longhai Railway line, the effect of continues vibration is more and more obvious when trains’ speed has grown steadily in recent years. The reinforcement measures made by related departments can hardly reduce the influence of train vibration on Hangu Pass. It is not possible to adopt the method of the foundation of vibration isolation to protect ancient ruins; the feasible solution is to reduce vibration by setting the isolation trench between the fort and the Longhai railway.
The study of this article mainly focuses on three aspects. Firstly, the situ measurement and analysis were carried out to investigate the influence of environmental vibration induced by railway on the surrounding historic buildings-Hangu Pass in Luoyang. Some meaningful results have been obtained from the measured data. Secondly, calculating the filtering effect of soil layer of city wall in the condition of white noise excitation by using three-dimensional dynamic finite element program established by finite element analysis software ABAQUS through the external subroutine VDLOAD to compare the distribution of vibration spectrum which is measured to verify the correctness of this model; At the same time, the stress distribution and destruction of all parts of Hangu Gate Pass are calculated under the condition of the train through by 120 km/h and the effect of Common Earthquake to doorway. Lastly, with the help of the finite element software ABAQUS to establish the fort and the isolation trench model to analysis the reducing vibration effect of vibration isolation trench which have different width, depth, location and the filling material of the isolation trench on Hangu Pass from the view of stress distribution. This paper also gives a design suggestion on isolation trench whose function is protecting the ancient ruin.
2. In situ measurement of vibration for Hangu Pass
2.1. Damage description of Hangu Pass in Luoyang
Hangu Pass (Fig. 1), dating back to the 114 B.C. and, is characterized by the presence of major cracks and partial collapse on the walls, as follows:
1) The wall surrounding the pass collapsed severely (Fig. 1).
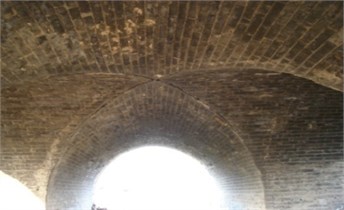
2) Internal cracks (Fig. 2).
3) Cracks in stone masonry (Fig. 3).
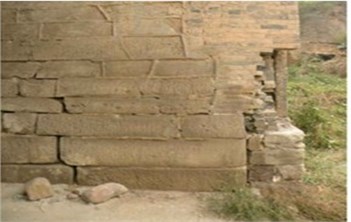
4) Collapse at the corner of wall (Fig. 4).
Fig. 1The train passed though Hangu Pass
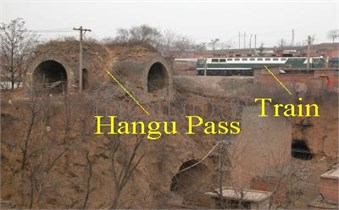
Fig. 2Internal crack
There are many reasons inducing the damage of Hangu Pass, such as the Long-term exposure to the sun and rain, man-made destruction, etc. However, environmental vibration around Hangu Pass is also the significant reasons, which is induced by Longhai Railway constructed in 1952 completely (Fig. 1). Hence, the experimental research is carried out to assess the influence of environmental vibration on Hangu Pass.
Fig. 3Cracks in stone masonry
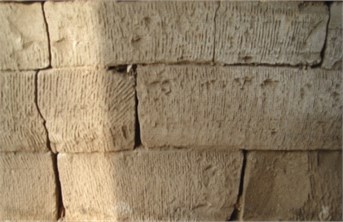
Fig. 4Collapse at the corner of wall
2.2. Environmental vibration testing and data processing method
Due to the restriction of site condition, environmental vibration measurements were conducted on the pass at the beginning of October 2010 to measure the dynamic response only at four different points.
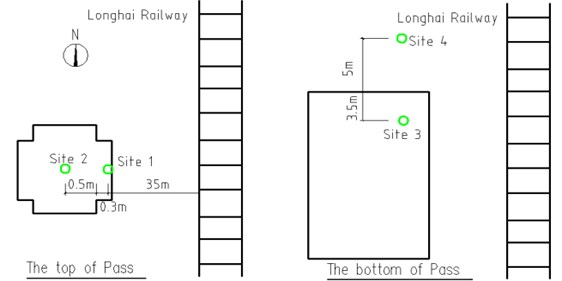
Fig. 5 shows a schematic representation of the sensor layout. Two sensors are located at the top of the pass and others at the bottom of the pass.
Fig. 5The sensor layout
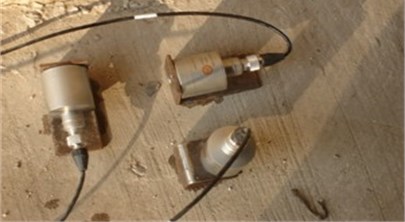
The tests were conducted using a 16 channel data acquisition system with uniaxial B&K-8340 sensors (Fig. 6); these sensors allowed acceleration responses to be recorded. The measurement method is according to the national standard GB10071-88 [14]. The measuring instruments include the PUSLE manufactured by the B&K co. ltd.
Fig. 6B&K-8340 accelerometers
According to the GB10070-88 – Standard of Environmental vibration in urban area, the vertical vibration levels are calculated on the basis of:
where is the vibration levels in dB and is the reference acceleration, 10-6 m/s2. (m/s2) is based on the ISO2631/1-1985, which is modified accelerations according to different weighting factors (National Environmental Protection Agency, 1988) [17].
Based on GB/T50355-2005- Standard of Limit and Measurement Method and Vibration in the Room of Residential Buildings [15], the vertical vibration levels at each band of 1/3 Octave are calculated according to the following formula:
where is the vibration levels at each band of 1/3 Octave in dB and is the reference acceleration, 10-6 m/s2. is the effective accelerations at each band of 1/3 Octave.
2.3. Environmental vibrations at the bottom of the pass
Wholly, 5 groups of measurements were conducted. The vertical vibration levels when the train passed are shown as T1, T2, T3, and T4. B0 indicated the background vibration. The vibration levels of the ground according to GB10070-88 at site 1 and site 2 were obtained from the measurement, which are listed in Table 1. The measured vertical vibration levels at each band of 1/3 Octave are shown in Fig. 7 and Fig. 8.
Fig. 7The vertical vibration level at each band of 1/3 Octave in site 1 at the bottom of the pass
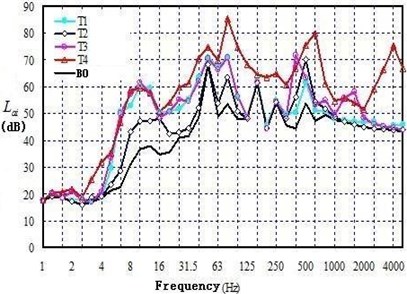
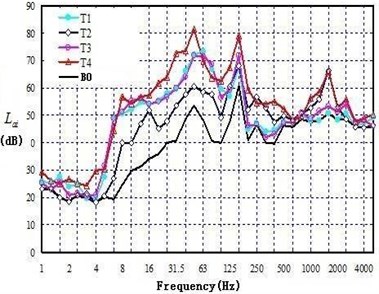
Fig. 8The vertical vibration level at each band of 1/3 Octave in site 2 at the bottom of the pass
From Table 1 and Figs. 7-8, some qualitative inferences can be drawn:
1) According to the GB10070-88 – Standard of Environmental vibration in urban area, the vertical vibration level at the bottom of pass was not over the limit near the railway.
2) In Figs. 7-8, according to the GB/T50355-2005-Standard of Limit and Measurement Method and Vibration in the Room of Residential Buildings, however, the vertical vibration levels at a specific band of 1/3 Octave was over the limit, but it is not very obvious.
3) In Figs. 7-8, the maximum vibration difference at a special band of 1/3 Octave between the background vibration and normal measured vibration is 30 dB, which indicated the influence of environmental vibration on the Hangu Pass is significant.
4) At site 1, the max vertical vibration is 85 dB happened at 80 Hz band of 1/3 Octave. At site 2, the max vertical vibration is 82 dB happened at 50 Hz band of 1/3 Octave.
2.4. Environmental vibrations at the top of the pass
Due to the channel connecting site 2 damaged, the measured vibration at site 1 is discussed only.
Wholly, 4 groups of measurements were conducted. The vertical vibration levels when the train passed are shown as T1, T2, and T3. B0 indicated the background vibration. The vibration levels of the ground according to the GB10070-88 at site 1 were obtained from the measurement, which are listed in Table 2. The measured vertical vibration levels at each band of 1/3 Octave is shown in Fig. 9.
Table 1Vertical vibration level at the bottom of the pass
Conditions | T1 | T2 | T3 | T4 |
Site 1 | 63.2 | 54.9 | 63.8 | 68.3 |
Site 2 | 62.0 | 52.2 | 62.0 | 68.5 |
Table 2Vertical vibration level at the top of the pass
Conditions | T1 | T2 | T3 |
Site 1 | 76.8 | 75.2 | 82.3 |
From Table 2 and Fig. 9, some qualitative inferences can be drawn:
1) Comparing Table 1 and Table 2, the influence of environmental vibration induced by Longhai railway on the top of pass is more significant.
2) From Table 2, the vertical vibration level at site 1 is over the limit set by the GB10070-88 – Standard of Environmental vibration in urban area.
3) In Fig. 9, the maximal background vibration level at 40 Hz band of 1/3 Octave is 43 dB, however, the ground vibration level at 40 Hz band of 1/3 Octave is 92 dB. These date indicated that the environmental ground vibration has great influence on the top of Hangu Pass.
Fig. 9The vertical vibration level at each band of 1/3 Octave in Site 1 at the top of the pass
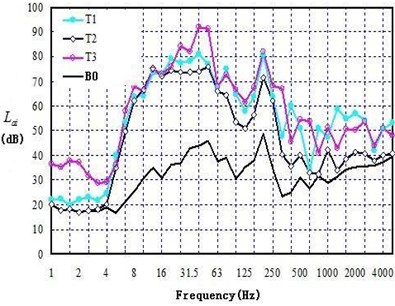
Table 3Management values of railway geometric-regular condition (GB)
Control condition | Wavelength (m) | Versing (mm) |
Running stability | 50 20 10 | 16 9 5 |
Additional dynamic load | 5 2 1 | 2.5 0.6 0.3 |
Loss of waveform | 0.5 0.05 | 0.1 0.05 |
3. FEM analysis of vibration for Hangu Pass
3.1. Load input
A large number of theoretical study and experimental work over the years from British Rail Technology Center show that the vertical force of train wheel is mainly caused by various irregularities and local flat scar around wheels [16].
Train load can be simulated by an Exciting Force function, including the static load and dynamic load which is overlapped by a series of sine function [17, 18]. In this paper, the wheel/ track interaction-train load-is simulated by the exciting force which can reflect the track irregularity, the additional dynamic load and the rail surface wave grinding effect. The expression is below [19]:
In this formula, means static load of wheels, , , and means the vibration load corresponding to typical value in control standard I, II, and III, which is shown in Table 1. is relation with the weight of train. Assuming the unsuspended weight of locomotive is , the calculation formula of is as below [22]:
In this formula, means vector height corresponding to typical value in control standard I, II, III, which is shown in Table 1; V means the speed of train; means wavelength corresponding to typical value in control standard I, II, and III, which is shown in Table 3 [19].
For the high speed railway, the unilateral static weight of wheel – is 80 kN; the unsuspended weight of locomotive – 750 kNs2/m; it is better to choose high standard corresponding to typical value in control standard I, II, and III, respectively, the irregularity wavelength and the corresponding vector height value is: 10 m, 5 mm; 2 m, 0.6 mm; 0.5 m, 0.1 mm.
The case of exciting force when 120 km/h is shown in Fig. 10.
Fig. 10The relationship of exciting force and time
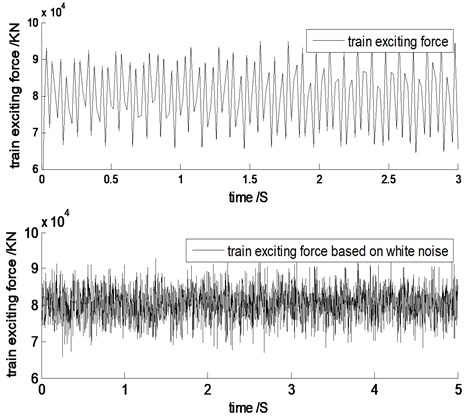
Meanwhile, for compare with the measured data and study the filtering effect of doorway wall soil, the white noise whose spectrum is ranging from 0-250 Hz has been constructed, which is transformed into the time-history curve of exciting force for train applied to the track, as shown in Fig. 10.
3.2. The finite element model
The ABAQUS calculated finite element model of Hangu Gate Pass is shown in Fig. 11. Three-dimensional solid unit (C3D8R) is utilized to simulate brick and soil unit in this model. The north-south length of Hangu Gate Pass’s rammed soil walls is about 150 m. The calculated rang of this model is determined according to Yang Yongbin’s [20] suggestion that model’s length is 1-1.5 times of shear wavelength, as is shown below:
Among them, means shear wavelength, means shear wave velocity, means frequency. The maximum of shear wave velocity for Hangu Gate Pass filling soil is 212 m/s [22], the lowest frequency environmental vibration interested is 5 Hz, the shear wave length is 43 m. As a result, making doorway as center, the length of model’s left part is 15 meter, and the right is alone to railway, which is 53 m from south to north totally. Literature [21] argues that when the cell size is 1/6 times of shear wavelength, this result can get enough precision. So the frequency of structure vibration induced by train is below 50 Hz, so, the cell size is 0.7 m. The boundary of two sides of model is viscous spring boundary, and the bond slip of contacted brick and soil is not considering.
The train load in the speed of 120 km/h is applied on model rail established by finite element model by ABAQUS subroutine VDLOAD, as is shown in Fig. 13. The parameters of model are based on the test results of ‘Geotechnical Investigation Report of Xin-an Country Hangu Pass site restoration in Luoyang’ [22], the material properties to calculate this model are shown in Table 4.
Fig. 11FE model and Layout monitoring points
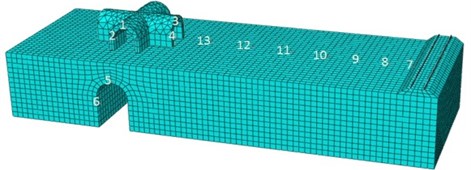
Table 4Parameters of FE model
Materials | Elasticity modulus / MPa | Density / kg/m-3 | Poisson‘s ratio |
Rammed soil | 8.64 | 1550 | 0.3 |
Wall brick | 22.02 | 2200 | 0.17 |
3.3. The calculation results and analysis
3.3.1. The filtering effect of soil layer and model verification
The white noise is taken into account as load, the Fourier spectra of finite element model in the point of SET-8 and SET-12 is shown in Fig. 12. The illustration shows that the frequency components of Fourier vibration spectrum in three direction are abundant, including high frequency, middle frequency and low frequency, and major responses are mainly focused on about 40 Hz, and the response of (vertical) is most obvious in the distance of 2 m from the rail (SET-8). Comparing with the measured vibration Fourier spectrum of measuring point in the distance of 30 m (SET-12) shows that the response amplitude decreased substantially, and spectral components of near 30 Hz decreased obviously due to the filtering effect of soil layer, the major responses frequency of structure are between 16 Hz-50 Hz, and (vertical) response is most obvious, which consistent with the measured results from the literature [23]. As a consequent, the correctness of the finite element program was verified.
3.3.2. Stress distribution and damage of Gate Pass under load of train
The Fig. 13(a) shows the typical stress distribution situation of trains passing Hangu Gate Pass at one given point. From Fig. 13, stress at the moment of train passing mainly concentrates on both doorway arch of Hangu Gate Pass and the bottom of the arch of the second floor of Gate Pass.
Fig. 12Fourier spectra of points in three directions
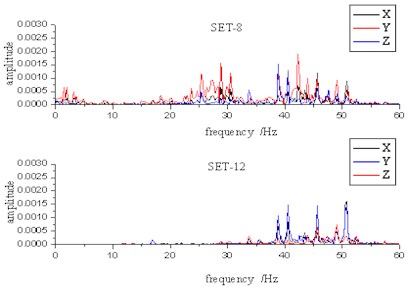
Fig. 13(b) illustrates the distribution of actual crack of Hangu Gate Pass. Comparing with stress distribution in Fig. 13(a), the doorway and the second floor arch which are stress concentration areas generate hoop cracks. Such phenomenon indicates that the maximum stress distribution from the result of the finite element analysis is similar to crack distribution of Hangu Gate Pass. Vertical crack can be seen in wall basement. The direction of crack distribution, which perpendiculars to that of train movement, is the weakest forced direction in brick donor. Consequently, the vibration of train movement direction ( direction) likely exerts a deteriorating effect on the Hangu Gate Pass crack. As the continual increases in frequency of vibration, velocity, loads of trains, this effect will enhance.
Fig. 13Illiustration of the distribution of actual crack of Hangu Gate Pass
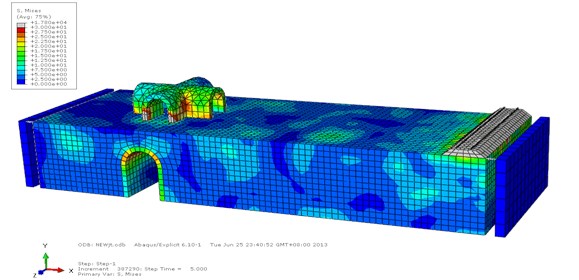
a) The Mises stress’s distribution under train load
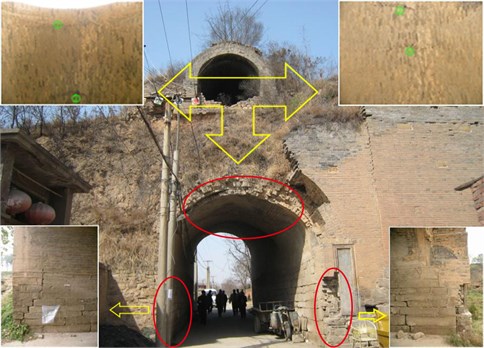
b) The distribution of the crack of the doorway
In contrast with Fig. 14(a), (b), normal stress, which is also the direction of train movement, largely concentrates on both the bottom of second floor arch and the top of doorway arch, so the vibration of the train movement direction has a vital effect on the development of crack in Gate Pass.
As without being repaired for many years, part of the Hangu Gate Pass is damaged, which changes the doorway structure forced stress. Brick masonry of the donor is in press condition which benefits to the overall stability of the structure. Collapse brings about stress redistribution, which reduces the overall stability of the structure. Under the premises of the train frequent load effect and the increases of loads and velocity of trains, induced stress of trains vibration concentrates on and extends the existing crack areas until new destroy emerges.
Fig. 14Illiustration of the distribution of the stress and crack in the Z’s direction
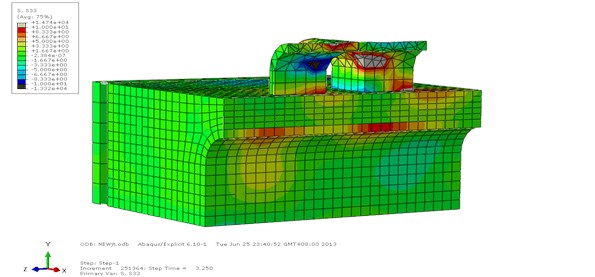
a) The distribution of the stress in the ’s direction
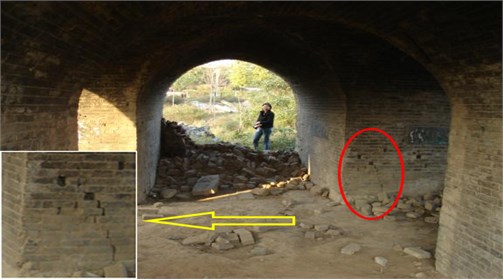
b) The distribution of the crack in the ’s direction
4. The damping effect of vibration isolation trench on Hangu Pass
In order to compare the effect of different trench isolation in more detail, more stress monitoring points (shown in Fig. 23) arranged in such positions where stress is large and crack is concentrated just as shown in Fig. 13. There are 18 stress monitoring points on the gate pass arch in the second layer fort building and door open in the first floor totally.
4.1. The damping effect of vibration isolation trench with different width
Longhai railway line is situated in the north of the center of gate pass, about 30 m, the vibration isolation ditch is located in the midpoint between the gate pass and the railway, namely 15 m away from the railway. Groove depth of isolation trench was 2 m, groove width were 0.6 m, 0.8 m, 1 m, 1.5 m and 2 m. Inputting the train load of 120 km per hour by subroutine to study the stress response of measuring points on gate pass and doorway and output the curve of Mises stress. Just taking the Mises stress peak value as the comparison objects in order to compare damping effect under different conditions preferably. Fig. 16 shows peak stress curve of the gate pass arch in the second layer fort building and door open in the first floor under different widths of trench situations.
Fig. 15FE model and Layout monitoring points
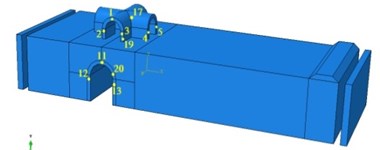
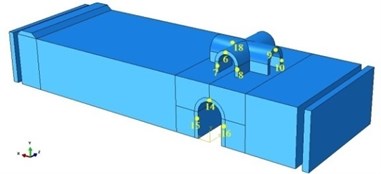
Fig. 16 shows that, the stress peak response is indeed reduced after trench isolation is added on the finite element model of Hangu Pass, however, the damping effects is poor due to the shallow groove depth of 2 m, such as stress peaks of measuring point 2 with no isolation trench only dropped from 40.9 Pa to 29-33 Pa, only about 25 %, and the peak stress of other measured points are reduced. However, the observed peak stress curves for each measuring point with different groove width are almost overlapped. Therefore, the conclusion can be summarized that damping effect are same with different groove width of trench isolation and the width of vibration isolation trench has little influence on the damping effect. It is better not to set too wide trench isolation from the perspective of protecting the ruin, and this paper takes the groove width of trench isolation as 0.8 m to do following studies.
Fig. 16All points of peak stress curve for different widths of trench
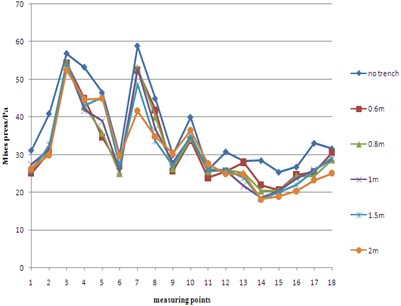
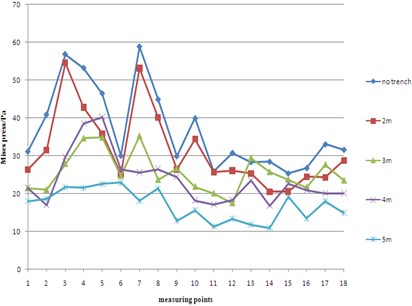
Fig. 17All points of peak stress curve for different depths of trench
4.2. The damping effect of vibration isolation trench with different depth
To study the reducing vibration effect of vibration isolation trench which have different depth, the vibration isolation ditch is also located in the midpoint between the gate pass and the railway. Considering isolation trench walls will be excavated in ramming the soil on Hangu Pass – the ancient ruin, and dug deep trench isolation may affect the stability of trench walls, it is better not to set too deep trench isolation. The groove depths were taken as 2 m, 3 m, 4 m, and 5 m. Fig. 17 shows peak stress curve of the gate pass arch in the second layer fort building and door open in the first floor for different depths of trench.
As can be seen from Fig. 17, peak stress curve is the lowest when the groove depth is 5 m. For example, the peak stress of measured point 10 dropped from 39.9 Pa with isolation trench to 15.58 Pa, felling about 61 %. Peak stress of measuring point 4 dropped from 53.21 Pa to 21.54 Pa, declining about 60 %. The shapes of peak stress curve of each measuring point for different depths of trench change greater, which indicates that the depth of vibration isolation trench has much influence on the reducing vibration effect, and the deeper isolation trench is, the better the vibration damping effect is. Moreover, when depth of trench is 5 m, the stress peak of each measuring points are between 11-22 Pa, and peak stress curve is almost in a straight line, indicating that the average of stress distribution in gate pass and doorway of Hangu Pass are uniform, which is favorable for stability of the structure.
4.3. The damping effect of vibration isolation trench with different location
To analyze the impact on damping effect of the isolation trench position, take the groove width as 0.8 m, depth as 5 m. Due to the set of isolation trench, there may exist a response enhancement area after the isolation trench [24], it is better not to design isolation trench too close from the Hangu Pass, so the distance from the railway were taken 2 m to 25 m. Table 5 shows the Mises stress peak of each points for different conditions, corresponding peak stress curves shown in Fig. 18.
As can be seen from Fig. 18, the location of the trench isolation does have a great effect on damping effect, and the peak stress response curves of each point constitute the lower limit of the all curves where the distances of measure points are 15 m and 20 m from the railway. When distance of measure points are 15 m from railway, 10 measurement points of 18 have the smallest peak stress response compared with other conditions, including 2, 3, 7, 9, 10, 11, 13, 14, 16 and 18, accounting for more than half of all measuring points. At the same time, the peak stress of other measuring points are small, such as measuring point 5, whose distance is 15 m from the railway being only 22.51 Pa which little smaller than the minimum (19.23 Pa). It is obviously to see that the damping effect is the best when vibration isolation trench is placed in a distance of 15 meters of railway line. Moreover, Fig. 18 clearly shows that peak stress curve with the distance railway curve at 20 m and 25 m are below than those close to the railway, which can also be seen from Table 5. In other word, damping effect when the trench isolation is far from protected buildings (Hangu Pass) is better than those when the trench isolation is close to protected buildings, while damping effect is best when trench isolation is placed in a distance of 15 meters of railway line.
Table 5All points of peak stress curve for different locations of trench / Pa
Measuring points | No trench | 2 m | 4 m | 6 m | 8 m | 10 m | 15 m | 20 m | 25 m |
1 | 31.1 | 21.8 | 26.0 | 24.0 | 19.4 | 18.8 | 17.9 | 17.1 | 19.3 |
2 | 40.9 | 26.3 | 26.4 | 28.3 | 24.6 | 23.2 | 18.5 | 21.0 | 21.3 |
3 | 56.8 | 29.1 | 31.7 | 37.6 | 25.8 | 28.0 | 21.7 | 27.0 | 28.9 |
4 | 53.2 | 26.5 | 25.1 | 45.1 | 28.3 | 34.0 | 21.5 | 15.9 | 23.6 |
5 | 46.4 | 29.3 | 34.1 | 44.3 | 31.2 | 23.8 | 22.5 | 19.2 | 19.4 |
6 | 30.0 | 19.9 | 29.2 | 23.2 | 21.2 | 19.4 | 22.8 | 17.5 | 20.7 |
7 | 58.8 | 27.0 | 33.3 | 39.4 | 27.3 | 26.2 | 18.0 | 27.3 | 26.3 |
8 | 44.9 | 26.6 | 24.9 | 35.7 | 22.6 | 21.7 | 21.3 | 20.5 | 20.7 |
9 | 29.9 | 22.4 | 21.9 | 20.8 | 17.4 | 23.8 | 12.7 | 18.7 | 17.2 |
10 | 39.9 | 19.2 | 27.4 | 28.2 | 20.7 | 22.9 | 15.5 | 19.8 | 22.2 |
11 | 25.8 | 17.4 | 20.9 | 14.4 | 18.1 | 20.7 | 11.1 | 18.4 | 14.1 |
12 | 30.8 | 11.7 | 13.6 | 27.1 | 21.5 | 18.3 | 13.3 | 13.3 | 17.0 |
13 | 28.3 | 19.4 | 29.1 | 24.3 | 16.0 | 23.1 | 11.7 | 13.8 | 17.5 |
14 | 28.4 | 11.5 | 15.3 | 20.0 | 16.0 | 21.0 | 10.9 | 16.0 | 17.7 |
15 | 25.3 | 18.5 | 24.9 | 20.6 | 16.5 | 21.0 | 19.0 | 14.3 | 17.8 |
16 | 26.8 | 16.0 | 13.8 | 20.4 | 17.0 | 16.4 | 13.4 | 14.9 | 15.8 |
17 | 33.0 | 18.0 | 21.8 | 22.7 | 21.3 | 15.9 | 17.9 | 21.7 | 16.7 |
18 | 31.6 | 21.4 | 31.8 | 23.7 | 19.5 | 18.9 | 14.9 | 18.8 | 17.1 |
Fig. 13 and Table 5 show that, when the isolation trench is not provided, the environmental vibration subjected to train load have different impact on damping effect between gate pass and doorway. The first column of Table 5 shows: the peak stress of doorway measuring points are below 30 Pa, and peak stress of gate pass measuring point are higher than 30 Pa, the peak stress of measured point 3 is up to 56.84 Pa. Those are consistent with observed damage status of Hangu pass where gate pass have been destroyed much more serious than the doorway. Therefore, it is necessary to separate the gate pass and the doorway to analysis separate damping effect after setting a trench isolation.
We use ABAQUS software to find the points which have maximum peak stress of gate pass and doorway when the train passed, such as the measure points 19 and 20 in Fig. 15. Fig. 23 shows the Mises stress curve of this two points with no isolation trench, where the peak stress of measuring point 19 on gate pass reached 82.24 Pa, and peak stress of measuring point 20 on doorway is just 32.68 Pa, as is shown in Table 6. Analyzing the change of peak stress of measurement points 19 and 20 when isolation trench is set in different locations to study the location of vibration isolation trench have different influence on the reducing vibration effect a different location on different impact on damping effect between gate pass and doorway. Table 6 is the peak stress of measurement points 19 and 20 when isolation groove’s width is 0.8 m, depth is 5 m, but have different locations.
Table 6Two points of peak stress curve for different locations of trench / Pa
Measuring points | No trench | 2 m | 4 m | 6 m | 8 m | 10 m | 15 m | 20 m | 25 m |
19 | 82.2 | 35.8 | 43.0 | 54.6 | 33.7 | 36.8 | 30.9 | 34.4 | 38.1 |
20 | 32.6 | 14.7 | 25.4 | 24.8 | 22.0 | 24.9 | 15.8 | 16.1 | 22.4 |
As can be seen from Table 6, peak stress of gate pass decreased most when the isolation trench is set at 15 meters from the Longhai Railway, which dropped from 82.2 Pa to 30.99 Pa, decreasing about 62 percent which means damping effect is the best. Peak stress of doorway decreased the most when the isolation trench is set at 2 meters from the Longhai Railway, which dropped from 32.68 Pa to 14.71 Pa, decreasing about 55 percent. That is to say damping effect is the best. Due to the maximum impact of gate pass induced by environmental vibration, the peak stress measuring points 19 of gate pass only down to 30.99 Pa with isolation trench, while the peak stress measuring points 20 of doorway can down to 14.71 Pa with isolation trench. The above analysis shows that: the location of vibration isolation trench have different influence on the reducing vibration effect between the second layer fort building and door open in the first floor. The damping effect of gate pass is the best when vibration isolation trench is placed in a distance of 15 meters of railway line, while the damping effect of doorway is the best when vibration isolation trench is placed in a distance of 2 meters of railway line. However, if the isolation trench is set in the 2 m distance to Longhai line, isolation trench may touch the railway embankment, causing construction difficulties and affecting the normal running operation of the railway. Moreover, second layer gate pass of Hangu Pass is the most severely damaged, so it is better to give priority to protect the weak area. In other word, it is proposed to set up trench isolation at a distance of 15 m to the railway.
4.4. The damping effect of vibration isolation trench with different filling material
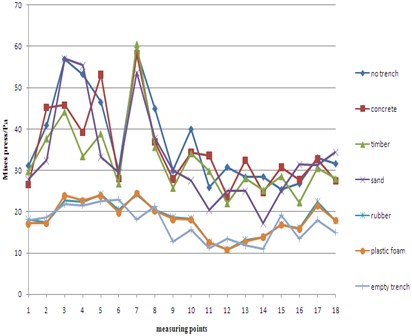
On the model, I set isolation trench which is 15 m from the railway, 5 m depth, 0.8 m wide and fill different materials, observe the reducing vibration effect of vibration isolation trench which have different filling material of the isolation trench. The filling materials are concrete, wood, sand, rubber and foam. Table 7 shows the parameters of the filling material, which can be divided into two categories: elastic modulus is over the ramming soil (8.64 MPa), such as concrete, wood and sand; elastic modulus is less than ramming soil, such as rubber and foam. Fig. 19 shows peak stress curve of the gate pass arch in the second layer fort building and door open in the first floor for different filling materials.
As can be seen from Fig. 19, the peak stress of several measuring points will be larger than those with no isolation trench when the isolation trench fills materials which have higher elastic modulus than ramming soil. Such as the measuring point 5, the peak stress magnified from 46.48 Pa to 53.09 Pa after filling concrete. The reason may be that the vibration wave in some frequency bands were refracted in this position and the generated greater stress response when vibration wave go across the medium with high elastic modulus of in the transfer process [25]. It is obviously to see that the peak stress curves are low elastic modulus filler material in the lower part of the high elastic modulus, indicating that the damping effect of soft material with low modulus elasticity is significantly better than those with high modulus elasticity (rigid materials). Moreover, peak stress curves with soft filling materials and the empty isolation trench are almost coincided, indicating that the trench soft filling material and the empty isolation trench have similar damping effect. A vibration isolation trench is suggested to be placed on the ruin, which may also be filled with soft materials such as rubber and foam to enhance the stability of the walls of isolation.
Table 7Parameters of the filling material
Materials | Elasticity modulus / Pa | Density / kg/m-3 | Poisson’s ratio |
Concrete | 3.5E10 | 2200 | 0.2 |
Timber | 1.1E10 | 700 | 0.28 |
Sand | 7.5E7 | 1950 | 0.35 |
Rubber | 1100 | 2040 | 0.42 |
Plastic foam | 120 | 1920 | 0.46 |
Fig. 18All points of peak stress curve for different locations of trench
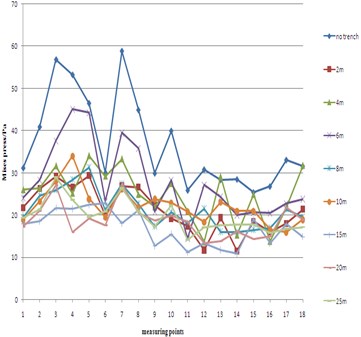
Fig. 19All points of peak stress curve for different filling
4.5. The damping effect of the best trench isolation
This paper shows that isolation trench with the best damping effect should be located at 15 m distance to railway, which is 0.8 m width and 5 m depth. To increase the stability of the isolation trench, soft filling material can be considered to fill in. Fig. 19 shows the Mises stress’s distribution under train load with isolation trench. It is easy to find the stress of the whole Hangu Pass decreased a lot with the isolation trench, especially the doorway and gate pass arch where the stress are concentration.
Research indicatesthat the vibration of train movement direction ( direction) likely exerts a deteriorating effect on the Hangu Gate Pass crack, the Fig. 21 shows the stress distribution around internal the doorway and gate pass with isolation trench or with no isolation trench, it is clearly to see that the train movement direction ( direction) normal stress largely concentrates on both the bottom of second floor arch and the top of doorway arch, and stress of those two position are decreased significantly after setting the recommended isolation trench, and the vibration of train movement direction will no longer develop existing cracks. In a word, trench isolation can effectively reduce the impact of the vibration of train movement direction to the Hangu Pass.
Fig. 20The Mises stress’s distribution under train load with isolation trench
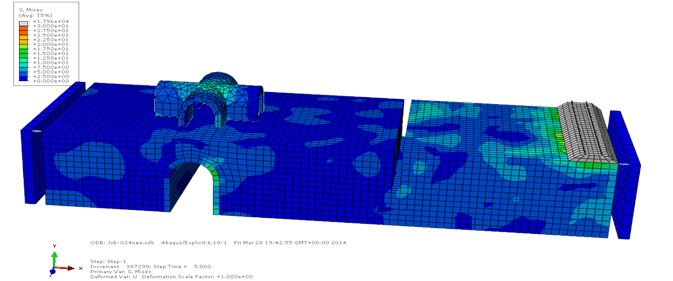
Fig. 21The distribution of the stress in the Z’s direction of the doorway with isolation trench
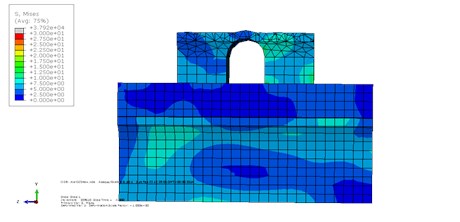
Fig. 22Time histories of the Mises stress’s in monitoring points
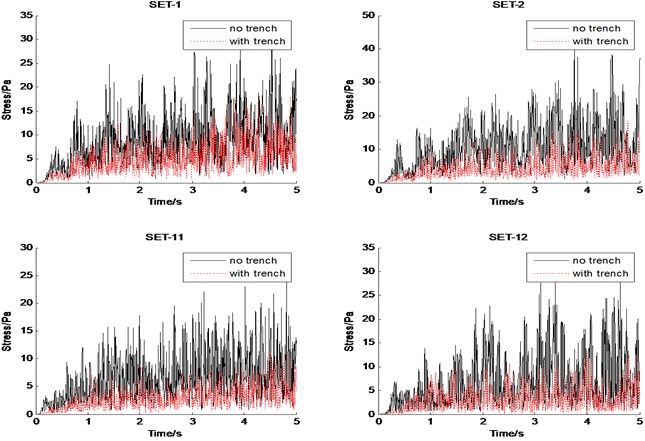
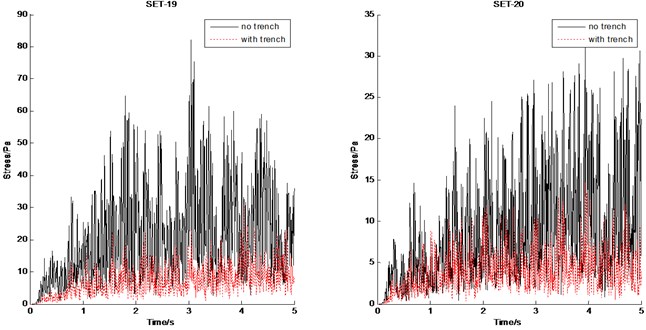
In order to illustrate the damping effect of isolation trench directly, Fig. 22 shows Mises stress curve of 4 typical measuring points corresponding to part 3 with (or with no) vibration isolation. Fig. 23 shows the stress curve of the largest peak stress in gate pass and doorway with (or with no) vibration isolation. As can be seen from Fig. 22 and Fig. 23, the stress of the measure points can be effectively reduced after setting the isolation trench, a reduction is approximately 2 out of 3. The vibration isolation trench can not be completely separated off the train load, because some of the wave energy transmitted to bypass the isolation trench to Hangu Pass due to some vibration wave diffraction and refraction will occur, triggering stress responses. However, stress of each measure points were meanly dropped to less 10 Pa, which has reached a satisfactory damping effect.
Fig. 23Time histories of the Mises stress’s in monitoring points 19 and 20
5. Conclusions
In order to protected the ruin from the environmental vibration induced by Longhai railway. Field Measurement, Analyses and Protection for the vibration of Hangu Pass were carried out. Based on observation and FEM analyses, the main conclusions are as follows:
1) The damage types for Hangu Pass include collapsed wall, internal cracks, cracks in stone masonry, etc. There are many reasons being responsible for the damage of pass, such as the long-term exposure to the sun and rain, man-made destruction and also environmental vibration induced by Longhai railway.
2) The environmental vibration induced by the Longhai railway has great influence on the Hangu Pass. The max vibration level is almost twice the background vibration level.
3) Comparing with the vertical vibration level induce by the Longhai railway at the bottom of the pass, the influence of vertical vibration level on the top of pass is more significant.
4) The maximum MISES stress areas from FEM analysis are similar to crack distribution areas of Hangu Pass.
5) The width of vibration isolation trench has little influence on the reducing vibration effect, but the depth of vibration isolation trench has much influence on the reducing vibration effect. The location of vibration isolation trench have different influence on the reducing vibration effect between the second layer fort building and door open in the first floor.
6) The best reducing vibration effect has been gained when vibration isolation trench is set at the middle place of doorway and railway lines. The reducing vibration effect of soft materials is better than those of hard materials.
Due to the Longhai railway line is one of the busiest transport routes, with constant speed trains, the environment vibration effects induced by train on Hangu Pass will deepen, this paper presents a design suggestion about isolation trench. However, authorities also should be real-time monitoring and strengthen weak areas timely in order to protect our history treasures favorably.
References
-
Cui G. H., Tao X. X., Chen X. M. Studies on environmental vibration induced by urban rail transit. Journal of Earthquake Engineering and Engineering Vibration, Vol. 28, Issue 1, 2008, p. 38-43, (in Chinese).
-
Sanayei M., Kayiparambil A. P., Moore J. A. Measurement and prediction of train-induced vibrations in a full-scale building. Engineering Structures, Vol. 77, 2014, p. 119-128.
-
Costa P. A., Calcada R., Cardoso A. S. Track-ground vibrations induced by railway traffic: in-situ measurements and validation of a 2.5 D FEM-BEM model. Soil Dynamics and Earthquake Engineering, Vol. 32, 2012, p. 111-128.
-
Kouroussis G., Pauwels N., Brux P. A numerical analysis of the influence of tram characteristics and rail profileon railway traffic ground-borne noise and vibration in the Brussels Regional. Science of the Total Environment, Vol. 482-483, 2014, p. 452-460.
-
Kouroussis G., Parys L. V., Conti C. Using three-dimensional finite element analysis in time domain to model railway-induced ground vibrations. Advances in Engineering Software, Vol. 70, 2014, p. 63-76.
-
Lopes P., Costa P., Ferraz A. M. Numerical modeling of vibrations induced by railway traffic in tunnels: from the source to the near by buildings. Soil Dynamics and Earthquake Engineering, Vol. 61-62, 2014, p. 269-285.
-
Kawamura S., Ito S., Yoshida T. Isolation effect of a dynamic damper and a trench on ground vibration caused by a construction machine. Applied Acoustics, Vol. 72, Issue 4, 2011, p. 151-156.
-
Kumar P., Sandhu H. K., Chakraborty S. K. Isolation of plane shear wave using water saturated trench barrier. Soil Dynamics and Earthquake Engineering, Vol. 59, 2014, p. 42-50.
-
Garinei A., Risitano G., Scappaticci L. Experimental evaluation of the efficiency of trenches for the mitigation of train-induced vibrations. Transportation Research Part D, Vol. 32, 2014, p. 303-315.
-
Esmaeili M., Zakeri J. A., Mosayebi S. A. Investigating the optimized open V-shaped trench performance in reduction of train-induced ground vibrations. American Society of Civil Engineers, International Journal of Geomech, Vol. 14, 2014, p. 1-11.
-
Hasheminezhad A. Reduction of railway-induced vibration using in-filled trenches with pipes. International Journal of Railway, Vol. 7, Issue 1, 2014, p. 1-23.
-
Leonardi G., Buonsanti M. Reduction of train-induced vibrations by using barriers. Research Journal of Applied Sciences, Engineering and Technology, Vol. 7, Issue 17, 2014, p. 3623-3632.
-
Li K. F., Liu W. N., Liu W. F. Tests and analysis of traffic-induced vibration effects on surrounding historic buildings. Journal of Beijing Jiaotong University, Vol. 35, Issue 1, 2011, p. 79-83, (in Chinese).
-
GB10070-88, Standard of Environmental Vibration in Urban Area. Ministry of Environmental Protection of the People’s Republic of China, Standards press of China, 1988, (in Chinese).
-
GB/T50355-2005 Standard of Limit and Measurement Method and Vibration in the Room of Residential Buildings. China Academy of Building Research, China Architecture and Building Press, 2005, (in Chinese).
-
Jenkins H. The effect of track and vehicle parameters on wheel/rail vertical dynamic forces. Railway Engineering Journal, Vol. 3, Issue 1, 1974, p. 2-16.
-
Liu W. N., Xia H., Guo W. J. Study of vibration effects of underground trains on surrounding environments. Chinese Journal of Rock Mechanics and Engineering, Vol. 15, 1996, p. 586-593.
-
Pan C. S., Pande G. N. Preliminary deterministic finite element study on a tunnel driven in loess subjected to train loading. China Civil Engineering Journal, Vol. 17, Issue 4, 1984, p. 54-55.
-
Liang B., Cai Y. Dynamic analysis on subgrade of high speed railways in geometric irregular condition. Journal of the China Railway Society, Vol. 21, Issue 2, 1999, p. 84-88.
-
Yang Y. B., Guo S. R. Analysis of the Soil Vibration Caused By High-Speed Train. Taiwan Sinotech Engineering Consultants, Inc., 1995, (in Chinese).
-
Cheng B. Research on the Subway Tunnel Vibrated By Train Inducing Displacement Regulations. Tongji University, Ph.D. thesis, 2004, (in Chinese).
-
The geotechnical investigation report of Xin-an Country Hangu Pass site restoration in Luoyang. The Henan Province Hanson Engineering Technology & Services Co., Ltd. Zhengzhou the Long Gang geotechnical engineering Co., Ltd., Luoyang, 2010, (in Chinese).
-
Wei L. S., Ren M. The viberation report of Xin’an Country Hangu Pass restoration project in Luoyang. Report-2010-001-vibration, Guangzhou, Guangzhou Baiyun heritage conservation Engineering Co., Ltd., 2010, (in Chinese).
-
Deng Y. H., Xia T. D., Chen J. Y. Numerical analysis of response magnified area of vibration isolation trenches subjected to vehicle dynamic loads. Chinese Journal of Geotechnical Engineering, Vol. 28, Issue 12, 2006, p. 2121-2127.
-
Huang Y. Z., Gao L. The isolation influence of the trench on the vibration caused by train. Railway Engineering, Vol. 10, Issue 2, 2005, p. 76-77, (in Chinese).
About this article

The conducted research work in this paper was funded by China National Natural Fund (Project No. 51178126, 51208125), Science and Technology Program of Guangzhou, China (Project No. 2013J2200074), Guangdong Province of High Level Talents in Higher School (Talent Introduction) Project, and Guangdong Natural Fund (Project No. s2011030002800), and the financial supports were gratefully acknowledged.
