Abstract
A full-range (360°) damage detection is necessary for structural health monitoring of large plate-like structures. However, the linear arrays are mainly limited by the range of damage detection, which is maximum up to 180°. Moreover the detection accuracy is also very poor at angles close to 0° and 180°. In order to solve this problem, a novel damage detection and localization method is presented in this paper. The proposed method combines the image enhancement technology and the cruciform piezoelectric phased array to improve the performance of the linear array based system. In addition to the implementation of cruciform phased array, a new image enhancement algorithm is proposed with an aim to deal with the problem of phantom image emerging in the opposite side of the original image. The results of the experiments conducted on aluminum plate and epoxy composite laminate plate show that the proposed method can effectively solve the limitations of the linear sensor array, and accurately detect single or multiple damages in full angle mode.
1. Introduction
Structural Health Monitoring (SHM) of plate-like structures has become a popular research topic since many of such structures found in aircrafts, containers, and furnaces are usually required to meet high safety demands [1-3]. Many methods of structural damage detection have focused on the application of Lamb waves, which include the time reversal imaging technology [4-6], the spatial filter method [7, 8] and the ultrasonic phased array method.
The performance of a SHM system can be enhanced by the means of active ultrasonic phased arrays due to their superior signal-to-noise ratio and beam-steering capability [9, 10]. The linear ultrasonic phased array, is one of the simplest and most widely used arrays that have been well explored and developed in recent years. Giurgiutiu et al. [10] analyzed the method of Lamb wave for analytical modeling of a plate structure, and also studied crack detection, hole damage, and damage localization on an aluminum plate structure. Sun et al. [11] combined the ultrasonic phased array technology and imaging technology to achieve a high measurement precision in the damage detection on aluminum and composite material plate structures. Malinowski et al. [12] conducted an experiment on the crack damage detection in aluminum plate with one dimensional linear array.
However, the linear ultrasonic phased array was found to possess several fundamental disadvantages, as follows. Firstly, it does not cover the whole azimuth angular system (0°-360°) and it has very poor accuracy at the angles close to 0° and 180°. Secondly, linear arrays suffer from front-back ambiguity (mirror effect), which makes it impossible to distinguish targets located in front and behind of the array.
The above mentioned limitations of linear arrays can be solved by the use of two-dimensional (2-D) arrays. A range of 2-D array configurations have been presented in several papers. Giurgiutiu et al. [10] worked on beam direction of the two-dimensional, and carried out crack detection experiments using a rectangular array. Malinowski et al. [12], proposed a star-shaped array, and verified its crack detection efficiency on an aluminum plate. Wilcox [13], proposed a circular ultrasonic phased array and conducted a damage detection experiment based on their proposed array design.
The cruciform phased array is a relatively simple 2-D array in terms of its configuration, and complexity of its imaging algorithm. However, as highlighted by Yu [14], duplicate beams emerge on the opposite side of the original beams (180° for beamforming at 0°, and 270° for beamforming at 90°). To overcome this limitation and to realize 360° full angle detection, an image enhancement algorithm is also investigated in this paper. The proposed algorithm is suitable for both single and multiple damage detection. The Lamb wave signal is analyzed in detail through experiments on an aluminum plate, and a full-angle multiple-damage monitoring with high measurement accuracy on the aluminum plate and the epoxy composite laminate plate is realized.
2. Cruciform ultrasonic phased array
2.1. Cruciform array signal model
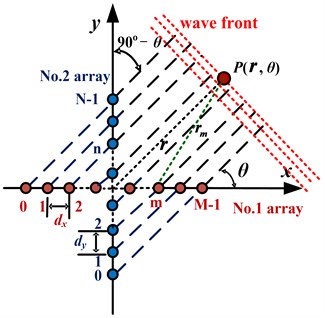
The layout of the cruciform array is illustrated in Fig. 1. Two linear piezoelectric transducer (PZT) arrays are aligned along the and axes, with the mid-point of each array meeting at the axes’ origin. The arrays are labeled No. 1 and No. 2, and consist of and N PZT elements with inter-element spacing of and , respectively. For a distant point , refers to the vector spanning from the origin to point . As , , , the rays connecting point and each of the respective sensors can be assumed to be parallel with each other, inclined at angle . In the center position of the PZT array to establish the coordinate system origin, the th element vector in -axis and the th element vector in -axis are:
And the vector is:
The wave front at a point from the source can be expressed as:
where is the wavenumber:
where is wave frequency, is the speed of Lamb wave traveling along the structure and the direction:
where the direction vector from th element to the target is defined as .
The wave front coming from the th element toward the target can be written as:
Fig. 1Cruciform array
It is assumed that each PZT element of the cruciform array is excited and Lamb waves generated on the plate will reach point . The synthetic signal can be broken down into signal components that excited all the piezoelectric patches of No. 1 and No. 2 arrays, denoted by and , respectively.
For the far field case, , . If the weights are chosen as unity (1), thus the synthetic wave front that reaches , propagating from all of the PZT elements of the No. 1 array can be represented by:
It can be noticed that the first term of the equation represents the wave that is emitted from the origin. It can be used as a reference to calculate the required time delay for each elementary wave. The remaining terms represent the beam forming factor.
To steer the output wave front into a certain direction, the delays () are introduced. Eq. (8) becomes:
Similarly for , the delays () are introduced:
If the time delay is chosen as shown in Eqs. (11) and (12), a maximum value of the beam forming factor can be achieved; consequently, the synthetic signal will be strengthened by times with respect to the individual reference signal . Likewise, the synthetic signal will be times the individual reference signal . The resulting forms of the synthetic signals are presented in Eqs. (13) and (14):
Hence, the combined synthetic signal of cruciform array can be expressed as:
Based on the principle of reciprocity, the receiving process must be consistent with the exciting process, given that the same conditions apply within the two processes. Therefore, it can be assumed that the excited signals left the PZT elements within a set of specific time delays, the returning signals should be able to arrive at all the PZT elements at the same time:
2.2. Damage localization
The principle of localization can be explained as follows. If there is no damage at point , the ultrasonic transmission will continue to propagate straight in the direction of propagation. Otherwise, the Lamb waves generated by piezoelectric patches will have the same phase at point due to the time delay.
When the signal beam points at the direction towards the damage location, all the signals will be focused, and the energy of the combined signal will be enhanced. As a result, the signal energy reflected by damage will be strongest in this direction. By analyzing the signal in the damage direction, the damage distance can be calculated as:
where is the arrival time of the signal in the damage direction, is the Lamb wave velocity along the structure.
In conclusion, the damage location can be achieved by scanning the direction and calculating the distance.
2.3. Image enhancement
The scan images can be obtained by displaying the energy of synthetic signal from all the directions on the polar coordinate plane in a gray level resolution. The appearance of phantom images in the opposite side of the synthetic signal of cruciform array will affect the damage localization, especially in the case of multiple damages. An image enhancement method is proposed in order to improve the scanned image of damage in the material. The synthetic signals are normalized, and the exponential function algorithm is applied, which is shown below:
where is the amplitude of the synthetic signal before optimization, and is the corresponding synthetic signal amplitude after the optimization. is the power of exponential function, which is equivalent to the size of control value of the original image used to enhance the contrast of the gray value of each part.
3. Experiments on an aluminum plate
3.1. Experimental setup
It can be seen from Fig. 2(a) that the experimental setup consists of an aluminum plate, a cruciform PZT array and an Integrated Structural Health Monitoring Scanning System (ISHMS) developed by Qiu and Yuan [15, 16]. This system is developed to control the excitation and sensing of the PZT elements array. The dimension of the aluminum plate is 1000 mm×1000 mm×2 mm, whereas the diameter and thickness of each of the PZT elements are 8 mm and 0.48 mm, respectively. Each of the linear sub-arrays of the cruciform PZT array is made up of seven PZT elements with 12 mm spacing between two adjacent elements. The PZT elements for both linear arrays are labeled as PZT0 to PZT6. The mutual element PZT3, is the center point of both linear arrays in this case, and it is set as the coordinate’s origin.
Fig. 2Experimental setup and the sensors array layout diagram (mm)
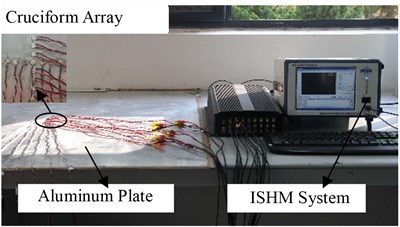
a) Experimental setup
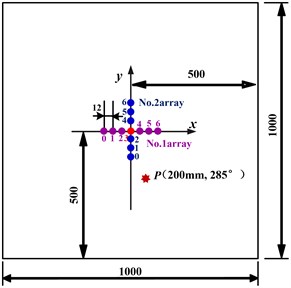
b) Single damage position
3.2. Single damage detection and localization
A hexagonal hollow screw with a diagonal length of 13 mm, denoted as , is bonded on the plate to simulate an artificial damage [17, 18]. An added mass can change the local stiffness of the structure at the bonding area, and can simulate wave scattering due to changes in local stiffness which would represent a delamination damage. In order to reduce the experiment cost, a hexagonal hollow screw was bonded on the plate for validation of the proposed damage localization method.
The positions of the damage and the PZT elements are as shown in Fig. 2(b). Two identical hexagonal hollow screws, denoted as and , are bonded on the plate to simulate two artificial damages (seen in Fig. 2(c)). The excitation signal is 5-cycle modulated sine wave signal, while the excitation frequency is set at 40 kHz. The mode sensor signal amplitude dominates that of the mode, which is believed to be conducive in the signals’ analysis [19, 20]. The sampling frequency is set at 2 MHz, and 1300 time samples are collected.
An artificial damage point (200 mm, 285°) is introduced. The data collection is conducted in a round-robin pattern, which is performed in the same way as in the case of 1-D array. In each turn, one element acts as a transmitter and transmits the excitation signal while the rest of the elements serve as receivers and record the reflections from both arrays.
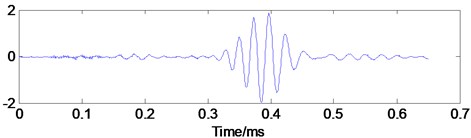
The Fig. 3 shows the sensor response signal and the scattered signal from the damaged area, when the first piezoelectric element acts as transmitter, while the signal is recorded at sixth sensor of No. 1 array. The received signal in the health status and the damage status are called the health and damage signals, respectively. The damage scattering signal, which is the difference of the health and damage signals, is used here in order to reduce the effect of the complicated boundary reflection waves and other environmental factors.
Fig. 3The sensor response signal and the damage scattering signal
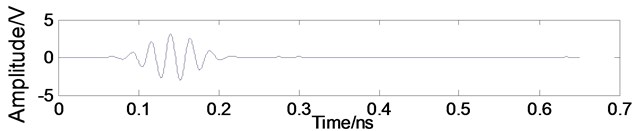
a) Health signal
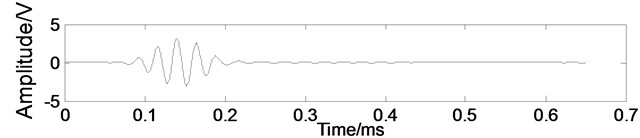
b) Damage signal
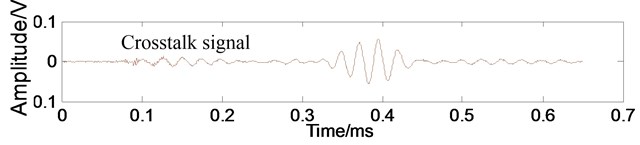
c) Damage scattering signal
Fig. 4The synthetic damage scattering signals
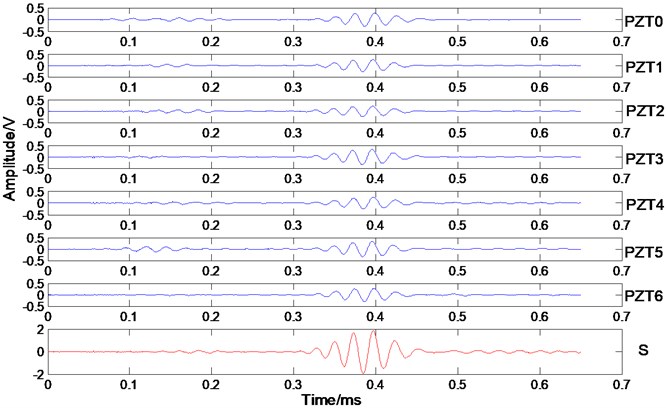
The Fig. 4 shows the synthetic damage scattering signals of No. 1 array after time delay and superimposed, where the th ( 0-6) PZT element works as an actuator and the others work as sensors in 285° direction. S is the combined synthetic signal of all the damage scattering signals (6×7 42) in 285° direction. By using the phased array algorithm, the scattering signals can be delayed for virtually steering the damage direction, the wave propagation direction. All of the steered scattering signals are summed to amplify the incoming wave signal at its propagation direction and minimize noise and interference from other directions. Ultrasonic phased array method improves the signal-to-noise ratio and improves the damage identification. It can be seen from Fig. 4, that the damage scattering signal has been significantly improved.
It can be found that when the maximum synthetic signal is directed at the actual damage angle of 285°, a mirrored synthetic signal shows up symmetrically at 75°, as shown in Fig. 5. Fig. 6(a) further explains this phenomenon by showing that when there is only one working linear array (No. 1 array in this case) for a pre-existing damage, located on the lower half of the coordinate system (i.e. below the array), a phantom image will also appear on the scan image. This phenomenon of inherent mirror symmetry subsequently results in the inspection area being limited to 180°.
Fig. 5The synthetic damage scattering signal
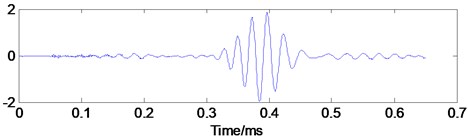
a) The synthetic damage scattering signal at 285°
a) The synthetic damage scattering signal at 75°
Fig. 6Damage detection figure
a) No. 1 array only
b) No. 2 array only
c) The original image
d) The image after enhancement
Similarly, the problems will also occur if only the No. 2 array is used to detect damage, as seen in Fig. 6(b). In this case, since the 285° damage angle is located very close to the array (or the -axis), the phantom image is seen to be connected to the image of the actual damage, which makes it more difficult to identify the actual damage location.
Through the linear array analysis, the algorithm based on fusion of two linear arrays is adopted. Firstly, the damage scattering signals on two linear arrays are calculated. Afterwards, the scattering signals of two linear arrays are delayed to achieve a focus and normalized. Finally, the relative amplitude of the signals in all of 360° range is shown in the same figure as a gray chart, resulting in a beam formed image with visible damaged areas. It is found that the resulting image displays the superposition of the two images calculated from two linear array, as shown in Fig. 6(c).
In order to reduce the effect of the unwanted phantom image as well as to improve the damage recognition quality, an image enhancement method is applied to optimize the image by setting the exponential power in Eq. (18) to 5. The enhanced damage scan image is shown in Fig. 6(d). The detection result is (210 mm, 287°), with an angular error of 2°, and positional error of less than 1 cm (actual damage location is (200 mm, 285°)). The result proves that the combination of the cruciform ultrasonic phased array and image enhancement method can effectively identify the aluminum plate damage.
3.3. Multiple damages detection and localization
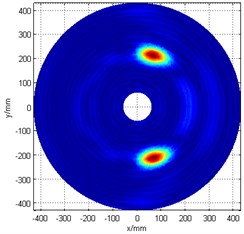
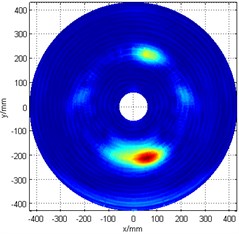
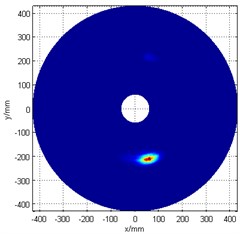
The combination of the cruciform ultrasonic phased array and the image enhancement method can also be used for multiple damage identification. Its principle and recognition process is similar to that of the single damage identification. The damage positions and the layout of the piezoelectric elements are shown in Fig. 7(a). The artificial damage locations are (300 mm, 270°) and (200 mm, 280°).
The cruciform array damage scan image without enhancement is shown in Fig. 7(b). It can be noticed that the damage signal intensity of point is smaller than that of point , and that phantom images also appeared in the opposite sides of theoriginal images. There are two major reasons: 1) point is far from cruciform array than point , so the Lamb wave will get to first, and the secondary wave source is formed that decreases the signal strength of Lamb wave at point ; 2) as shown in Eq. (4), the energy of Lamb wave is proportional to 1/ resulting in higher attenuation in the farthest Lamb wave propagation.
Fig. 7Multiple-damage detection
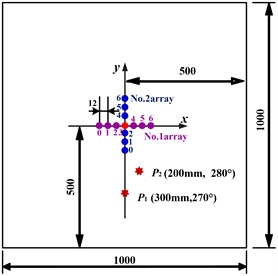
a) Multiple damages position
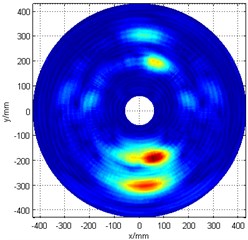
b) The original image
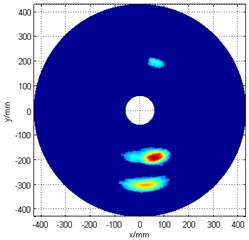
c) The image after enhancement
The paper optimizes the angle-time image of structural damage by applying the exponential function algorithm to enhance image contrast and highlight the angle of structural damage. However, a smaller power of exponential function was chosen to help ease the detection of damage , since its energy is relatively weak. A threshold setting (60 % of the maximum value of the synthetic signal) was initially applied, and then the exponential power is set to 2 for the image enhancement processing. Fig. 7(c) presents the post-enhancement damage detection image.
The damage detection results are (210 mm, 273°) and (195 mm, 284°), which means that the angular error is less 4°, and the positional error is less than 2 cm when compared to the actual damage (300 mm, 270°) and (200 mm, 280°). These results hence prove that the coupling of the cruciform ultrasonic phased method with the image enhancement algorithm can also effectively identify multiple damages on the aluminum plate structure.
4. Experiment evaluation on an epoxy composite laminate plate
4.1. Experimental setup
As can be seen in Fig. 8(a), the experimental system consists of an epoxy composite laminate plate, a cruciform PZT array and an ISHM system. The dimensions of the epoxy composite laminate specimen are 500 mm×500 mm×3 mm, and the thickness of each ply is 0.125 mm with a sequence of [02/904/02. Each of the linear sub-arrays of the cruciform PZT array is made up of seven PZT elements with 9 mm spacing between two adjacent elements. The excitation signal is a 5-cycle modulated sine wave, while the excitation frequency is 50 kHz. The mode sensor signal amplitude dominates over the mode. The sampling frequency is set at 2 MHz, and 1300 time samples are collected.
The positions of the PZT elements and damages are shown in Fig. 8(b). An artificial damage point (150 mm, 270°) of polar coordinates is introduced for verification. A hexagonal hollow screw with a diagonal length of 13 mm, denoted as , is bonded on the plate to simulate the damage.
Fig. 8Experimental setup and the sensors array layout diagram (mm)
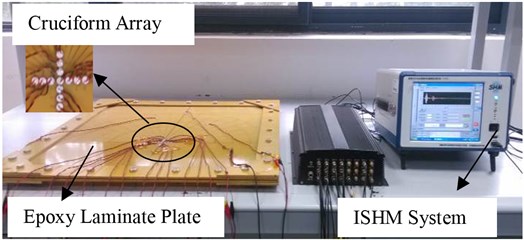
a) Experimental setup
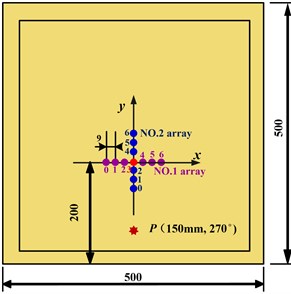
b) Single damage position
4.2. Single damage detection and localization
The data collection is conducted in a round-robin pattern in the same way as performed in the experiments of aluminum plate. Each time, one element transmits the excitation signal and the rest of the elements serve as receivers to record the scattered signals. All the elements in the array transmit in turns to form a multistatic measurement system.
The 2-D algorithm steers the directional beams sweeping through the specimen and maps the scanning results as a 2-D plane image. Direct scanning image of using the cross-shape array are shown in Fig. 9(a). Note that besides the desired damage at 270°, a strong unwanted phantom image shows up at 90° direction.
The enhanced image of the damage is obtained by setting the exponential power in Eq. (18) to 5, as shown in Fig. 9(b). The damage is detected at (149.3 mm, 269°) in the polar coordinates. The error in angle is 1°, and the positional error is 0.3 cm, compared to the actual damage location (150 mm, 270°) in polar coordinates. It is shown that the cruciform ultrasonic phased array and image enhancement technology method can effectively identify the damage in the epoxy composite laminate structures.
Fig. 9Damage detection figure
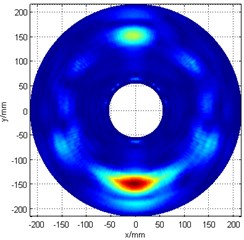
a) The original image
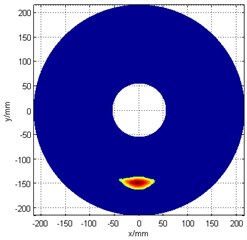
b) The image after enhancement
4.3. Multiple damages detection and localization
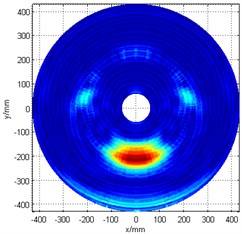
The multiple damage positions and the layout of the piezoelectric elements are shown in Fig. 10. The artificial damage locations are (150 mm, 270°) and (110 mm, 280°). Using the cruciform piezoelectric ultrasonic phased array with the image enhancement algorithm, the final multiple-damage detection image is shown as Fig. 11.
Fig. 10The multiple damages position
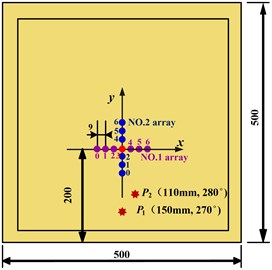
Fig. 11Multiple damages detection figure
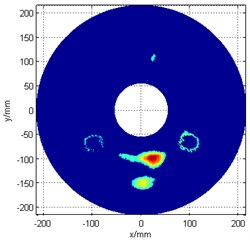
The detected damage locations are (152.8 mm, 270°) and (100.6 mm, 282°), which means that the angular error is less 2°, and the positional error is less than 1.1 cm. These results hence prove that the proposed method can also effectively identify multiple damages on the epoxy composite laminate plate structure.
5. Conclusions
This paper presents a damage detection method on plate-like structures which combines the use of cruciform piezoelectric ultrasonic phased array with an image enhancement algorithm. Compared to the one-dimensional phased array, the cruciform array allows 360° full range detection with multiple advantages. Additionally, the image enhancement algorithm can deal with the problem of phantom image emerging in the opposite side of the original image and provide an improved image.
In order to verify the analysis and evaluate the practical applicability of the proposed method, experiments were performed with experimental setup established in the way that the cruciform array was placed on an aluminum plate and an epoxy composite laminate plate to detect a series of single and multiple damages. The results show that the cruciform ultrasonic phased array with image enhancement algorithm can realize 360° full angle damage detection with a directional error estimated to be less than 4°, and a maximum positional error of less than 2 cm.
References
-
Derriso M., Pratt D. M., Homan D. B. Integrated vehicle health management: the key to future aerospace systems. Proceedings of the Fourth International Workshop on Structural Health Monitoring, 2003, p. 3-11.
-
Christian S., Manfred N. Structural health monitoring, in-service experience, benefit and way ahea. Structural Health Monitoring, Vol. 9, Issue 3, 2010, p. 209-217.
-
Trathen P. N. Structural health monitoring for corrosion on military aircraft. Materials Forum, Vol. 33, 2009, p. 450-456.
-
Wang C. H., Rose J. T., Chang F. K. A synthetic time-reversal imaging method for structural health monitoring. Smart Materials and Structures, Vol. 13, Issue 2, 2004, p. 415-423.
-
Wang L., Yuan F. Damage identification in a composite plate using pre-stack reverse-time migration technique. Structural Health Monitoring, Vol. 4, Issue 3, 2005, p. 195-211.
-
Wang Q., Yuan S. Baseline-free imaging method based on new PZT sensor arrangements. Journal of Intelligent Material Systems and Structures, Vol. 20, Issue 14, 2009, p. 1663-1673.
-
Purekar A. S., Pines D. J., Sundararaman S., Adams D. E. Directional piezoelectric phased array filters for detecting damage in isotropic plates. Smart Materials and Structures, Vol. 13, Issue 4, 2004, p. 838-850.
-
Wang Y., Yuan S., Qiu L. Improved wavelet-based spatial filter of damage imaging method on composite structures. Chinese Journal of Aeronautics, Vol. 24, Issue 5, 2011, p. 665-672.
-
Yuan S. Structural Health Monitoring. National Defence Industry Press, BeiJing, 2007, (in Chinese).
-
Giurgiutiu V. Structural Health Monitoring With Piezoelectric Wafer Active Sensors. Academic Press, 2007.
-
Sun Y., Yuan S., Cai J. Using phased array technology in structure health monitoring. Journal of Astronautics, Vol. 29, Issue 4, 2008, p. 1393-1396, (in Chinese).
-
Malinowski P., Wandowski T., Trendafilova I., Ostachowicz W. A phased array-based method for damage detection and localization in thin plates. Structural Health Monitoring, Vol. 8, Issue 1, 2009, p. 5-15.
-
Wilcox P. D. Omni-directional guided wave transducer arrays for the rapid inspection of large areas of plate structures. IEEE Transactions on Ultrasonics, Ferroelectrics and Frequency, Vol. 50, Issue 6, 2003, p. 699-709.
-
Yu L., Giurgiutiu V. Design, implementation, and comparison of guided wave phased arrays using embedded piezoelectric wafer active sensors for structural health monitoring. Smart Structures and Integrated Systems, Vol. 6173, 2006, p. 1-12.
-
Qiu L., Yuan S. On development of a multi-channel PZT array scanning system and it’s evaluating application on UAV wing box. Sensors and Actuators A, Physical, Vol. 151, Issue 2, 2009, p. 220-230.
-
Qiu L., Yuan S., Wang Q., Sun Y., Yang W. Design and experiment of PZT network-based structural health monitoring scanning system. Chinese Journal of Aeronautics, Vol. 22, Issue 5, 2009, p. 505-512, (in Chinese).
-
Cai J., Shi L., Yuan S.,Shao Z. High spatial resolution imaging for structural health monitoring based on virtual time reversal. Smart Materials and Structures, Vol. 20, Issue 5, 2011, p. 1-11.
-
Yoo B., Purekar A. S., Zhang Y., Pines D. J. Piezoelectric-paint-based two-dimensional phased sensor arrays for structural health monitoring of thin panels. Smart Materials and Structures, Vol. 19, 2010, Issue 7, p. 1-17.
-
Xu B., Giurgiutiu V. Single mode tuning effects on Lamb wave time reversal with piezoelectric wafer active sensors for structural health monitoring. Journal of Nondestructive Evaluation, Vol. 26, Issue 2, 2007, p. 123-134.
-
Santoni G. B., Yu L., Xu B. Lamb wave-mode tuning of piezoelectric wafer active sensors for structural health monitoring. Journal of Vibration and Acoustics, Vol. 129, Issue 6, 2007, p. 752-762.
-
Sun Y., Yuan S., Qiu L., Cai J., Wang Q. Structural health monitoring based on Lamb wave phased array and image enhancement. Acta Aeronautica et Astronautica Sinica, Vol. 30, Issue 7, 2009, p. 1325-1330.
-
Su Z., Ye L., Bu X. A damage identification technique for CF/EP composite laminates using distributed piezoelectric transducers. Composite Structures, Vol. 57, Issue 1, 2002, p. 465-471.
-
Su Z., Wang X., Chen Z., Ye L. A hierarchical data fusion scheme for identifying multi-damage in composite structures with a built-in sensor network. Smart Materials and Structures, Vol. 16, Issue 6, 2007, p. 2067-2079.
About this article

This work is supported by the National Science Fund for Distinguished Young Scholars (Grant No. 51225502), the Natural Science Foundation of China (Grant No. 51205189), the Fundamental Research Funds for the Central Universities (Grant No. NJ20140014), the Research Fund for the Doctoral Program of Higher Education of China (Grant No. 20123218120007), the Priority Academic Program Development of Jiangsu Higher Education Institutions and Qing Lan Project.
