Abstract
A majority of Iranian residential buildings have RC frame structures which are in-filled with masonry walls. Structural deficiencies of in-filled RC frame structures are focused in this probabilistic seismic assessment. The seismic design of 3, 5 and 8 story RC frame structures are carried out according to the current Iranian seismic code and then 3 dimensional analytical models analyzed based on Incremental Dynamic Analysis (IDA) in OpenSEES. The demand statistics in terms of maximum inter-story drift ratio are obtained for 20 sets of ground motion records and the capacity is determined according to the HAZUS-MH limit states and finally the corresponding fragility curves are developed. The results represent the effect of the story numbers, structural deficiency and masonry infill walls in the seismic vulnerability of this subclass of structures.
1. Introduction
Iran is a populated country in Middle East with high seismic hazard and relative poor earthquake resistant buildings. During last decades this country has experienced destructive earthquakes and they caused major life losses and severe property damages. The high population density near or on fault zones is an indicator of potential future disasters. Therefore, it is necessary to estimate possible earthquake risk and develop strategies to reduce related losses. A fragility-based assessment that considers local structural properties is required to prepare such disaster mitigation scenarios.
Fragility curves are found to be useful tools for estimating the seismic risk of urban infrastructures. These curves represent the probability of damages for different levels of earthquake intensity and can be used to prioritize structures for seismic retrofitting programs.
Mostly, the Iranian RC frame structures have masonry infill walls. The achieved experiences from past earthquakes demonstrate the positive or negative effects of infill walls at buildings vulnerability. However, the country national building codes do not consider explicitly the modeling of infill walls within RC frame structures. Therefore, an extensive study considering the effects of infill wall and also structural deficiency in terms of poor concrete quality due to lack of supervision should be carried out.
Jung et al. [1] studied the effects of infill walls on the lateral stiffness and strength of buildings. Their findings showed that the presence of infill walls in structural system of the buildings improve the buildings performance against the earthquakes. Decanini et al. [2] also found out that infill walls would increase the energy attraction of frames during earthquakes. Ozer et al. [3] developed fragility curves for the 3, 5, 8 and 9 story existing RC frame structures of Turkey with analyzing two dimensional models. Their findings showed that the number of stories and also the quality of the concrete material are important factors in seismic vulnerability of these kinds of structures. Naseri et al. [4] studied the seismic vulnerability of existing Iranian RC frame structures. The results showed that with increasing the building heights, their vulnerability increases in all four specified level of damages (Slight, Moderate, Extensive and Complete). However, they did not consider the effects of structural deficiencies and in fill walls in their fragility assessments.
The main aim of this study is performing probabilistic vulnerability assessment for Iranian RC frame structures in-filled with masonry walls in order to find the effects of infill walls and especially the effects of poor concrete quality of the frame elements on the structural fragility.
2. Building description and analytical models
2.1. Characteristics of considered RC frame structures
Three subclasses of RC frame structures with three, five and eight stories and with the same typical plan were considered. Designing of these structures were carried out according to the third edition of the Iran earthquake code named standard 2800 [5] and also Iran concrete national code [6]. The structural system in both directions (two orthogonal directions) is assumed to be RC intermediate moment frame.
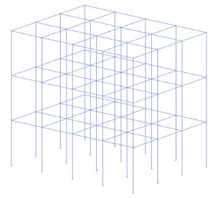
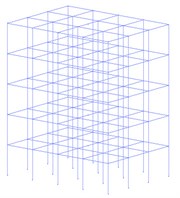
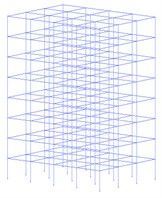
All considered structures are assumed located in relatively high-risk region with soil type III in accordance with Iran earthquake code [5]. The compressive strength of concrete used in RC frame members are assumed to be 210 kg/cm2 and the yield stress of longitudinal and transverse bars are taken 4000 and 3000 kg/cm2, respectively. Dead load of typical stories is taken 650 kg/m2 and the live load of the roof and all other stories are taken as 150 and 200 kg/m2, respectively. Considering the customary practical cases, the typical story height of 3.2 m and bay length of 5 m are assumed. The analytical models of considered structures are presented in Figs. 1 and 2.
Fig. 1Typical plan of all considered buildings
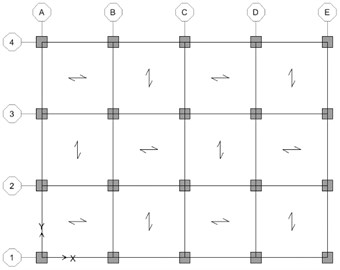
Fig. 23D OpenSEES models of 3, 5 and 8 story considered buildings
In order to considering the effect of upper vibration modes, beside static equivalent analysis, modal dynamic analysis are performed too. The resultants characteristics of the frame elements of the three considered building models are listed in Table 1.
2.2. Classifications of the considered buildings based on HAZUS-MH definitions
HAZUS-MH [7] divides the framed structures into three categories including Low-Rise, Mid-Rise and High-Rise structure. According to this classification, structures with three, five and eight stories in this article are considered to be Low-Rise, Mid-Rise and High-Rise, respectively. The definition regarding to the frame type are listed in Table 2.
Table 1Characteristics of beams and columns of designed buildings
Building model | Story | Beams | Columns | |||||||
Dimensions (cm) | Reinforcement | Dimensions (cm) | Reinforcement | |||||||
Width | Height | Number | Diameter (mm) | Number | Diameter (mm) | |||||
Top | Bottom | |||||||||
3-Story | 1 | 45 | 35 | 7 | 4 | 18 | 45 | 45 | 16 | 20 |
2 | 40 | 35 | 7 | 4 | 18 | 40 | 40 | 16 | 18 | |
3 | 35 | 35 | 7 | 4 | 14 | 35 | 35 | 16 | 16 | |
5-Story | 1 | 60 | 45 | 6 | 5 | 18 | 60 | 60 | 16 | 22 |
2 | 55 | 45 | 8 | 6 | 18 | 55 | 55 | 16 | 18 | |
3 | 50 | 40 | 7 | 5 | 18 | 50 | 50 | 12 | 20 | |
4 | 45 | 40 | 8 | 5 | 16 | 45 | 45 | 12 | 18 | |
5 | 40 | 35 | 7 | 3 | 14 | 40 | 40 | 12 | 16 | |
8-Stoty | 1 | 80 | 50 | 6 | 5 | 20 | 80 | 80 | 28 | 20 |
2 | 75 | 50 | 8 | 7 | 20 | 75 | 75 | 24 | 18 | |
3 | 70 | 50 | 9 | 8 | 20 | 70 | 70 | 24 | 16 | |
4 | 65 | 50 | 9 | 8 | 20 | 65 | 65 | 20 | 16 | |
5 | 60 | 45 | 8 | 6 | 20 | 60 | 60 | 20 | 16 | |
6 | 55 | 45 | 7 | 6 | 20 | 55 | 55 | 20 | 16 | |
7 | 50 | 40 | 7 | 5 | 18 | 50 | 50 | 16 | 16 | |
8 | 45 | 35 | 6 | 3 | 16 | 45 | 45 | 12 | 18 | |
Table 2Considered building types adopted from HAZUS-MH [7]
Range | Description | Label | |
Stories | Name | ||
1-3 | Low-Rise | Concrete moment frame | C1L |
4-7 | Mid-Rise | C1M | |
8+ | High-Rise | C1H | |
2.3. Modeling and analyzing software
OpenSEES [8] is an object-oriented software framework that allows users to create finite element applications for simulating the response of structural and geotechnical systems subjected to earthquakes. The library of materials, elements and analysis powerful tools for numerical simulation of nonlinear systems, easy modeling, and high accuracy made it a powerful and useful analytical tool in earthquake engineering researches. For these reasons, in this article, the OpenSEES platform [8] is used for incremental time history dynamic analysis. The nonlinearity of materials and also p-delta effect are included in the 3 dimensional nonlinear dynamic analysis. A detailed information about the finite element considered models and their element behaviors can be found in Table 3.
2.4. Characteristics of considered materials
Reinforced concrete behavior is modeled using the Concrete 02 material provided in OpenSEES with tensile strength and linear tension softening. The behavior of this material is shown in Fig. 3. This material used the model proposed by Mander et al. [10] to define the monotonic stress-strain curves for confined and unconfined concrete. The effect of confinement is pronounced on the peak compressive stress and ultimate strain in the confined concrete stress-strain relationship. The numerical parameters which are used to model concrete nonlinear stress-strain relations in the OpenSEES are listed in Table 4.
Table 3Detailed information about three considered finite element models in OpenSEES
Building model | Number of nodes and elements | Beams and columns section behavior in OpenSEES |
3-Story | 83 Nodes - 93 Beams - 60 Columns | Nonlinear beam-column element with fiber section |
5-Story | 125 Nodes - 155 Beams - 100 Columns | Nonlinear beam-column element with fiber section |
8-Story | 188 Nodes - 248 Beams - 160 Columns | Nonlinear beam-column element with fiber section |
Table 4The parameters which are used to model concrete nonlinear stress-strain relations in OpenSEES
Parameter | Description | Value |
fpc | Concrete compressive strength | 210 kg/cm2 |
epsc0 | Strain at maximum strength of unconfined concrete | 0.003 |
fpcu | Ultimate concrete strength | 42 kg/cm2 |
epsu | Concrete strain at ultimate stress | 0.01 |
lambda | Ratio between unloading slope and initial slope | 0.1 |
ft | Concrete tensile strength | 21 kg/cm2 |
Ets | Concrete tension softening stiffness | 10500 kg/cm2 |
Fig. 3Concrete 02 material: a) nonlinear behavior and b) typical hysteretic stress-strain relation [9]
![Concrete 02 material: a) nonlinear behavior and b) typical hysteretic stress-strain relation [9]](https://static-01.extrica.com/articles/15794/15794-img5.jpg)
a)
![Concrete 02 material: a) nonlinear behavior and b) typical hysteretic stress-strain relation [9]](https://static-01.extrica.com/articles/15794/15794-img6.jpg)
b)
Reinforcing steel is modeled using the Steel 02 material provided by OpenSEES which includes isotropic strain hardening. The behavior of this material is presented in Fig. 4 and numerical parameters which are used to model steel stress-strain relations in OpenSEES are listed in Table 5.
Fig. 4Steel 02 material; hysteretic behavior of model with isotropic hardening: a) in compression and b) in tension [9]
![Steel 02 material; hysteretic behavior of model with isotropic hardening: a) in compression and b) in tension [9]](https://static-01.extrica.com/articles/15794/15794-img7.jpg)
a)
![Steel 02 material; hysteretic behavior of model with isotropic hardening: a) in compression and b) in tension [9]](https://static-01.extrica.com/articles/15794/15794-img8.jpg)
b)
Table 5The parameters which are used to model steel bar stress-strain relations in OpenSEES
Parameter | Description | Value |
Fy | Steel yield stress | 4000 kg/cm2 |
Es | Modulus of steel | 2000000 kg/cm2 |
bs | Strain-hardening ratio | 0.01 |
R0 | Parameter that controls the transition from elastic to plastic branches | 18 |
R1 | Parameter that controls the transition from elastic to plastic branches | 0.925 |
R2 | Parameter that controls the transition from elastic to plastic branches | 0.15 |
2.5. Modeling of the frame element sections in OpenSEES
Fiber sections are selected to define the cross section of the beams and columns in OpenSEES. Two type of concrete materials are defined, confined and unconfined for the beams and columns (Fig. 5). The cover concrete above the stirrups and the longitudinal bars has less strength. Since it is not confined with reinforcements, it will crack soon. Thus, unconfined concrete material are defined to consider the effect of this matter with the unique behavior presented by Mander et al. [10]. As in finite element problems meshing of the sections are essential to have reliable responses, in this study discretization and meshing are performed by patch quad command in OpenSEES platform. Accordingly, beam and column sections are discretized to fine sections as shown in Fig. 5.
Fig. 5Dissection of a rectangular shaped reinforced concrete cross-section [11]
![Dissection of a rectangular shaped reinforced concrete cross-section [11]](https://static-01.extrica.com/articles/15794/15794-img9.jpg)
Fig. 6Stress-strain model implemented for confined and unconfined concrete [10]
![Stress-strain model implemented for confined and unconfined concrete [10]](https://static-01.extrica.com/articles/15794/15794-img10.jpg)
The confinement will increase concrete strength and ductility. The increased strength is defined as confinement coefficient () that depends on the dimension of the cross-section, the diameter and the number of stirrups. Confined concrete material is defined with equations introduced by Mander et al. [10]:
where is the yield stress of steel in MPA, is the width of core concrete, is the height of core concrete, and are respectively area and distance between shearing bars.
Fig. 6 represents the Stress-Strain curves of the confined and unconfined concrete, where strain corresponding to nominal compressive strength is expressed by , and and are defined as strain at the time of failure for unconfined and confined concrete, respectively and is the compressive strength of concrete for confined concrete material, which is calculated according to Eq. (1).
2.6. Modeling the infill walls in OpenSEES
Rigid Frames are commonly used as the load carrying system in Iranian buildings. The beams and the columns are main elements of these kind of systems. Since no practical and generally recognized method has yet been developed to determine the nonstructural components such as architectural walls, and are not usually taken into consideration in the analyses, in this study the infill walls are modeled with frame system. In order to modeling the infill walls in external bay of the frame systems, equivalent diagonal strut model is used based on FEMA-306 [12] definitions. The length of these struts are equal to walls diagonal, their thickness are the same as the thickness of the walls and their equivalent width are calculated based on the following equations [12]:
where is equivalent width of the diagonal strut, is the center to center of the story height, is the height of in-filled wall, is the expected elasticity coefficient of frame material, is the expected elasticity coefficient of infill wall material, is the column’s moment of inertia, is the diagonal length of in-filled wall and is the angle between strut and horizontal axis.
3. The effect of infill walls in the lateral stiffness of RC frame structures
By considering the masonry infill walls based on aforementioned equations and performing the modal analysis for modeled structures in OpenSEES, it is observed that these walls reduced the lateral stiffness of buildings about 20 to 40 percent according to their heights as listed in Table 6.
Table 6Main vibration period of modeled structures with and without considering the infill walls
Building type | Without masonry infill walls (s) | With masonry infill walls (s) | Increasing lateral stiffness (%) |
3 story | 0.537 | 0.32 | 41 |
5 story | 0.661 | 0.464 | 30 |
8 story | 0.86 | 0.687 | 21 |
It can be found from Table 6 that the effect of infill walls in stiffening the structure in 3 story model is more than 5 and 8 story models. However, the Iran earthquake code [5] proposes only 20 % decrease of the main period for in-filled frames, it can be concluded that the effect of infill walls become more important in short structures, so the number of building stories should not be neglected in vulnerability assessment of in-filled RC frames.
4. Structural deficiency modification and propagation of uncertainty
4.1. Uncertainty in material parameters
Treatment of uncertainty in seismic vulnerability assessment has been a subject of research for many years. Many parameters can cause the structural deficiency in structures but the most important parameter especially in RC frame structures is the deficiency created by the poor concrete specifications. The building classes considered in this study use concrete as the construction material and usually the cast-in-place concrete used in building construction in Iran has design strength of 210 kg/cm2 at 28 days. Based on an extensive field investigation done by authors on Iranian as-built RC frame structures, in this study, reduced strength of concrete is considered as structural deficiency. According to the FEMA356 [13] definitions and guidelines for rehabilitation of existing building, based on the suitable combination of destructive and nondestructive concrete tests conducted by authors among 800 residual building with RC frame structure which have the material deficiencies typically built in north of Iran, the compressive strength of concrete is modeled in this probabilistic assessment using a normal distribution with mean value, of 170 kg/cm2 and standard deviation, of 30 kg/cm2 and coefficient of variation, 0.18. Regarding to AIII class reinforcement steel bars, with minimum of 4000 kg/cm2, they assumed to follows a normal distribution too with median value of of 4450 kg/cm2 and standard deviation, of 320 kg/cm2 and coefficient of variation, 0.08. These parameters are adopted in the present study to model the distribution of the concrete strength and the yield strength of the reinforcing bars.
Table 7Earthquake records used in IDA analysis
Earthquake | Record No. | Earthquake | Record No. | ||||
NEHRP Class | Name | NEHRP Class | Name | ||||
D | Landers | 7.3 | R11 | D | Northridge | 6.7 | R1 |
D | Landers | 7.3 | R12 | D | Northridge | 6.7 | R2 |
D | Loma Prieta | 6.9 | R13 | D | Duzce, Turkey | 7.1 | R3 |
D | Loma Prieta | 6.9 | R14 | D | Chi-Chi, Taiwan | 7.6 | R4 |
D | Manjil, Iran | 7.4 | R15 | D | Imperial Valley | 6.5 | R5 |
D | Superstition Hills | 6.5 | R16 | D | Imperial Valley | 6.5 | R6 |
D | Superstition Hills | 6.5 | R17 | D | Imperial Valley | 6.5 | R7 |
D | Cape Mendocino | 7.0 | R18 | D | Kobe, Japan | 6.9 | R8 |
D | Chi-Chi, Taiwan | 7.6 | R19 | D | Kocaeli, Turkey | 7.5 | R9 |
D | San Fernando | 6.6 | R20 | D | Tabas, Iran | 7.4 | R10 |
4.2. Uncertainty in earthquake prediction model
One of the most important step in Incremental Non-linear Dynamic Analysis (IDA) for probabilistic assessment of structures is selection of the ground motions, because the results obtained from analysis are depended widely on the ground motions used in the analysis. Therefore, selecting the suitable pairs of ground motions is extremely sensitive and will affect the proposed fragility functions. The similarity in site characteristics and also the number of required records for IDA analysis are important matters that should be addressed carefully. The more number of ground motion records used for analysis, the more reliable results will be obtained. However, the time needed for performing the analysis will be increased too. So Suitable number of ground motions are needed to cover aleatoric uncertainty of earthquake events for building fragility analysis.
According to recommendation of Shome and Cornell [14], 10 to 20 ground motion records provide acceptable accuracy for estimating the vulnerability of buildings. However, FEMA P695 [15] proposed 22 records of ground motions for building performance assessments. In this study, far-field ground motions recommended by FEMA P695 [15] are used with some minor modifications. The aforementioned 22 ground motions consist of 6 ground motions which are recorded in soil type C according to NEHRP [16]. This soil class is closely similar to soil type II of Iran earthquake code [5], and the other 16 ground motions are recorded in soil type D according to NEHRP [16] which are closely similar to soil type III of Iran earthquake code [5]. Since in this study the assumed soil type for the considered buildings is type III, in order to provide more compatibility between characteristics of ground motions and site characteristic of the considered structures, the aforementioned 6 ground motion records of soil type C in FEMA P695 [15] is replaced with 4 new ground motion records. (Records number 4, 7, 10 and 15 in Table 7). Finally, 20 modified ground motions listed in Table 7 are used in IDA analysis.
5. Fragility curves development for Iranian in-filled RC frame structures considering structural deficiencies
Probabilistic seismic assessment involves the convolution of the demand and capacity models. In this study, the maximum Inter-story drift ratio is considered as Engineering Demand Parameter (EDP). It is assumed that inter-story drift ratio governs the vulnerability of the buildings and they are obtained by the result of IDA that is performed in OpenSEES.
On the other hand, definition of the damage limit states is an important step in the vulnerability assessment too. In this study, damage limit states are considered based on the HAZUS-MH [7] definitions. The corresponding inter-story drift ratio for the slight to complete damage states are listed in Table 8. To generate the fragility curves, a probability distribution for engineering demand parameters obtained from nonlinear IDA should be considered. In this study, lognormal distribution is assumed for both demand and capacity models.
Table 8Maximum inter-story drift ratios for different types of damage states adopted from HAZUS-MH [7]
Inter-story drift ratio | Type | |||
Complete | Extensive | Moderate | Slight | |
0.06 | 0.0233 | 0.0087 | 0.005 | C1L |
0.04 | 0.0156 | 0.0058 | 0.0033 | C1M |
0.03 | 0.0117 | 0.0043 | 0.0025 | C1H |
Each three subclasses of considered structures is analyzed 300 times under 20 ground motion records scaled from 0.1 g to 1.5 g. Then, the fracture probability of each structure is calculated in each level of earthquake intensity from 0.1 g to 1.5 g. When the structural capacity and the seismic demand follow lognormal distributions, the fragility function can be written as a cumulative lognormal distribution function according to equation 6 proposed by Cornell et al. [17]:
where is the probability of reaching to or passing from the damage state of (in this study, maximum inter-story drift), is the standard normal cumulative distribution function, is the lognormal dispersion of maximum interstory drifts, is the mean value of capacity limit state, and is the median value of seismic demand that can be calculated from Eq. (7):
where and are coefficients obtained using regression analysis and is intensity measure (PGA here). The fragility curves are developed for 3, 5 and 8 Story models considering the effects of infill walls and structural deficiency in four levels of damage states (Slight, Moderate, Extensive and Complete) and they are presented in Figs. 7 to 9.
Fig. 7Fragility curves for 3 story model considering the effects of infill walls and structural deficiency
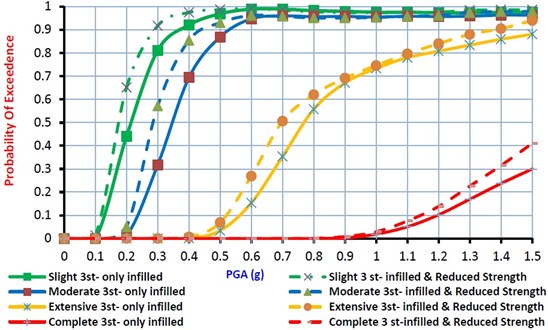
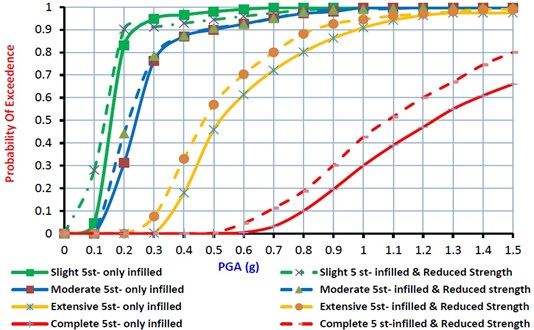
Fig. 8Fragility curves for 5 story model considering the effects of infill walls and structural deficiency
6. Insights from fragility analysis of in-filled RC frame structures
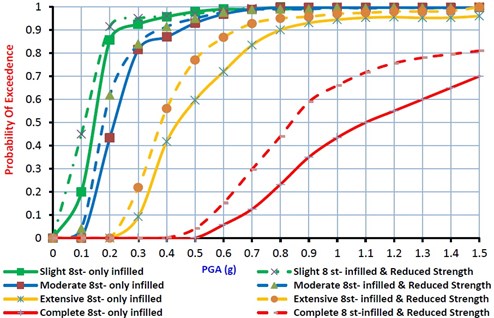
For 3, 5 and 8 story models, fragility curves considering the effect of in-filled walls and structural deficiency are shown in Fig.7 to 9 for the slight to complete damage states. It can be found from these figures that, for 3 story model, the median value of fragilities considering structural deficiency are 85 %, 86 % and 92 % of the fragility median values for buildings without structural deficiency at the slight to complete damage states, respectively. For 5 story model, the median value of fragilities concluding structural deficiency for the slight, moderate, extensive and complete damage states are 87 %, 88 %, 90 % and 85 % of the fragility median values for buildings without structural deficiency at the slight to complete damage states, respectively. Finally, for 8 story model, these median value of fragilities are 78 %, 85 %, 86 % and 76 % of the fragility median values for the normal buildings at slight to complete damage states, respectively. It can be concluded that in comparison with well-constructed RC frame structures, the structures with structural deficiency, considerably have more potential of damages and the material strength safety factors cannot guaranty the safety of the buildings. Moreover, as the number of stories of the RC frame structures increase, the structure seismic vulnerability at four damage states would be increased too.
Fig. 9Fragility curves for 8 story model considering the effects of infill walls and structural deficiency
7. Conclusions
Determination of the structural fragility considering local construction practice and building inventory is essential for assessing earthquake risk. As a consequence, seismic vulnerability of low-rise, mid-rise and also high-rise Iranian in-filled RC frame structures are examined in this study through probabilistic analysis. Fragility curves are generated using IDA for 3D. Analytical models in OpenSEES. The seismic performances of in-filled RC frame buildings are assessed in terms of number of stories considering the structural deficiencies. The damage state probabilities reflect the inherent characteristics of the considered building class. Number of stories seems to be a critical parameter for seismic vulnerability of the considered buildings. Furthermore, Structural deficiencies that are typical to Iranian construction practice lead to poor seismic performances. The proposed fragility curves can be employed for estimation of damages and losses in risk scenarios involving earthquake prone regions in Iran. Finally, the findings can guide future regional risk assessments regarding the importance of including or neglecting the number of stories, in-fill walls and structural deficiency impacts on building vulnerability.
References
-
Jung W. Y., Aref A. J. Analytical and numerical studies of polymer matrix composite sandwich infill panels. Journal of Composite Structures, Vol. 68, Issue 3, 2005, p. 359-370.
-
Decanini L. D., Liberatore L., Mollaioli F. Response of bare and infilled RC frames under the effect of horizontal and vertical seismic excitation. 12th European Conference on Earthquake Engineering, 2002.
-
Ozer B., Erberik A., Akkar S. fragility based assessment of the structural deficiencies in Turkish RC frame structures. First European Conference on Earthquake Engineering and Seismology, Geneva, Switzerland, 2006.
-
Naseri A. Seismic Vulnerability Assessment of the Iranian Existing RC Frame Structures with Probabilistic Methods. M.Sc. Thesis, Pardisan University, Babolsar, Iran, 2013.
-
Building and Housing Research Center. Iranian code of practice for seismic resistant design of buildings (Standard No. 2800). Third Edition, BHRC publication, Tehran, Iran, 2005.
-
Building and Housing Research Center. Iranian code of Design and Construction of Concrete Structures. BHRC publication, Tehran, Iran, 2006.
-
HAZUS-MH MR5. Multi-Hazard loss Estimation Methodology, Earthquake Model. Department of Homeland security, FEMA, Washington, DC, 2003.
-
McKenna F., Fenves G. L. Open System for Earthquake Engineering Simulation (OpenSEES), Version 2.0.0. Pacific Earthquake Engineering Research Center, 2010.
-
Mazzoni S., McKenna F., Scott M. H., Fenves G. L., Jeremic B. OpenSEES Command Language Manual, 2007.
-
Mander J. B., Priestley M. J. N., Park R. Theoretical stress-strain model for confined concrete. Journal of Structural Engineering, Vol. 114, Issue 8, 1988, p. 1804-1826.
-
Elnashai A. S., Pinho R. Antoniou INDYAS – A Program for Inelastic Dynamic Analysis of Structures. Research Report ESEE/00-2, Engineering Seismology and Earthquake Engineering Section, Imperial College, London, 2000.
-
Evaluation of earthquake damaged concrete and masonry wall buildings. FEMA 306, Federal Emergency Management Agency, Washington, DC, 1998.
-
Pre standard and commentary for the seismic rehabilitation of existing buildings. FEMA 356, Federal Emergency Management Agency, Washington, DC, 2000.
-
Shome N., Cornell C. A. Probability Seismic Demand Analysis of Nonlinear Structures. Ph.D. Dissertation, Stanford University, 1999.
-
Quantification of building seismic performance factors. FEMA P695, Federal Emergency Management Agency, Washington, DC, 2009.
-
NEHRP Guidelines for the Seismic Rehabilitation of Buildings, FEMA 273 and NEHRP Commentary on the Guidelines for the Seismic Rehabilitation of Buildings, FEMA 274, Federal Emergency Management Agency, Washington, DC, 1997.
-
Cornell C. A., Jalayer F., Hamburger R. O., Foutch D. A. Probabilistic basis for 533 2000 SAC Federal Emergency Management Agency steel moment frame guidelines. Journal of Structural Engineering, Vol. 128, Issue 4, 2002, p. 526-533.
About this article

