Abstract
Fluid-structure interaction is the interaction of flexible structures with surrounding fluid flow. At systolic phase, the aortic valve’s deformation involves a strong interaction between the valve leaflets and blood flow. This paper models the aortic valve dynamics by developing a fluid-structure interaction simulation of coupling the computational fluid dynamics software FLU-ENT and the finite element analysis software ABAQUS. The model reduces the complexity of calculations by assuming that the valve suffered only transvalvular pressure during systole and performs data exchange between two codes via commercial pre-processing software. A valve geometry model is developed with the valve diameter of 23.5 mm, the leaflet height 10 mm and the leaflet thickness 0.2 mm. The interaction between the valve leaflets and surrounding blood flow results in a complex flow field due to the valve orifice variations during each heart beat. The results highlight an insight of dynamics of the aortic valve during systole. The haemodynamics of the aortic valve under fluid-structure interaction and shear stress distribution of the aortic valve during systolic phase are also discussed in detail.
1. Introduction
Fluid-structure interaction (FSI) in the aortic valve involves a coupling of the blood flow domain with the flexible valve leaflets and the aortic root. It should be noted that to incorporate the complicated material property of the leaflets and compute the complex motion of the leaflets due to the imparted external load are required [1, 2]. Previous numerical models have been developed to study the behavior of the aortic valve but ignoring the fluid-structure interaction effect [3]. It is clear that such analyses could not fully describe the aortic valve haemodynamics under physiological conditions [4-7]. This study aims to study the FSI in the aortic valve using commercial computer-aided design and pre-processing software packages only to operate data exchange between two codes of a computational fluid dynamics (CFD) code and a finite-element analysis (FEA) code.
2. Methodology
The study is conducted according to the assumptions as below.
1) Aortic valve leaflets are suffered only loading from transvalvular pressure (). That is pressure difference between upstream (from left ventricle) and downstream (aorta) regions of a valve during one heart beat.
2) The valve leaflet thickness is uniform.
3) The aortic root wall is rigid.
4) The blood flow is Newtonian fluid.
Main quantity that ABAQUS software received from FLUENT software is the transvalvular pressure () according to assumption (1). Simulation in ABAQUS can operate independently if this transvalvular pressure is pre-known by in-vivo measurement or referring to published works entirely. With re-constructed working domain at each moment, the haemodynamics analysis of the aortic valve will then be implemented in FLUENT software.
It should be noted that the aortic valve leaflet thickness varies from the valve base to the top of free edges [1]. To model such complex thickness is not an easy work. It might increase complexity of the simulation. The valve leaflet geometry can be simply created by providing uniform thickness to a pre-generated leaflet surface according to assumption (2).
The whole configuration consists of valve leaflets connected to an aortic root. The analysis in ABAQUS can concentrate on leaflet deformation only by assuming the aortic root is rigid (assumption (3)).
2.1. Coupling approach of CFD and FEA codes
The weak coupling model assumes that the flow simulation would happen firstly and then the structure simulation follows based on variables from flow simulation. Flow simulation provides fluid variables such as pressure and stress distributing over leaflet surface. After applying above variables, structure simulation provides displacement (deformation), von-Mises stress etc., in return. The updated geometry would then be imported to conduct flow simulation.
FLUENT software starts computing first and sends data (pressure or shear stress) to ABAQUS software then computes one step and sends data (node moving positions or face deformation) back to FLUENT software for the next step. The data exchange is performed totally by utilizing commercial Computer Aided Design (CAD) packages.
The valve leaflets are assumed to suffer the transvalvular pressure only as mentioned above. Therefore, the whole deformation analysis of the valve during systole can be performed when transvalvular pressure is known. In previous study, this weak coupling approach has ever been used to investigate the mechanical behaviors of bio-prosthetic heart valves [2]. This study conducts the deformation analysis in ABAQUS software first by utilizing the pre-known and uses FLUENT software to study fluid dynamics of the flow regime (Fig. 1).
Fig. 1Quasi-steady model to solve FSI problem in the aortic valve during systole
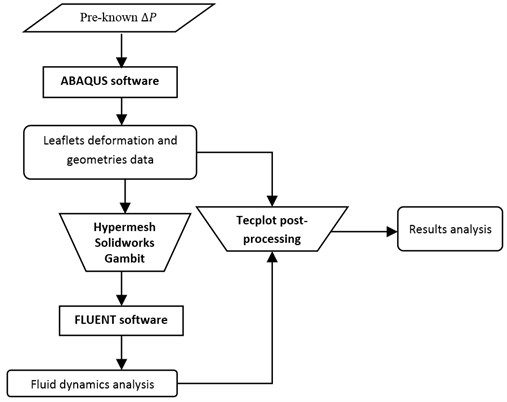
The biomechanics of the valve during whole systolic phase is independently investigated in ABAQUS as described in the paradigm. With the utilization of pre-processing software such as Hypermesh, Solidworks and Gambit, the deformed geometry of the valve leaflet at each moment is then exported to FLUENT for fluid dynamics analysis. The final results which highlight fluid-structure interaction phenomena in the aortic valve during systole are proposed by combining deformation and fluid dynamic analysis in the Tecplot post-processing package.
2.2. Geometry development
The aortic valve consists of three highly flexible leaflets attached to the aortic sinus. There still have studies tried to present a comprehensive report about the dimensions of the valve although the aortic valve has been examined and represented in anatomy texts for centuries. This highlights the fact that the aortic valve geometry has not been completely understood. This may be the reason for various aortic valve models have been developed. According to the model of DeHart et al. [1], the aortic valve geometry (Fig. 2) is determined by four main parameters including the valve radius (), the valve height (), the angle of the bottom surface and the free edge angle ().
This study assumes that the valve base radius () is equal to the valve radius () and the angle is 0 degree to simplify the model.
Fig. 2Valve model [1]
![Valve model [1]](https://static-01.extrica.com/articles/15931/15931-img2.jpg)
Fig. 3Transvalvular pressure [2]
![Transvalvular pressure [2]](https://static-01.extrica.com/articles/15931/15931-img3.jpg)
2.3. Boundary conditions
2.3.1. Transvalvular pressure
Transvalvular pressure () is the pressure difference between upstream (from left ventricle) and downstream (aorta) regions of a valve during one heart beat. This can be the data of experimental measurements or computational calculations. We refer a computational calculation from DeHart et al. [1]’s work that computed transvalvular pressure in a study on effects of collagen fibers on the aortic valve (Fig. 3). The computing in ABAQUS software can therefore be performed independently according to assumption (1).
2.3.2. Inlet velocity and outlet pressure
Boundary conditions in FSI studies of the aortic valve are velocity for inlet and aorta pressure for outlet. The velocity distribution of left ventricle and the aorta pressure are referred to the work of DeHart et al. [1]. At the inflow plane, uniform axial velocity distribution is prescribed. The peak flow reaches 290 ml/s resulting in a Reynolds () number of 3800. At the outflow plane, the system is loaded by a physiological aortic pressure.
3. Results and discussion
3.1. Opening and closing characteristics of normal aortic valve
Theoretically, the aortic valve opens during systole when the ventricle contracts and then closes during diastole as the ventricle relaxes and fills blood from the atrium. Systole lasts about one-third of the cardiac cycle which typically takes about 200 to 300 msec [8]. The systolic phase starts when the aortic valve opens. This study assumes that transvalvular pressure is the only load acting on the valve leaflet during a cardiac cycle. In fact, the aortic valve must suffer diastolic pressure which might result in excessive deformation of the valve leaflets during diastole. The natural valve in reality shows a complex fiber-reinforced composite texture to bear diastolic pressure. The simulation in current study will exclude the diastolic phase.
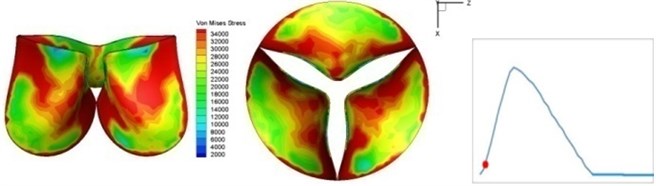
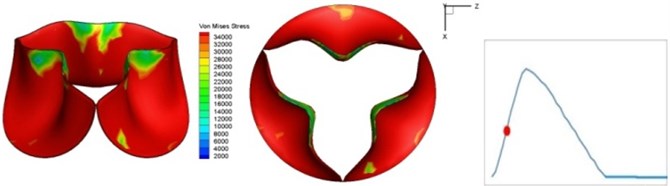
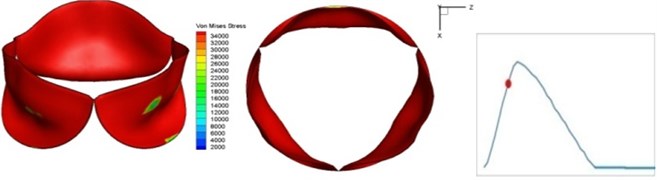
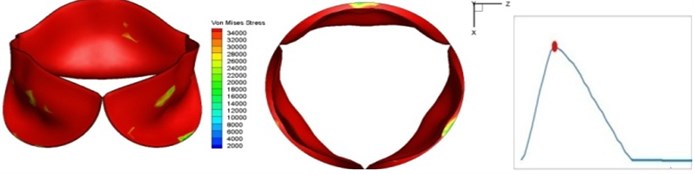
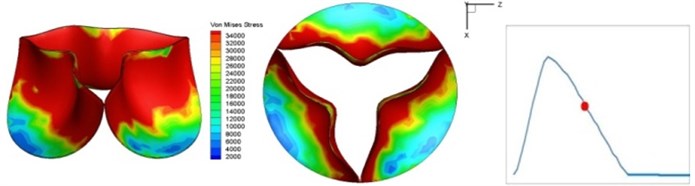
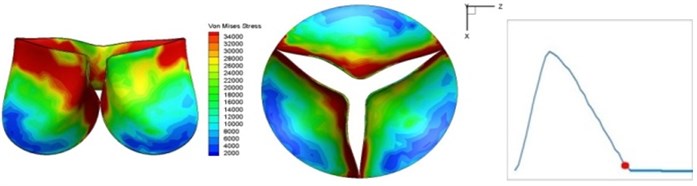
Fig. 4 presents a series of opening and closing behaviors of the aortic valve during systolic phase. The valve starts opening to create a stellular orifice (Fig. 4(b)) at the beginning of systolic phase. The transvalvular pressure is increasing and results in further opening of valve leaflets forming triangular shape of the valve orifice (Fig. 4(c)). The valve is in maximum opening level and the orifice approaches circular shape at 0.08 sec (Fig. 4(d)). The valve starts to close although the flow has not reached the peak at this moment. The blood flow from left ventricle reaches peak at 0.1 sec while the valve is closing already (Fig. 4(e)). The valve continues closing during remaining time of systolic phase and results in orifice form changing to small triangle (Fig. 4(f)) and small triangle to stellular shape (Fig. 4(g)). The valve completely closes at about 0.3 sec (Fig. 4(h)). The opening and closing mechanism of the aortic valve with orifice shape alterations during systolic phase has been described in the previous study [9]. Total opening and closing time of the simulation is about 0.3 sec which completely accords with the results of the theory prediction of Chandran et al. [8]. In other words, the simulation results with the proposed method are rather reliable.
Fig. 4Valve leaflet deformation during systole
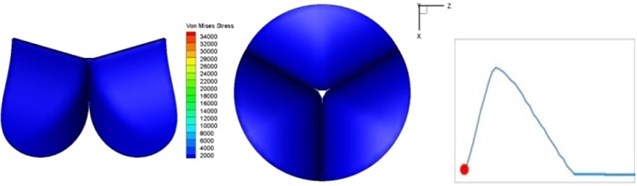
a) 0 s
b) 0.02 s
c) 0.04 s
d) 0.08 s
e) 0.1 s
f) 0.17 s
g) 0.2 s
h) 0.3 s
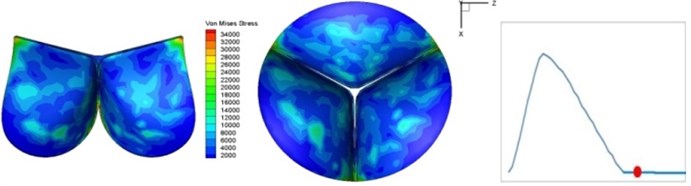
The shape alterations during opening and closing of the aortic valve result in a cyclic stress pattern on the leaflets which is believed to be important in the analysis of fatigue behavior (Fig. (4)). At 0 sec, pressure acting on the valve is zero and therefore no stress found on the leaflets (Fig. 4(a)). The high von-Mises stress concentrates on the middle of the leaflets when the valve further opened (Fig. 4(b)) and the stress is more dominant on the aortic side than that on the ventricular side. The high von-Mises stress tends to a bidirectional spreading from the middle toward both free edges and valve bases from 0.04 sec to 0.08 sec. When the valve in fully opening situation (Fig. 4(d)), the stress almost uniformly distributes on whole surfaces of the leaflets. The stress on the valve begins decreasing from the free edges to the valve bases when the valve starts closing. When the valve is completely closed (Fig. 4(h)), the stress distributed on the whole valve is very small and returns the state nearly like that at 0 sec. This mechanical behavior of the aortic valve repeats cyclically during each cardiac cycle.
3.2. Haemodynamics of the normal aortic valve
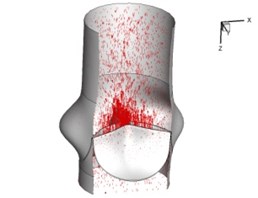
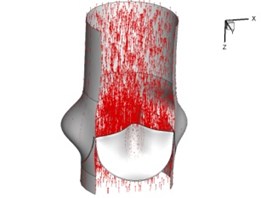
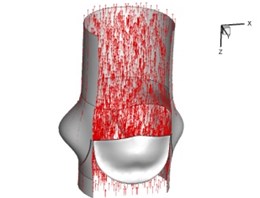
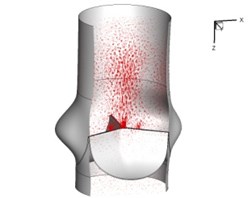
Flow patterns through the aortic valve during systole are demonstrated in Fig. 5. At the beginning, the valve starts to open and forms the stellular orifice (Fig. 5(a)). At 0.04 sec, the blood flow mainly concentrates in the central regime and creates a jet impingement through the orifice to the aortic endothelial linings since the orifice is smaller. At 0.08 sec, the valve almost fully opens and blood flow ejection phenomena occurs (Fig. 5(c)). It should be noted that the aortic valve has already started closing at this moment. The flow ejection could still be observed at 0.1 sec when the flow reaches the peak velocity and the valve is closing already (Fig. 5(d)). The valve closes rapidly and induces a decrease of blood flow during the remaining period from 0.17 sec to 0.3 sec (Fig. 5(e)-(h)).
Fig. 5Flow patterns through the aortic valve
a) 0.02 s
b) 0.04 s
c) 0.08 s
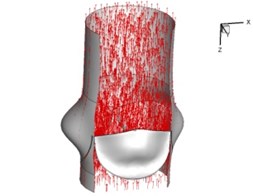
d) 0.1 s
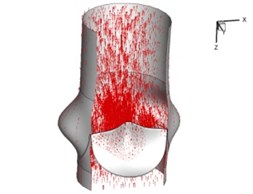
e) 0.17 s
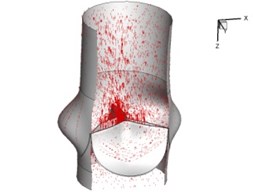
f) 0.2 s
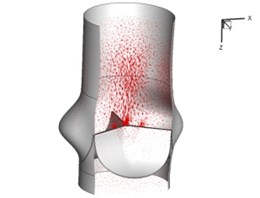
g) 0.26 s
h) 0.3 s
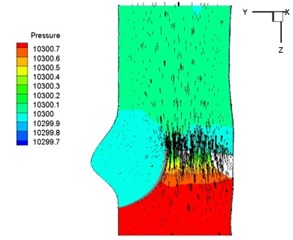
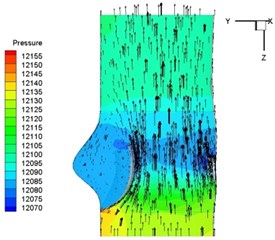
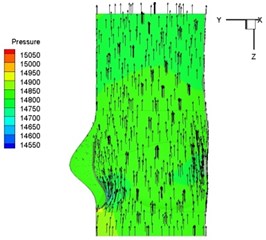
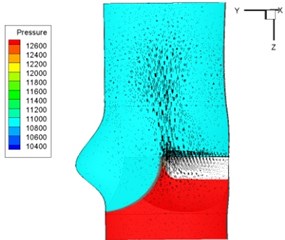
Pressure and velocity distribution on a middle plane of the valve is demonstrated in Fig. 6. It should be noted that during the deceleration period, especially for the moment 0.17 sec (Fig. 6(e)), flow recirculation takes place in front of the leaflets free edges and induces vortex in the sinus cavity. The vortices are expected to create a transverse pressure difference along the leaflets and push them to close during the closing phase.
4. Conclusions
In order to understand haemodynamics and biomechanics of the aortic valve during systolic phase, the study develops a numerical model to analyze the interaction phenomena between the blood flow and the flexible leaflets. The numerical model performs a method to solve FSI in the aortic valve by using commercial software without complicate programming. The interaction between the valve orifice and surrounding blood flow results in a complex flow field. The deformation of the valve orifice during systole in the current simulation is conformed to the results of previous studies. Besides, the blood flow analysis provides deeper understanding on the functionality of the aortic sinus and closing mechanism of the leaflets. On the other hand, the interaction between the fluid and aortic valve also results in different stress alteration on the leaflets during systolic phase. The cyclic von-Mises stress distribution could be important parameters in the further analysis of leaflets fatigue characteristics [10, 11].
Fig. 6Pressure and velocity distribution
a) 0.02 s
b) 0.04 s
c) 0.08 s
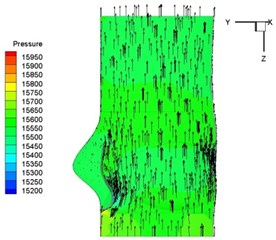
d) 0.1 s
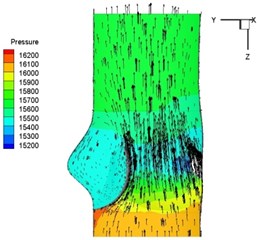
e) 0.17 s
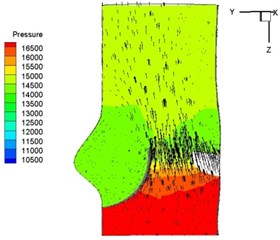
f) 0.2 s
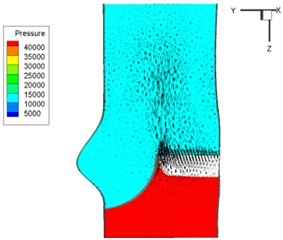
g) 0.26 s
h) 0.3 s
References
-
DeHart J., Peters G. W. M., Schreurs P. J. G., Baaijens F. P. T. Collagen fibers reduce stresses and stabilize motion of aortic valve leaflets during systole. Journal of Biomechanics, Vol. 37, 2004, p. 303-311.
-
Arcidiacono G., Corvi A., Severi T. Functional analysis of bioprosthetic heart valves. Journal of Biomechanics, Vol. 38, 2005, p. 1483-1490.
-
Hsu C. H. Blood flow analysis of polyurethane heart valves at peak systole. Biomedical Engineering – Applications, Basis and Communications, Vol. 18, 2006, p. 13-18.
-
Griffith B. E., Hornung R. D., McQueen D. M., Peskin C. S. An adaptive, formally second order accurate version of the immersed boundary method. Journal of Computational Physics, Vol. 223, Issue 1, 2007, p. 10-49.
-
Morsi Y., Yang W., Wong C., Das S. Transient fluid-structure coupling for simulation of a trileaflet heart valve using weak coupling. Journal of Artificial Organs, Vol. 10, 2007, p. 96-103.
-
DeHart J., Peters G. W. M., Schreurs P. J. G., Baaijens F. P. T. A three-dimensional computational analysis of fluid-structure interaction in the aortic valve. Journal of Biomechanics, Vol. 36, 2003, p. 103-112.
-
Vierendeels J., Dumont K., Verdonck P. R. A partitioned strongly coupled fluid-structure interaction method to model heart valve dynamics. Journal of Computational and Applied Mathematics, Vol. 215, 2008, p. 602-609.
-
Chandran K. B., Yoganathan A. P., Rittgers S. E. Biofluid Mechanics – The Human Circulation. Taylor and Francis Group, 2007.
-
Waite L., Fine J. Applied Biofluid Mechanics. McGraw Hill, 2007.
-
Weinberg E. J., Kaazempur M. R. A multiscale computational comparison of the bicuspid and tricuspid aortic valves in relation to calcific aortic stenosis. Journal of Biomechanics, Vol. 41, 2008, p. 3482-3487.
-
Korakianitis T., Shi Y. Numerical simulation of cardiovascular dynamics with healthy and diseased heart valve. Journal of Biomechanics, Vol. 39, 2006, p. 1964-1982.
About this article

