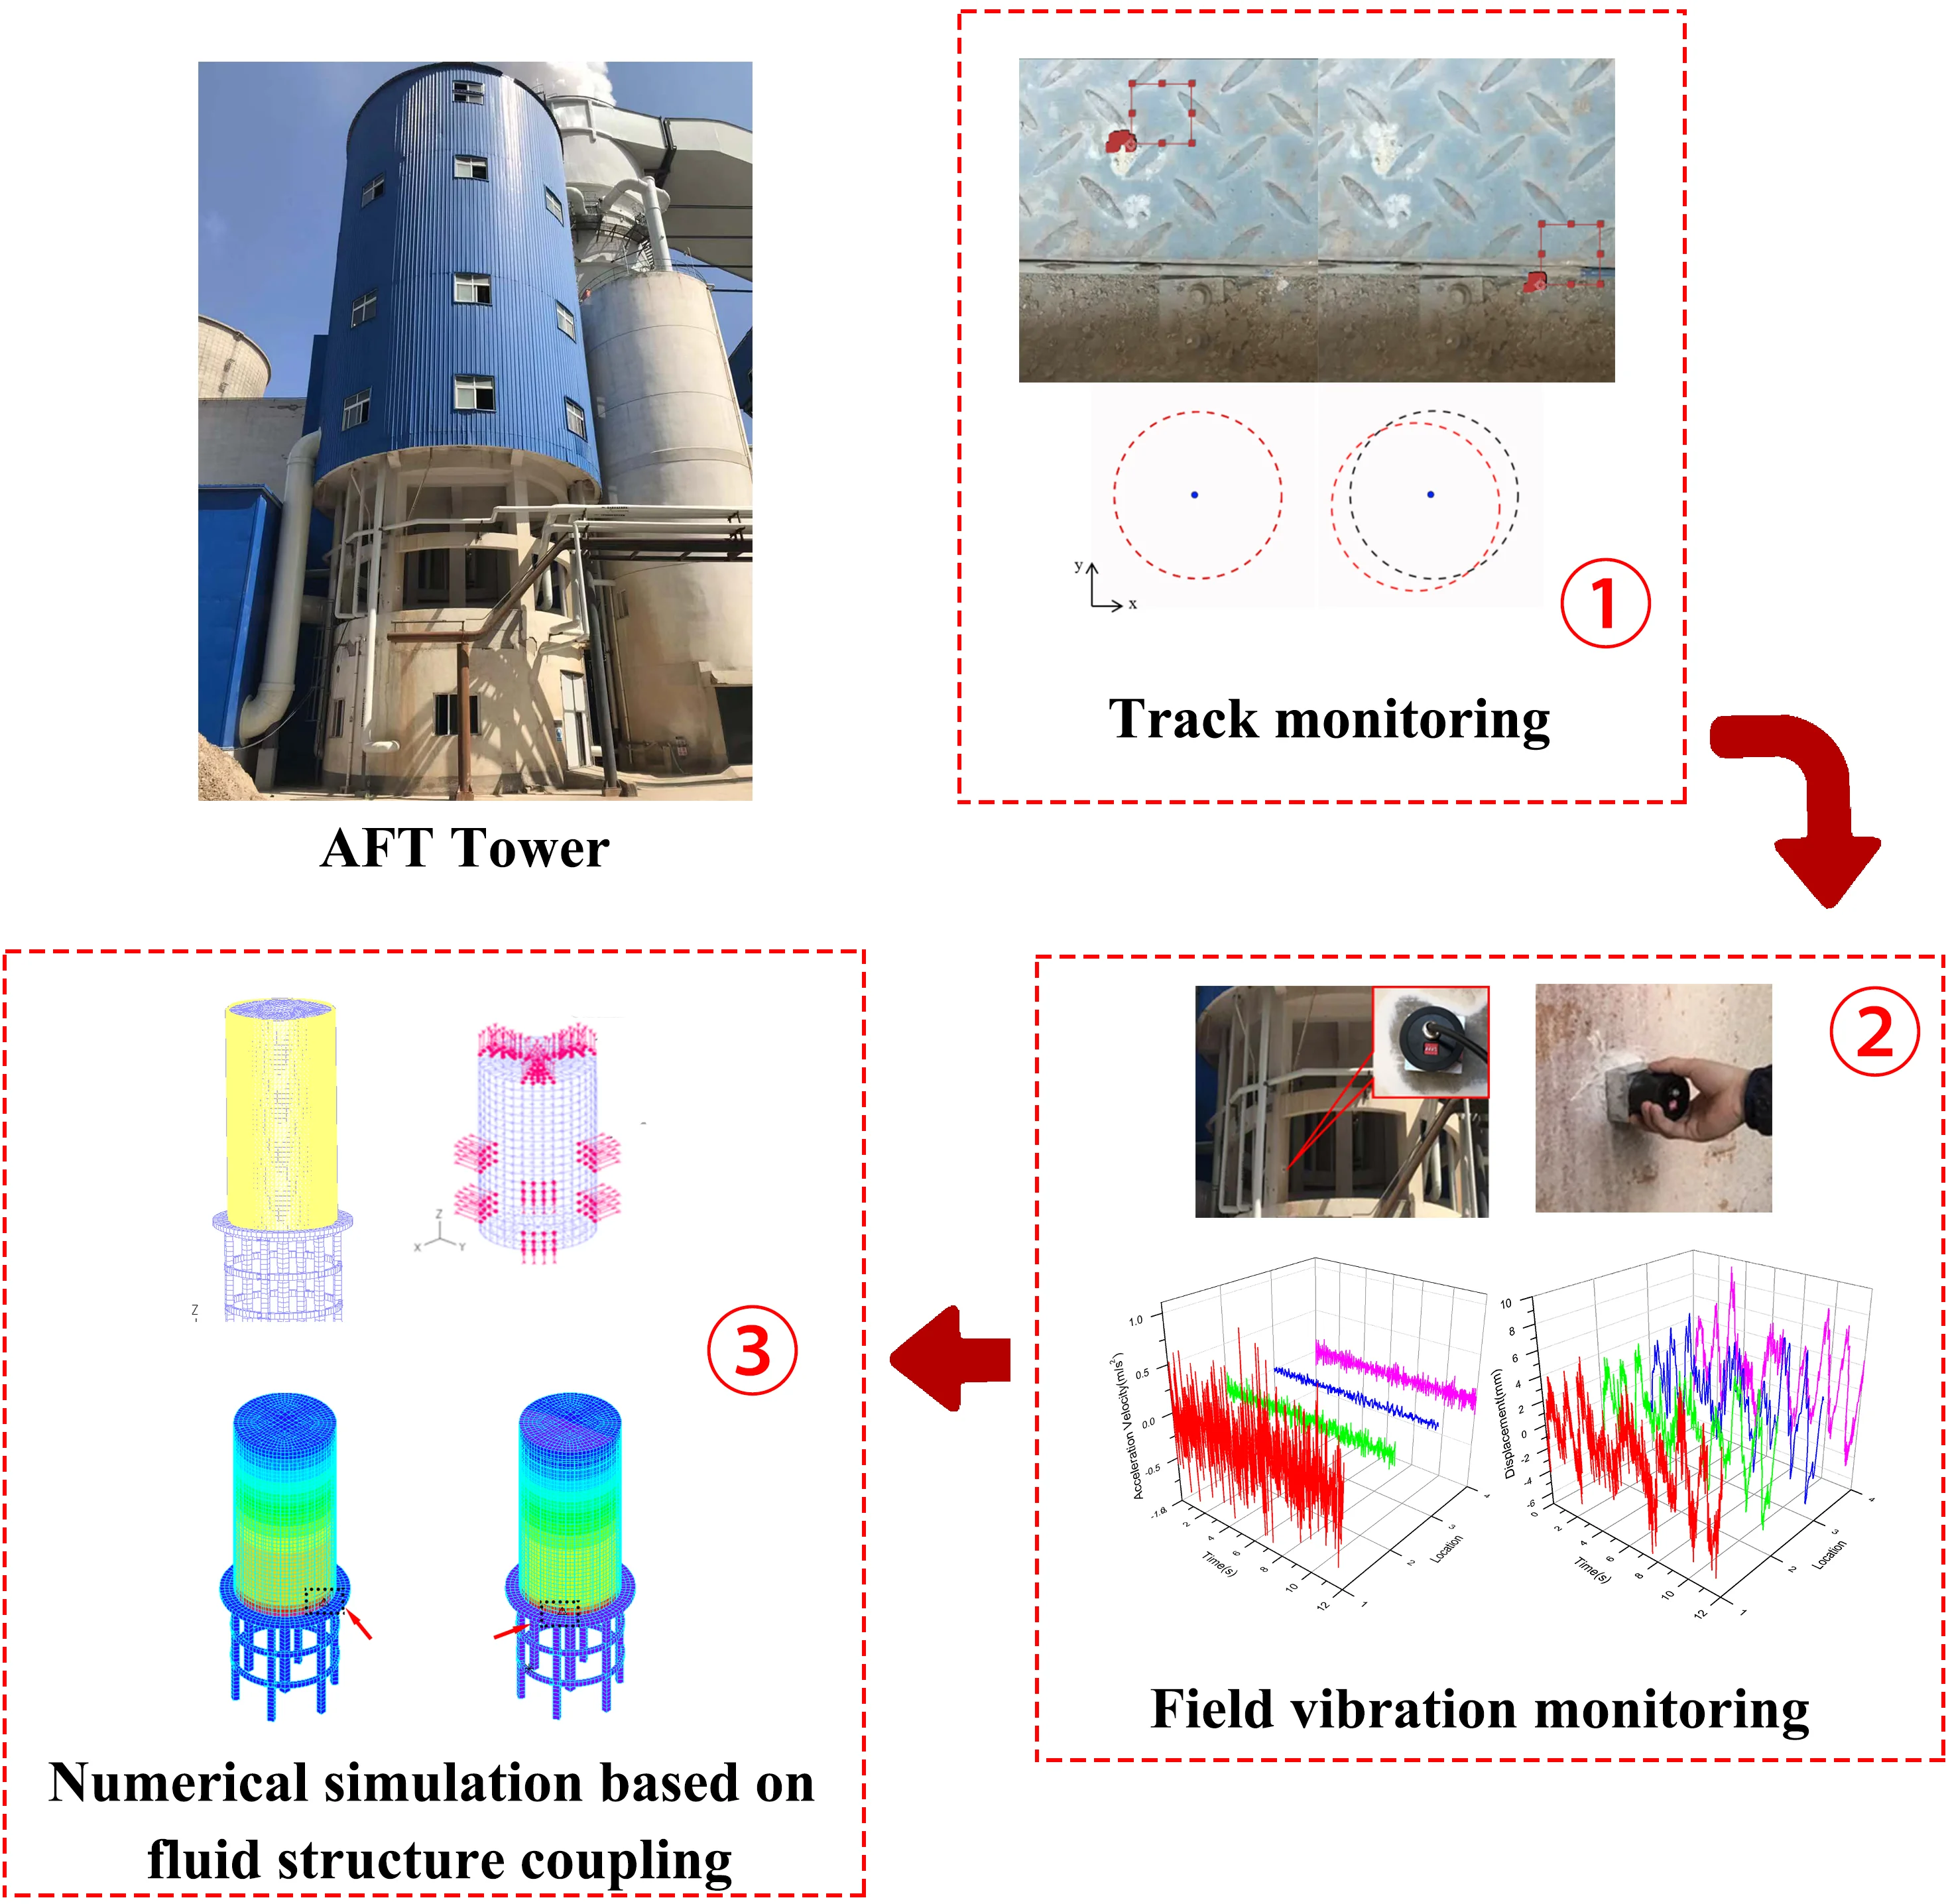
Abstract
Absorber feed tank (AFT tower) is a kind of reinforced concrete structure supported steel tank. It is a composite structure used for desulfurization and cleaning in power industry. A large amount of slurry is sumped in the steel tank, and oxidation air is blown into the tank through a pipe to impact the slurry surface, then the agitator vibrates and disturbs the slurry in the tank. The structure has obvious vibration in daily operation, which is not conducive to the safety of the structure, but also brings greater psychological burden to the staff. Therefore, field monitoring and numerical simulation analysis are carried out for the AFT tower. The field investigation of AFT tower is also carried out. The video monitoring and local monitoring are used to monitor the AFT tower, and the corresponding laws of vibration are explored. A simplified simulation method for this kind of structure is proposed. The model is established with the aid of the fluid structure coupling function of ADINA finite element analysis software to study the vibration characteristics of AFT tower. The results show that the motion trajectory of AFT tower can be determined quickly by video monitoring. The local monitoring can demonstrate that the effect of mixer is the main factor of structural vibration, and the blowing in of oxidation wind intensifies the structural vibration response, resulting in different degrees of damage to the infilled wall between the columns of the structure. By comparing the numerical simulation results with the monitoring results, the reliability of the simplified model is verified, which provides a reference for analyzing the vibration response, damage mechanism and reinforcement design of this kind of structure.
Highlights
- Carry out on-site monitoring of AFT tower. The Law of motion in plane of complex engineering structures are quickly detected by video track monitoring. The on-site micro vibration monitoring has proved the law of structural vibration response and the influence of vibration source.
- The finite element model of AFT tower is established, and the simplified simulation mode of oxidation wind and mixer is proposed, which is verified by the field monitoring results.
- By simulating various loading cases in the numerical model, the vibration response law is found out, which provides a reference for subsequent vibration reduction measures and reinforcement transformation.
1. Introduction
In recent years, with the development of power production technology, the construction requirements of corresponding industrial building structures are also increasing. In the desulfurization process of single tower double cycle [1], in addition to the structure of desulfurization absorption tower, there is also a matching slurry pool structure outside the absorption tower, also known as AFT (absorber feed tank) oxidation fan plant structure (hereinafter referred to as AFT tower). This structure is created by placing the slurry tank on the reinforced concrete frame structure. A mixer is set inside the slurry tank to mix the slurry to keep the slurry suspended to prevent more precipitation. There is an oxidation air channel on the upper part of the slurry tank to blow oxidation air inside to improve the slurry reaction efficiency [2]. The vibration source is complex. On the basis of uneven stiffness distribution of AFT tower, the vibration problem of AFT tower is prominent due to the coupling effect of structure liquid gas three fields.
The research focuses on this kind of structure and includes the vibration characteristics analysis of the structure under the action of fluid, oxidation wind and other vibration sources. At present, in the related research on AFT tower, Chen Jia [3] takes a large side entry stirred tank with a height of 13m as the research object. The results show that the power curve and fluid velocity distribution are in good agreement with the experimental data. Xu Guohui [4] and others studied the influence of the elasticity of the enclosure structure of a large liquid tank on the sloshing impact pressure in the tank. They used the finite element method combined with the explicit time integration method to simulate the motion, deformation and interaction of fluid and structure. Yanxin Xu [5] and others analyzed the causes of abnormal vibration of Xiaoshun Jiang pumping station, and carried out a diagnostic analysis and structural modal analysis combined with frequency spectrum to obtain the discrete time of vibration signal, frequency distribution characteristics of vibration source and structural response.
At present, there are many researches on field monitoring and numerical simulation of structures [6-11]. Dong Xiaofeng [12] analyzed the time-frequency characteristics and variation rules of structural vibration response based on the vibration response data of on-site integral fan structure under shutdown (Startup) and typhoon conditions. According to the characteristics of ice induced vibration of offshore platforms, Wang Yanlin et al. [13] designed an on-site monitoring system to check the damping effect of the damping vibration isolation system, monitored the acceleration and relative displacement responses of the upper and lower decks of the platform, and compared and analyzed the measured data. Rohan [14] used variable sensors and accelerometers for damage detection of long-span bridge structures, combining the advantages of each type of sensor. Zhu Bin [15] and others established a ANSYS / LS-DYNA three-dimensional finite element numerical calculation model by using the field monitoring data, and analyzed the dynamic response characteristics of buried gas pipeline under different operating pressure conditions. Based on many structural vibration reports of substations, Hossein Qarib [16] and others carried out a modal analysis and created an ANSYS 3D two-way fluid structure coupling (FSI) model to conduct a numerical analysis, predicted the vortex-induced vibration effect, and found a method to predict and prevent vibration. Wu Qianqian [17] brought the transient process of sudden increase of load into the structural vibration research system of units and power houses, and analyzed the structural vibration characteristics of hydropower stations. Due to the complex force of AFT structure, the fluid near the impeller of the agitator propels toward the opposite wall in the form of jet. When it reaches the wall, the flow direction of the fluid will change: (1) in the horizontal direction, the fluid is symmetrically divided into two branches, and then flows back to the impeller along the wall; (2) in the vertical direction, most of the fluid flows along the wall. The boiler bottom flows move to the liquid surface, and then they are sucked back to the mixer after reaching the liquid level. As a result, the fluid forms two large rotary flows on both sides of the jet in the horizontal direction and a large circulating flow in the vertical direction. In addition, the simulation or experimental results of Chen Gongguo [18] have similar conclusions.
The research on similar structures of AFT tower mainly focuses on vibration monitoring and fluid structure coupling analysis of single liquid storage tank, while there are few researches on multi-source vibration considering fluid structure coupling. In this paper, the AFT tower of a power plant is taken as the research object to carry out the on-site structural monitoring. The structure slurry model of AFT tower is established by using the ADINA software. The simplified way of agitator disturbance and oxidation wind impact is put forward, and the fluid structure coupling analysis is carried out. The purpose is to explore the vibration source influence mechanism and vibration response law of AFT tower.
2. Engineering background
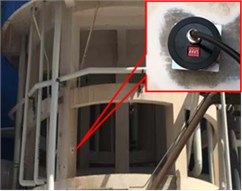
The AFT tower of a power plant in the Chifeng City is selected for this research. By the end of 2020, the AFT tower has been in service for 3 years. The reinforced concrete column at the lower part of the AFT tower is 13 m high, the daily liquid holding height in the upper slurry steel tank is 18 m up to 20 m, and the tank diameter is 11 m, as shown in Fig. 1. At the same time, two layers of six mixers are arranged on the steel tank to stir and oscillate the internal slurry, and three oxidation wind pipes blow wind from above to impact the slurry surface, causing slurry shaking and structural vibration, as shown in part of the equipment diagram in Fig. 2. At the same time, the structure has been in high-temperature alkaline service environment for a long time, the layout of various pipelines connected to the structure is complex, and the structural layout of overweight steel tanks upstairs is not conducive to the structural stability.
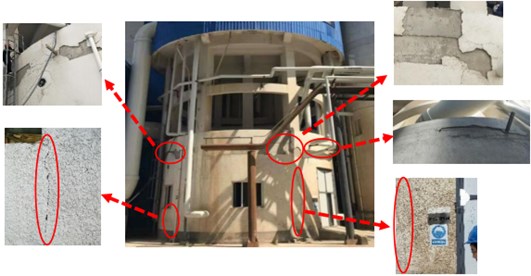
Fig. 1AFT tower site view
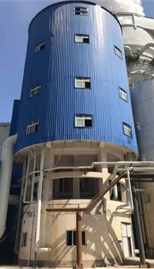
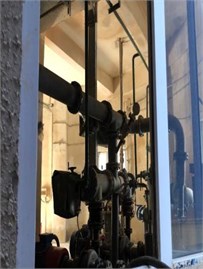
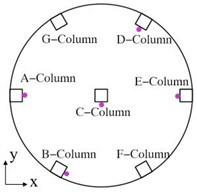
Fig. 2Equipment in slurry tank
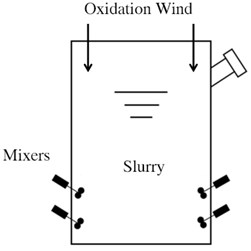
a) Mixers with oxidation wind in facade
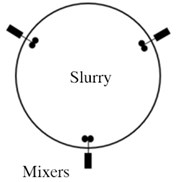
b) Plane layout of mixers
Under the action of long-term vibration of the substructure column, there are obvious cracks and disconnections between the bottom frame column and the filled wall, as shown in Fig. 3. The overall vibration of the structure is obvious.
Fig. 3Cracks at structure bottom
3. Micro vibration monitoring and vibration response analysis of AFT tower
Structural micro vibration monitoring adopts the combination of motion trajectory monitoring and local monitoring. The equipment used mainly include: (1) Nikon D7500 camera and WEIFENG (WT-3520)tripod; (2) 941B vibration pickup (resolution: acceleration 5×10⁻⁶ m/s2, displacement 4×10⁻⁵ m); (3) Dynamic signal test and analysis software; (4) D1000 dynamic system data receiving and acquisition instrument.
3.1. Motion track monitoring and analysis
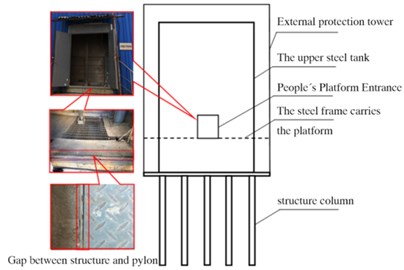
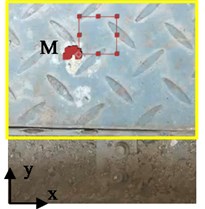
Torsion and in-plane shaking occurs in the overall structure of AFT tower. In order to quickly assess the overall motion of the structure, the AFT tower is monitored and analyzed by means of motion track recording. Spiral steel ladder is arranged outside the steel tank on the upper part of AFT tower and is not firmly connected with AFT tower. The structural elevation of the platform entrance of this steel ladder is 18 m. Fig. 4 contains a schematic diagram of the back elevation of the structure and the relative position of the video monitoring parts. There is a gap between AFT tower and steel ladder at the entrance of external steel ladder platform, but the lighting is good, so video monitoring and measuring points are set here to record the motion track video picture of AFT tower in 28 seconds. The camera is mounted on a tripod and placed on the external landing.
Fig. 4Schematic diagram of structure back elevation and video monitoring position
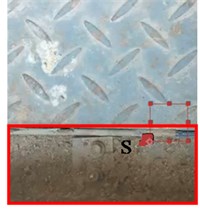
As shown in Fig. 5, the left frame area is the external stairs part, a gap in the AFT tower is permanent, and almost no displacement change takes place under normal conditions. Therefore, the displacement of this area in the video can be regarded as the video jitter area, which interferes with the analysis of the AFT tower motion, so it is filtered. The right frame area belongs to the AFT tower and is the actual movement area. The static point S (located in the stair part) and the moving point M (located in the AFT tower part) marked in the Fig. 5 are selected as the research objects, the motion trajectories of the two marked points are located respectively, and their pixel positions are analyzed frame by frame. The pixel positions of the points change to form a series of points, and the tracks connected by point S and point M.
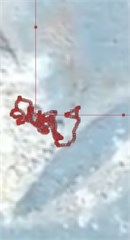
For the motion track of S and M points, a frame image extraction point is taken every four seconds, as shown in Fig. 6. It can be seen that in the first 12 seconds, the trajectory of M point presents a large longitudinal positive displacement, which is mainly affected by the trajectory of S point. It is also necessary to filter the video jitter, so that the trajectory obtained can explain the law of AFT tower motion. The motion of the red circle is traced to the M point, and the motion of the black circle is traced to the S point. After this setting, the M point and the red circle move synchronously, the S point and the black circle move synchronously as well. Finally, the black circle is set as the fixed point, and then the track of the red circle again is the actual motion track of the structure.
Fig. 5Motion track of S and M points; a) M-point trajectory; b) S-point trajectory
a)
b)
Fig. 6Displacement track of S and M points at definite time

a) Displacement of S-point at 0 seconds

b) Displacement of S-point at 12 seconds

c) Displacement of S-point at 20 seconds

d) Displacement of S-point at 28 seconds

e) Displacement of M-point at 0 seconds
f) Displacement of M-point at 12 seconds

g) Displacement of M-point at 20 seconds

h) Displacement of M-point at 28 seconds
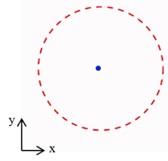
It is assumed that at 0 s, the red circle coincides with the black circle, and the relative position of each moment is drawn. As shown in Fig. 7, in the first 12 seconds, the relative displacement is small, and the motion frequency is large, so the reset phenomenon occurs. The movement track of the last 8 seconds is kept at the lower left, and the relative displacement is large and difficult to reset. This phenomenon is reasoned by the unbalanced disturbance force on the upper structure, which is dominated by the mixing effect and intensified by the oxidation wind. According to the video track monitoring, the motion law of AFT tower can be quickly obtained, causing the superposition of the trajectories of in-plane shaking, in-plane torsion and eccentric motion.
3.2. AFT structural vibration monitoring and vibration response analysis
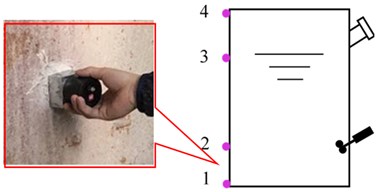
The monitoring equipment adopts a D10000 data receiving and acquisition instrument with a dynamic system, 941B vibration pickup to monitor acceleration and displacement, where 9 monitoring points are set. The track monitoring described in Section 3.1 revealed that the AFT tower has a large displacement in the lower left direction. Therefore, the following arrangements are selected: the bottom of AFT structure is symmetrically arranged along the center of the middle column, and the upper steel tube of AFT is arranged with 4 vertical measuring points (1, 2, 3 4) which correspond to the bottom of steel tank, mixer on the first floor, liquid level of slurry and top of steel tank, with elevations of +13 m, +18.5 m, +29 m and +34.5 m respectively, as shown in Fig. 8.
Fig. 7Schematic diagram of AFT tower movement track
a) 0 seconds

b) 12 seconds

c) 20 seconds

d) 28 seconds
Two structural monitoring conditions are set: 1) monitor the displacement and acceleration of the frame column and steel tank of AFT tower when oxidation wind blowing is provided; 2) In case of no oxidation wind blowing, the vibration displacement of AFT tower frame column is monitored clearly.
Fig. 8Layout of acceleration and displacement measuring points
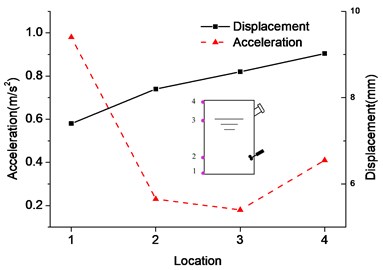
The on-site monitoring results are sorted out. Under working condition 1, the acceleration and displacement time history curves of measuring points 1, 2, 3 and 4 along the vertical direction of the steel tank are shown in Fig. 9, the distribution of the maximum acceleration and displacement of measuring points is shown in Fig. 10. The maximum acceleration at the bottom of the steel tank is 0.9782 m/s2, the acceleration at each point decreases first and then increases along the height of the steel tank, and the minimum acceleration is at the structural height corresponding to the slurry level.
Fig. 9Monitoring data of slurry tank
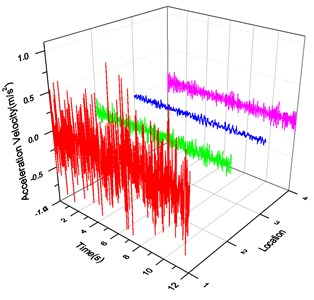
a) Acceleration time history curve
b) Displacement time history curve
Fig. 10Peak distribution of acceleration and displacement at measuring points of slurry tank
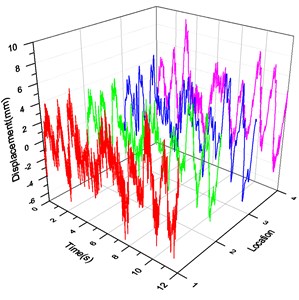
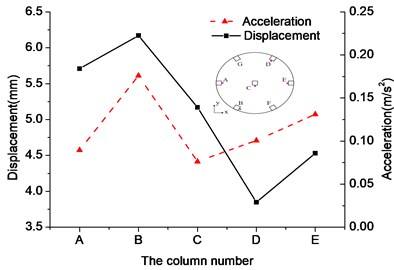
The acceleration and displacement time history curves of the five frame columns monitored under condition 1 are shown in Fig. 11, and the positive peak changes of displacement and acceleration of each column are shown in Fig. 12. It can be seen from Fig. 12 that the distribution of displacement and acceleration of each column is uneven, and there is serious uneven shaking in the AFT tower. Among them, the displacement and acceleration of column B are the largest, with the positive peak value of displacement up to 6.17 mm and the positive peak value of acceleration up to 0.176 m/s2. It can be seen that column B is easy to be damaged in daily service, so it is taken as an important research object below.
Fig. 11Monitoring data of frame column
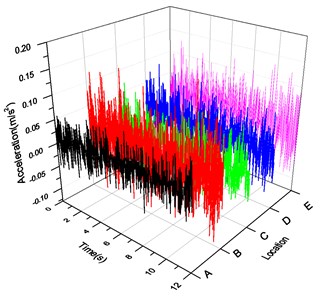
a) Acceleration time history curve
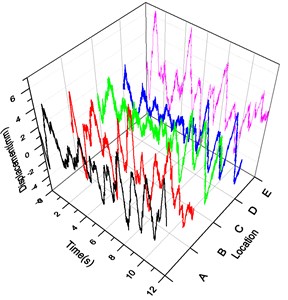
b) Displacement time history curve
Fig. 12Peak distribution of acceleration and displacement at measuring points of frame column
The lower frame of AFT tower belongs to the weak part of the structure. The spectrum analysis of the acceleration time history curve of five frame columns is shown in Fig. 13. It can be seen that the excellent frequency of column A is 11.56 Hz, and the amplitude is 0.011 m/s2. The acceleration frequencies of other columns are mainly distributed in the narrow range of 15-20 Hz, showing multiple peaks and irregular shape. The results can provide a reference for vibration reduction and isolation measures and mixer selection.
Fig. 13Spectrum analysis of frame column acceleration
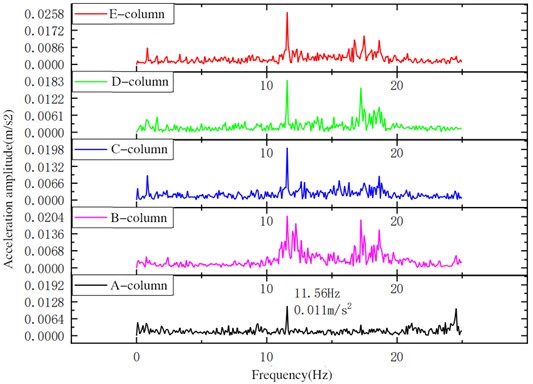
Fig. 14Comparison of peak displacement of frame column
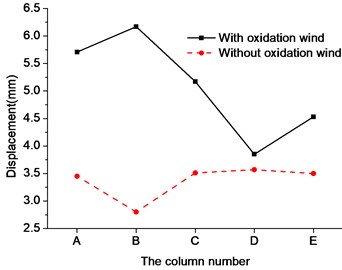
The peak displacement response of structural column with or without oxidation wind obtained by monitoring is drawn in Fig. 14. According to Fig. 14, the maximum difference of displacement response peak value between columns without oxidation wind is 0.77 mm, with a difference of 21.5 %. Under the action of oxidation wind, the maximum difference of displacement response peak between columns is 2.32 mm that equals 37.6 %. It can be seen that the effect of oxidation wind intensifies the slurry shaking, resulting in serious differences in the stress distribution between the lower frame columns. Among them, the difference of B column is the largest, the fluctuation of displacement amplitude can reach 55.34 %, so the difference of D column is the smallest, and the torsional trend of the lower part of the structure is enhanced.
In conclusion, it is proved that the slurry shaking caused by the mixer is the main factor of AFT tower vibration, while the oxidation wind blowing into the slurry surface intensifies the slurry shaking and increases the AFT tower vibration, which is the secondary factor of vibration.
4. Simplified finite element simulation method for verification of AFT tower reliability
In order to establish reasonable construction parameters in the design stage of the proposed AFT tower and take corresponding vibration reduction measures in the maintenance stage of the existing AFT tower, it is necessary to establish a corresponding numerical model that can correctly reflect the structural dynamics. In this paper, the numerical model of AFT tower is established with the help of ADINA finite element simulation software, and the simplified simulation mode of mixer operation and oxidation wind impact action is proposed. Compared with the monitoring data, the reliability of the model and simplified method is verified.
4.1. Fluid structure coupling method
ADINA finite element analysis software has strong fluid structure coupling analysis ability. For fluid structure coupling calculation in ADINA software, it is necessary to establish a structural model, fluid model and FSI boundary in the structure module (ADINA structure) and fluid module (ADINA CFD). Then the two models are put together in ADINA fluid structure interaction coupling Solver (ADINA-FSI).
The basic conditions applied to the fluid structure coupling interface are kinematic conditions (also known as displacement coordination), see Eq. (1), and dynamic conditions (also known as force balance), see Eqs. (2):
where and represent the displacement of fluid and structure respectively, and represent the stress of fluid and structure respectively. The underline indicates that these values are only defined on the fluid structure coupling interface.
The position of fluid nodes on the fluid structure coupling interface is determined by kinematic conditions, and the displacement of other nodes is automatically determined by the program. According to the dynamic conditions, on the fluid structure coupling interface, the distributed force of the fluid is integrated as a concentrated force and applied to the structural nodes according to Eq. (3):
where is the displacement of structural nodes.
Iterative method means that the fluid equation and structural equation are solved iteratively with each other in order. The results obtained in each step of the two equations are also solved iteratively with each other in order. Then these results are provided to the other part for use until convergence is reached, and the iteration stops. In bi-directional coupling problems, this iterative coupling method occupies less memory than direct calculation, and is suitable for solving complex problems.
4.2. Simplified AFT tower numerical simulation method
Based on the field structure of AFT tower, the calculation model is established by using ADINA finite element analysis software. The elevation of the concrete bottom plate at the lower part of the structure is 13.0 m, and the elevation of the top of the upper steel tank is 34.5 m. The bottom plate of the steel tank is made of shell unit concrete, with the thickness of the inner ring of 500 mm and the outer ring of 120 mm. The bottom column is 13000 mm high, and the cross section of the middle column is 400 mm×400 mm, that of the side post is 350 mm×350 mm. The structure slurry boundary is set as the fluid solid coupling boundary condition, that is represented by the yellow area shown in Fig. 15, and the slurry surface is set as a free surface. The structural column and ring beam are meshed by 8-node 3D solid element and connected by rigid link. The slab is also divided by 8-node 3D solid element. The adjacent nodes of column and beam slab are rigidly connected and deformed cooperatively. The slurry is divided into 12 parts along the circumferential direction and 10 parts along the height. It is divided into 4080 units by 8-node 3D fluid units. The loading time is 12 s. The calculation model is shown in Fig. 15. The specific material calculation parameters are shown in Table 1. A flow condition based interpolation method, abbreviated as FCBI, is used for the fluid element calculation. The FCBI is a special case of the finite volume method. It locally satisfies the conservation of mass and momentum, and satisfies the upwind condition by interpolation of velocity. Compared with other element algorithms, the FCBI element usually has better stability and accuracy.
Fig. 15AFT tower calculation model: AFT-Structure model and AFT-CFD model
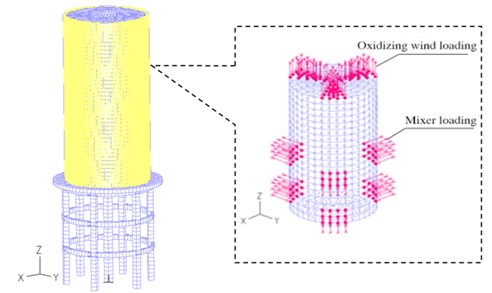
Focused on the AFT structure, a simplified simulation method of mixer and oxidation wind is proposed to improve the calculation efficiency. The loading height of the first layer mixer is 13-15 m, the loading height of the second layer mixer is 19-21 m, there are three mixers in each layer. Fig. 15 shows the relative position of the mixer and the loading diagram of the mixer and the oxidation wind. In the numerical simulation, the slurry at the action position of the mixer is loaded by jet, that is, the slurry is loaded with acceleration load.
Table 1Model calculation parameters
Elastic modulus / Pa | Poisson’s ratio | Density / (Kg/m3) | |
Concrete | 3.1×10¹⁰ | 0.2 | 2550 |
Steel | 2.06×10¹¹ | 0.3 | 7850 |
Viscosity | Density | ||
Fluid | 0.02 | 1250 |
Table 2Comparison of loading case
Case | Oxidation wind supplied | Simulation loading size of mixer / (m/s) |
a | no | 1 |
b | yes | 1 |
c | no | 2 |
d | yes | 2 |
It can be seen from the monitoring data that the blowing in of the oxidation wind increases the vibration response of the structure, that is, the disturbance effect on the slurry is strengthened. Therefore, the wave making theory is used to simulate the effect of the oxidation wind, and three slurry levels with the action of the lower mixer are selected to apply sinusoidal loads. The loading size of mixer and oxidation wind numerical simulation needs to consider various factors such as mixer model and speed, oxidation wind speed, wind duct diameter, slurry density, steel tank diameter, etc. Therefore, the loading conditions of oxidation wind shall be controlled unchanged during calculation, so the calculation condition can be set by changing the loading size of mixer. Through the test of various calculation conditions, the loading mode with cycle of 2 s and amplitude of 1.5 m/s is more suitable. Similarly, the mixer is loaded at 1 m/s and 2 m/s. Because the structure monitors the working condition to suspend the oxidation wind blowing in, in order to keep the consistency during the simulation, the conditions of with and without oxidation wind are considered independently. Therefore, the calculation is divided into four working conditions shown in Table 2.
4.3. Verification and analysis of fluid structure coupling simulation results
The numerical simulation results are analyzed. The data of the steel tank bottom , upper mixer, liquid level and tank top along the vertical height are extracted, and the positions are marked as points 1, 2, 3 and 4, which are the same as the monitoring points. The horizontal displacement peak, acceleration peak and field monitoring data peak of four points under different cases are extracted and plotted in Fig. 16.
Fig. 16Comparison of peak displacement and acceleration along tank height under different cases
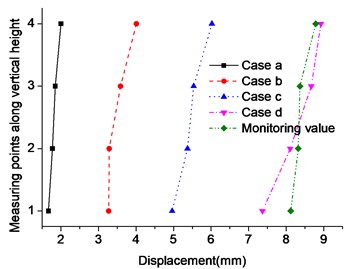
a) Peak displacement along tank height
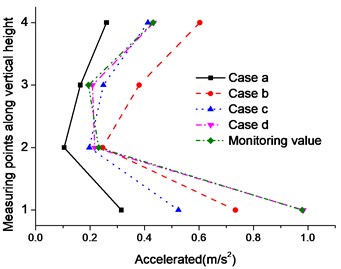
b) Peak accelerated velocity along tank height
According to Fig. 16, the average difference between the displacement simulation results of the four points under case d and the field monitoring is 0.345 mm, while the average difference between the acceleration simulation results and the field monitoring is 0.0087 m/s2, which basically verifies the reliability of the numerical model.
With the change of loading mode, the overall displacement increases gradually, and the displacement increase in case d is the most significant, which is nearly 60 % higher than that in case c. Therefore, when the mixer runs at a high speed, the impact of oxidation wind on the slurry surface will significantly increase the displacement response of the whole structure. The acceleration response law obtained by simulation is the same as the trend of field monitoring results. Since the bottom of the steel tank abruptly changes its structural stiffness, the maximum acceleration is here. Affected by the liquid damping effect in the tank, the acceleration distribution of the steel tank decreases first and then increases along the vertical direction. Comparing the acceleration response cases a, b and c, it can be seen that the effect of oxidation wind on acceleration response is much more significant than that of single mixer.
The simulated peak displacement of the supporting frame column at the lower part of AFT tower under different cases and the displacement peak obtained by field monitoring are drawn in Fig. 17. It can be seen that the simulation results cases c and d are in good agreement with the corresponding monitoring displacement data, with an average difference of 0.22 mm and 0.3 mm respectively, indicating that the established finite element model can accurately simulate the dynamic response of the lower frame and provide a reference for the subsequent reinforcement and reconstruction of the structure.
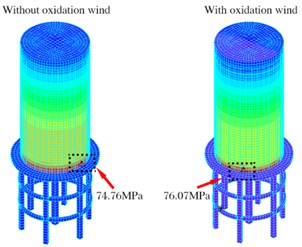
The cloud diagram of structural equivalent force is drawn in Fig.18 under cases c and d for 12 s. Affected by a sudden change in stiffness, the maximum stress value of the structure under the two cases appears close to the bottom of the steel tank, but it does not exceed the allowable stress value of the steel. The daily operation of the machinery inside the AFT tower will not cause a structural damage. Considering the action of oxidation wind, the maximum equivalent stress increases by only 1.31 MPa. The effect of oxidation wind is still mainly reflected in aggravating the vibration response of the structure.
Fig. 17Comparison of peak displacement of frame column under different cases
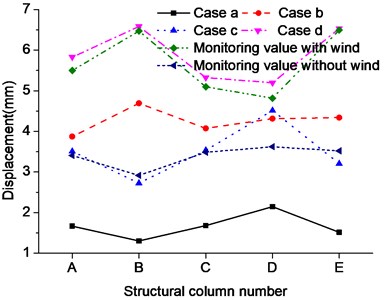
Fig. 18Cloud diagram of equivalent stress
5. Conclusions
Aiming at the vibration problem of AFT tower, a simplified AFT structure slurry coupling simulation method is proposed and verified based on the on-site structural micro vibration monitoring. The main conclusions are as follows:
1) Through the dynamic video analysis of the structure, the law of the motion trajectory of the structure is studied. The results show that the motion of AFT tower is the superposition of in-plane shaking, in-plane torsion and eccentric motion. For the complex AFT tower structure, the on-site video monitoring method can quickly determine the structural trajectory.
2) According to the local acceleration and displacement monitoring of the structure, the vibration response of different parts of the structure is quantitatively analyzed. It shows that the main vibration source of AFT tower is the mixer in the slurry tank. The vibration of the structure is mainly caused by the action of the mixer in the steel tank. The impact of oxidation wind on the slurry intensifies the structural vibration and adds uncertainty to the structural vibration. The uneven stress of the structure causes different degrees of damage to the columns at the bottom of the structure.
3) A simplified simulation method for the interaction between mixer and oxidation wind is proposed, and the reliability of this method is verified. It can provide a reference for the analysis of vibration response, damage mechanism and reinforcement of existing structures.
References
-
Li Y. and Yang Z. Z., “Influencing of key factors on lime-gypsum wet flue gas desulfurization and two circulations per tower technology,” Environmental engineering, Vol. 34, No. 1, pp. 69–73, 2016, https://doi.org/10.13205/j.hjgc.201601015
-
Han P. et al., “Mechanism modeling for forced oxidation system of flue gas desulfurization device,” Journal of North China Electric Power University, Vol. 5, pp. 60–63, 2006, https://doi.org/10.3969/j.issn.1007-2691.2006.05.015
-
J. Chen and W. Xiao, “Solids suspension study in a side-entering stirred tank through CFD modeling,” International Journal of Chemical Reactor Engineering, Vol. 11, No. 1, pp. 331–346, Jul. 2013, https://doi.org/10.1515/ijcre-2012-0062
-
Xu G. H. and Gu X. K., “Investigation to the numerical simulation for sloshing in tanks considering fluid-structure interaction,” Journal of Ship Mechanics, Vol. 16, No. 5, pp. 514–522, 2012, https://doi.org/10.3969/j.issn.1007-7294.2012.05.008
-
Y. Xu, C. Shao, D. Zheng, and J. Qiu, “Advanced materials and designs for hydraulic, earth, and aerospace structures,” in 15th Biennial ASCE Conference on Engineering, Science, Construction, and Operations in Challenging Environments, Jan. 2016, https://doi.org/10.1061/9780784479971.089
-
Z. Li, L. Zhang, X. Zhu, H. Gu, and Z. Jiang, “Design and validation of wireless dynamic testing system for bridge based on the 941B type vibration sensor,” in 9th International Conference of Chinese Transportation Professionals (ICCTP), pp. 211–218, Jul. 2009, https://doi.org/10.1061/41064(358)30
-
Shi Y. C. et al., “Rapid evaluation method for blast damage of reinforced concrete columns based on measured frequency,” Journal of Building Structures, Vol. 42, No. 11, pp. 155–164, 2021, https://doi.org/10.14006/j.jzjgxb.2019.0664
-
Jiang Xinliang et al., “Shaking table test method for equipment-structure dynamic interaction,” Journal of Vibration and Shock, Vol. 38, No. 3, pp. 108–115, 2019, https://doi.org/10.13465/j.cnki.jvs.2019.03.016
-
J. Guo and C.A. Zhu, “Dynamic displacement measurement of large-scale structures based on the Lucas-Kanade template tracking algorithm,” Mechanical Systems and Signal Processing, Vol. 66-67, pp. 425–436, Jan. 2016, https://doi.org/10.1016/j.ymssp.2015.06.004
-
Zhao C. et al., “A study on identification of dynamic characteristic parameters of a transmission tower under ambient excitations,” Journal of Vibration and Shock, Vol. 40, No. 4, pp. 30–35, 2021, https://doi.org/10.13465/j.cnki.jvs.2021.04.005
-
Huang G. J., “Study on frequency lock-in resonance in ice-induced vibration,” Chinese Journal of Theoretical and Applied Mechanics, Vol. 53, No. 3, pp. 693–702, 2021, https://doi.org/10.6052/0459-1879-21-087
-
Dong X. F., Lian J. J., and Wang H. J., “Monitoring experiment and characteristic analysis of structural vibration of offshore wind turbine,” Journal of Tianjin University (Natural Science and Engineering Technology Edition), Vol. 52, No. 2, pp. 191–199, 2019, https://doi.org/10.11784/tdxbz201708007
-
Wang Y. L. et al., “Ice-induced vibration control effectiveness evaluation for offshore platform based on field monitoring,” Journal of Vibration and Shock, Vol. 31, No. 7, pp. 39–45, 2012, https://doi.org/10.3969/j.issn.1000-3835.2012.07.009
-
R. Soman, M. Kyriakides, T. Onoufriou, and W. Ostachowicz, “Numerical evaluation of multi-metric data fusion based structural health monitoring of long span bridge structures,” Structure and Infrastructure Engineering, Vol. 14, No. 6, pp. 673–684, Jun. 2018, https://doi.org/10.1080/15732479.2017.1350984
-
Zhu B. et al., “Effect of excavation blast vibration on adjacent buried gas pipeline in a foundation pit,” Journal of Vibration and Shock, Vol. 39, No. 11, pp. 201–208, 2020, https://doi.org/10.13465/j.cnki.jvs.2020.11.027
-
Qarib H. and Mohamed D., “Analysis, prediction, and mitigation of vortex induced vibrations in substation structures,” in Electrical Transmission and Substation Structures, 2018, https://doi.org/10.1061/9780784481837.0
-
Wu Q. Q. et al., “Vibration characteristics of the unit-plant of a hydropower station under transient load-up process,” Journal of Vibration and Shock, Vol. 38, No. 18, pp. 53–61, 2019, https://doi.org/10.13465/j.cnki.jvs.2019.18.008
-
Chen G. G. et al., “Numerical simulation of influence of the agitator parameter on the field characteristics and the power in a side-entering stirred reactor,” Journal of Beijing University of Chemical Technology (Natural Science Edition), Vol. 39, No. 3, pp. 29–34, 2012, https://doi.org/10.3969/j.issn.1671-4628.2012.03.006
About this article

Supported by: The Natural Science Foundation of China (No. 52078038); The National foreign expert project of the Ministry of Science and Technology (No. G2021105009L).
