Abstract
Compared with a conventional propulsion system, an electromagnetic railgun is characterized by an in-bore pulsed high magnetic field. However, the dynamic distribution of the magnetic field in the projectile has rarely been experimentally studied. To this end, this paper discusses the possibility of utilizing magnetic field environment information. An equivalent model of an electromagnetic railgun is established by using the finite element method. Based on the magnetic diffusion equation and the Biot-Savart law, the in-bore magnetic induction is determined. The velocity skin effect and projectile shielding are considered in the model. Furthermore, the magnetic measurement method is presented to validate a simulation result. The results obtained from the simulation and experiment show that package shielding affects the pulse width and amplitude of the internal value. The peak magnetic induction of low carbon steel and copper is reduced by 33.6 %, and the pulse width lags by 2.7 ms. Moreover, projectile shielding has a substantial influence on the timing accuracy during launch, and the time error reaches approximately 18 %. Therefore, the in-bore magnetic field is a practical signal for the control module since it considers the influence of different projectile shields.

Highlights
- During electromagnetic launch, the distribution of magnetic induction decreases with increasing distance from the armature, and the magnetic field signal in the railgun can be used to judge the muzzle time.
- The projectile package affects the amplitude of interior magnetic induction. The peak magnetic induction of 1008 steel decreases by 7%. Magnetic and conductive materials have a better composite shielding effect than other materials, and the magnetic induction decreases by 33%.
- Different packaging materials affect the pulse width of the internal magnetic field to different degrees. The pulse width of the permeable magnetic material is shorter than that without shielding. The pulse width of the conductive material is longer than that without shielding.
1. Introduction
An electromagnetic railgun launch can accelerate objects to ultrahigh speeds [1], [2]. With the help of the electromagnetic force generated by a high magnetic field and large current, 2,000 m/s or higher muzzle velocity can be achieved in a few milliseconds, easily exceeding the speed limit of traditional chemical propulsion technology [3]. To achieve an accurate strike, intelligent designs are being developed for the launch load of electromagnetic railguns [4]. However, high current exists in the rail and armature during launch, which produces an in-bore pulsed high magnetic field [5], [6]. To optimize the intelligent launch load, it is necessary to understand the pulsed high magnetic field.
Early studies mainly focused on the magnetic field around the armature [7]-[9]. Zielinski [10] and Li [11] studied the spatial magnetic induction distribution around the armature during electromagnetic launch by using the finite element method. Yin [12] measured the magnetic field at zero speed by fixing the armature. The distribution of the magnetic field around the armature could be determined by simulations and experiments, but the projectile was not considered.
The projectile is mainly composed of various alloy materials with different performances in pulsed high magnetic fields [13]. Shen [14] explored the shielding effect of a projectile material on a stable magnetic field, but did not use a projectile suitable for an electromagnetic launch. Becherini [15] studied the effectiveness of shielding packages with different shapes in a pulsed high magnetic field. Many studies have qualitatively analysed the influence of shielding materials but have not quantitatively discussed the influence of metal materials under pulsed high magnetic fields.
In this paper, the equivalent model of an electromagnetic railgun is established based on the magnetic diffusion equation and the Biot-Savart law. The distribution of the magnetic field around the projectile is simulated, and the influence of the velocity skin effect and shielding package is considered. To validate the simulation results, the magnetic measurement system is proposed by using Hall sensors, which can be used to judge the emergence and disappearance of the magnetic field generator. Moreover, magnetic induction in the range of 0-3.5 T can be obtained linearly. Finally, the influence of the shielding package on the magnetic field during launch is measured and analysed, revealing key factors of shielding effects in pulsed high magnetic fields and promoting the development of railguns.
2. Basic principle of an electromagnetic launch
2.1. Mathematical model of the magnetic field environment for an electromagnetic railgun
The principle of the electromagnetic railgun is shown in Fig. 1. The pulse current flows in the rail and the armature, which produces a high magnetic field in the bore and generates the Lorentz force to propel the armature [17]. The nonlinear effects of rail erosion caused by high-speed movement between armature and rails are ignored in this paper.
Fig. 1Working principle diagram of an electromagnetic railgun [16].
![Working principle diagram of an electromagnetic railgun [16].](https://static-01.extrica.com/articles/22365/22365-img1.jpg)
The pulse current flows along the opposite direction at both sides of the rail, and the current distribution in the rail is subjected to the skin effect. Considering the current model of an electromagnetic railgun, it is assumed that the rail current is only distributed at the skin depth of each surface and is evenly distributed at the skin depth:
where is the skin depth; is the frequency of the current; and and are the conductivity and permeability of the conductor, respectively.
Since the calibre and length of the electromagnetic railgun are far shorter than the wavelength of the electromagnetic field, the displacement current can be ignored. The railgun can be considered a quasi-static system [18]. Combined with the differential form of Maxwell’s equations and Ohm’s law, the magnetic diffusion equation during electromagnetic launch can be obtained as follows [19]:
where is the magnetic induction in the -direction, is the conductivity of the rail, is the vacuum permeability, and is the velocity diffusion term.
For the rails, there is an -direction reverse velocity relative to the armature, and is negative. Since the armature is assumed to be stationary, 0, and the magnetic diffusion equation in the armature region can be expressed as:
where is the conductivity of the armature.
Furthermore, by solving the magnetic diffusion equation of the rails and armature, their current densities can be obtained by using Ampere’s law:
where is the -direction component of the current density, is the -direction component of the current density.
Since the input current of the electromagnetic railgun is a low-frequency pulse current, the magnetic field generated is similar to a steady magnetic field:
where is the body current distribution area, is the vector diameter of the source point, is the vector diameter of the field point. The main parameters affecting the test point are the spatial position of the test point from the source point and the current density component of the source point.
2.2. Calculation model of magnetic induction for the armature and rails
In this section, a C-type armature, which is the most common solid armature, is used for research [20]. Considering the diffusion effect of the current in the armature, the halved C-type armature is divided into five regions for calculation as shown in Fig. 2, where , , and represent the curve equations obtained by projection on the -plane of the inner surface of the trailing edge, the curvature circle, the tail arm and the outer surface of the throat, respectively. The width of the rail is . The calibre of the railgun is . The length of contact line between armature and rail is . The top surface of armature is . The length of armature in IV and V is and , respectively. The average current densities and in each region are obtained by using the magnetic diffusion equation. In each region, the flux density of the observation point is calculated by using the current element model. Finally, vector addition is carried out to obtain the magnetic flux density of the whole armature at the observation point.
Fig. 2Calculation model of the C-type armature
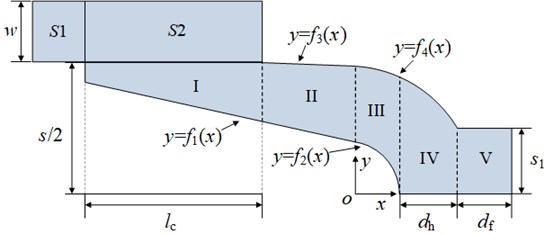
It is assumed that the rail current is only distributed on each surface, and the skin depth is evenly distributed. The current distributions on the upper and lower surfaces of the rail and armature are the same, while the current distribution coefficients on the inner and outer surfaces are and , respectively, where , and [21]. The current of rail surface S1 is:
where and are the height and depth of the rail, respectively.
S1 is regarded as a thin current-carrying plate, and the current density is:
The distance from the source point to the field point is equal to:
The source point coordinates are . According to Eq. (5), the generated magnetic flux density is:
The expression of the -direction flux density produced by surface S1 is:
The expression of the flux density along the -direction is:
Armature region I in Fig. 2 represents the contact region between the rail and the trailing edge of the armature. varies within [, ], while is within [, /2]. It is assumed that the current densities of region I along the - and -directions are and , respectively. Then, the expression of the -direction magnetic flux density is:
The expression of the generated flux density along the y-direction is:
The expression of the -direction flux density generated by the -direction current of region I at the observation point is:
The x-direction flux density is expressed as:
Similarly, the flux densities of other regions can be obtained. The value range of each area is shown in Table 1.
Table 1The value range of each area
Direction | S2 | Armature | ||||
I | II | III | IV | V | ||
] | ||||||
Table 1 also presents the value range of contact area S2. In fact, when the armature is moving, the current density flowing through area S2 can be ignored; when the armature is static, the current in area S2 can also be decomposed into - and -direction currents. The calculation method of magnetic flux density generated at the observation point applies to each area of the armature.
3. Equivalent numerical simulation of an electromagnetic launch
3.1. Equivalent simulation model
Based on the mathematical model, an equivalent model of an electromagnetic railgun is shown in Fig. 3. The rails are made of copper alloy, with a conductivity of 1.8×10⁷S/m. The armature is made of aluminium alloy, with a conductivity of 2.4×10⁷ S/m. The effect of the velocity skin effect on the contact interface between armature and rails is considered in the proposed model. During launch, the armature moves at a high speed relative to the rails. The current distributions in the rail and the armature change significantly at the same time. The current is mostly concentrated on the rail surface (10 % of the rail width) and partially on the trailing edge of the armature (2 % of the armature length) [22]. When the current enters the armature, the current distribution in the dynamic armature is the same as that in the static armature. Therefore, here, the contact model between the rails and the armature is simplified. The width of the rail is 5 mm and the contact area between the rails and the armature is 1.5 mm.
Fig. 3Equivalent model of an electromagnetic railgun during launch
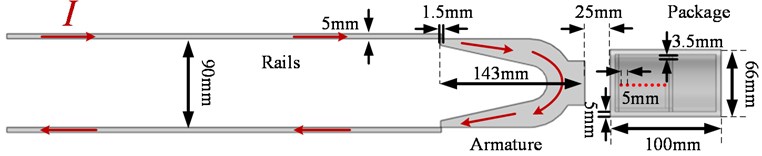
The outer and inner packages are equivalent to projectile shielding and control circuit shielding, respectively. The thicknesses of the inner and outer packages are 3.5 mm and 5 mm, respectively. The inspection points are set from 32 mm to 62 mm away from the central axis of the armature, and one inspection point is set every 5 mm.
3.2. Distribution of magnetic induction in front of the armature
The input current of an electromagnetic railgun is provided by one or more capacitor banks. In this paper, a single capacitor bank is used to study the distribution of magnetic induction in the time-varying phase of the current rising and falling. The input current is divided into two phases. In the first phase (5-8 ms), the current increases gradually to the peak (5.5 MA); in the second phase (8-23 ms), the current decreases gradually from the peak.
The current in Fig. 4 is used in the simulation model to calculate the magnetic induction. The projectile shielding and control circuit shielding are set as non-metallic materials to investigate the internal magnetic field distribution without shielding. The simulation results are shown in Fig. 5(a). Each plot has the same trend, but the amplitude is different. The maximum and minimum peak values are 3.8 T and 2.4 T, respectively. As the distance between inspection point and armature increases, the magnetic induction decreases, as shown in Fig. 5(b). The results suggest that there is a relatively high magnetic field near the armature. The magnetic field near the armature has obvious characteristics and can be used as an environmental signal for control circuit.
Fig. 4Input current
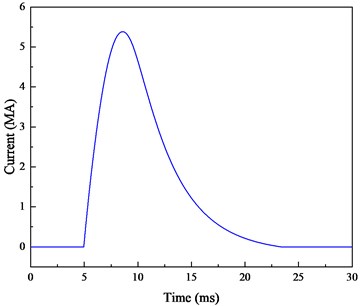
Fig. 5Simulation of magnetic induction at different distances in front of the armature
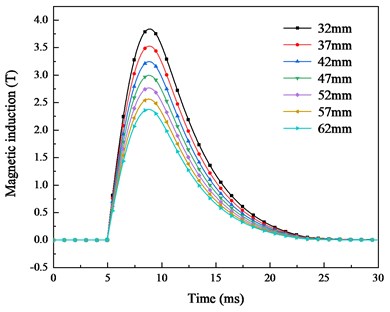
a) Magnetic induction at different points
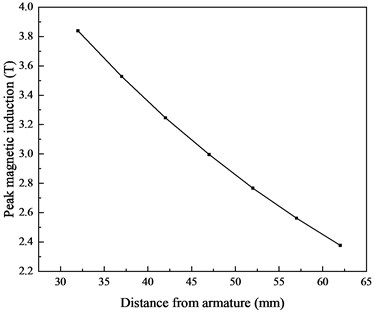
b) Peak magnetic induction
3.3. Analysis of the influence of the shielding material on magnetic induction
In Section 3.2, the magnetic induction of the projectile position was analysed. The simulation results showed that it is mainly affected by the input current and the distance from the armature. However, the influence of projectile material is not considered. The protection of the ammunition and control circuit is vital to safety during launch. The projectile is mainly composed of metal materials, which have different responses to magnetic fields. For materials with good conductivity, eddy current cancellation serves as their shielding mechanism. According to Faraday’s law, the eddy current effect is produced on the surface of the material to provide a reverse magnetic field; moreover, most of the magnetic field is transmitted by ferromagnetic materials. Flux diversion occurs, and the magnetic field density in the cavity is low.
Previous studies have most often discussed the effects of conductive and magnetic materials on the steady magnetic field, where the amplitude of magnetic induction is the primary concern. But for a pulsed magnetic field during launch, the amplitude, change time and duration are all worthy of attention. This section mainly studies the variation of magnetic induction at each point under different shielding materials, such as single permeability magnetic material, single conductive material and composite material.
The peak magnetic induction is compared with the shielding effectiveness (SE) equation:
where and are the magnetic inductions of the observation point before and after shielding, respectively. In this paper, the shielding effectiveness is expressed as the peak magnetic induction due to the transient magnetic field during electromagnetic launch.
3.3.1. Simulation of a single-layer magnetic material
Low carbon 1008 steel and mumetal are used for the simulation, and the B-H curves are shown in Fig. 6(a). The input current is consistent with that in Fig. 3(a). For convenience, the 32 mm point is selected for comparison. These two packaging materials have little influence on the distribution of internal magnetic induction, as shown in Fig. 6(b). In contrast, low carbon steel has a greater influence on the internal magnetic induction. The peak shielding efficiency of 1008 steel is 0.35 dB, and the mumetal only has a peak shielding efficiency of 0.09 dB.
Fig. 6Comparison of the magnetic induction with and without the influence of the magnetic material
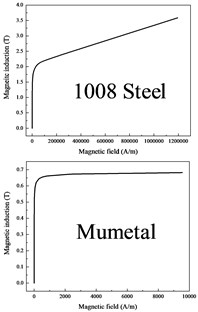
a) B-H curve of the two materials
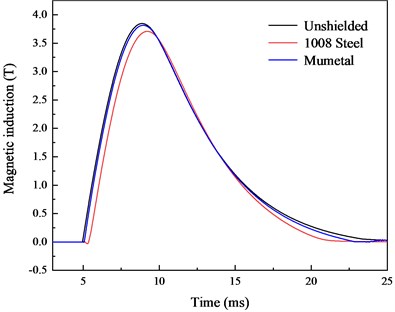
b) Simulation of the magnetic induction
Fig. 6(b) suggests that the start time when using 1008 steel is 0.39 ms slower than that of the unshielded condition. According to the shielding principle of the magnetic material, the magnetic material acts as the magnetic circuit in the magnetic field. Most of the magnetic field is transmitted by the magnetic material, so that 1008 steel has a good shielding effect at the initial 0.39 ms. However, when the external magnetic field is enhanced, the magnetic material reaches saturation, and there is no better performance in the subsequent time. Therefore, the influence of the magnetic material on the internal magnetic field can be ignored when the inspection point is close to the armature.
3.3.2. Simulation of a single-layer conductive material
Copper and aluminium are used for the simulation in this section, and the conductivities are shown in Fig. 7(a). The magnetic induction of the investigated points is compared, as shown in Fig. 7(b). It can be found that conductive material shielding has a better effect than the unshielded method. The peak magnetic induction of the copper material is reduced by 20 %, and the peak shielding efficiency reaches 1.94 dB. The peak magnetic induction of the aluminium material is reduced by 12 %, and the peak shielding efficiency reaches 1.05 dB.
Conductive materials have better shielding effect in high magnetic field environment. When the external magnetic field is enhanced, the induced current will be generated outside the conductive material. The higher conductivity of the shielding material, the larger the induced current. A reverse magnetic induction is formed to counteract part of the external magnetic field. As the eddy current magnetic field lags behind the original magnetic field, the peak magnetic field is delayed.
Fig. 7Comparison of magnetic induction with and without the influence of the conductive material
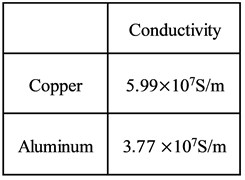
a) Conductivity of the materials
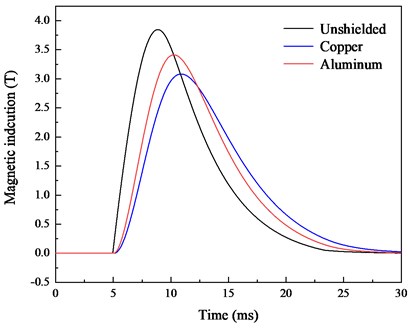
b) Simulation of the magnetic induction
3.3.3. Simulation of the double layer material
The effect of composite shielding of conductive and magnetic materials on the internal magnetic induction is also explored. The outer shielding package is made of conductive material, while the inner shielding package is made of magnetic material. The simulation results are shown in Fig. 8(a) and Fig. 8(b), revealing that the composite shielding method has a better shielding effect. In terms of shielding effectiveness, 1008 steel and copper perform better, and peak magnetic induction has a shielding effectiveness of 4.36 dB.
In contrast, the composite shielding method by outer conductive material and internal magnetic material has better shielding effect in the high magnetic field environment. When the shielding material is a conductive material, the peak magnetic field of the internal magnetic field will lag, and the increase rate of the magnetic induction will slow down at the initial time. The time of magnetic saturation of the inner magnetic material becomes slower, so the shielding effectiveness at the initial time is better. Copper has good conductivity and 1008 steel has high saturated magnetization. Thus, the shielding effect is better when these two materials are combined.
3.3.4. Comparison of different shielding methods
The simulation results are shown in Table 2. The peak magnetic induction, shielding effectiveness, change time and duration are compared. The change time, expressed as the moment of magnetic induction, rises from zero and drops to zero.
Fig. 8Comparison of the magnetic induction with and without the influence of the double layer material
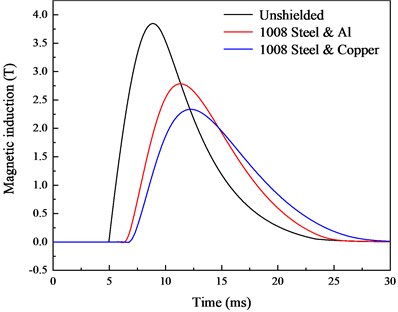
a) 1008 steel and conductive material
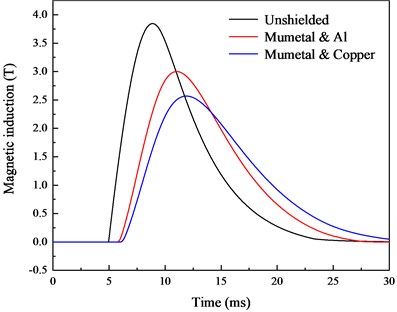
b) Mumetal and conductive material
As suggested, the shielding method of magnetic materials mainly affects the change time and duration of magnetic induction. The start time is later with shielding than without, with a maximum delay of 0.39 ms; the end time is earlier with shielding than without, ending at most 3.9 ms earlier. The duration under magnetic permeability shielding is shorter than that of the unshielded method. Specifically, the 1008 steel condition has a duration of 15.71 ms, while with mumetal, the duration is 17.20 ms. This is because part of the magnetic induction is channelled into the magnetic material and because the interior magnetic induction is lower and the pulse width is shorter.
Table 2Comparison of different shielding methods
Package materials | Peak magnetic induction (T) | SE (dB) | Change time (ms) | Duration (ms) |
Unshielded | 3.85 | / | 5.00/24.85 | 19.85 |
1008 steel | 3.70 | 0.35 | 5.39/21.10 | 15.71 |
Mumetal | 3.81 | 0.09 | 5.25/22.45 | 17.20 |
Copper | 3.08 | 1.94 | 5.37/29.57 | 24.20 |
Aluminium | 3.41 | 1.05 | 5.26/27.17 | 21.91 |
1008 steel & Al | 2.78 | 2.83 | 6.52/25.45 | 18.93 |
1008 steel & copper | 2.33 | 4.36 | 6.95/28.50 | 21.55 |
Mumetal & Al | 3.01 | 2.14 | 5.93/26.82 | 20.89 |
Mumetal & copper | 2.56 | 3.54 | 6.24/29.73 | 23.49 |
Conductive materials have better shielding effectiveness than magnetic materials. Compared to the unshielded condition, the start and end times with shielding occur later, with delays of, at most, 0.37 ms and 4.72 ms, respectively, which are due to the eddy current shielding effect of conductive materials. At the rising edge of the magnetic induction intensity, the eddy current effect of conductive shielding reverses magnetic induction, which counteracts the internal and external magnetic induction. The effect of the eddy current prevents the magnetic induction from decreasing in the decreasing stage, so, in the case of shielding with conductive materials, the initial and end stages are slower than those without shielding.
The composite shielding method is found to have a better shielding effect and can reduce the peak magnetic induction by approximately 38.9 %. At the same time, compared with other methods, its start time occurs after the unshielded method, with a maximum delay of 1.95 ms. The duration is longer for the composites than for the of unshielded condition, except the composite of 1008 steel and aluminium, which have a duration of 19 ms less. The composite shielding of copper and 1008 steel can achieve a better shielding effect, but with a serious lag in the start time and longer duration.
4. Static and dynamic verification experiment
To validate the simulation results, a magnetic measurement system is employed to measure the magnetic induction in a static environment (compensation coil) and dynamic environment (electromagnetic railgun). The previous measurement method [23] is improved. A magnetic measurement system based on a Hall switch and linear Hall sensor is designed, which can record the change time of the Hall switch and obtain the magnetic induction in a pulsed high magnetic field.
4.1. Magnetic measurement system
The working principle of the magnetic measurement system is shown in Fig. 9. A Hall switch and linear Hall sensor are used for the test of the pulsed high magnetic field.
Fig. 9Working principle of the magnetic measurement system
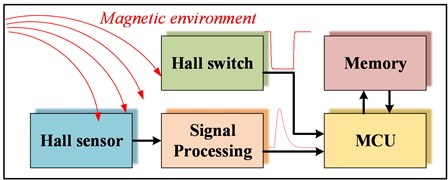
Fig. 10Principle of Hall switch-based magnetic environment detection
The output voltage of the linear Hall sensor is processed by the signal, and the output voltage at 3.5 T is adjusted to the maximum input voltage corresponding to the Analog-to-Digital converter (ADC) of microcontroller. The sensor signal matches the voltage ranging from 0 to 3.3 V through an appropriate circuit. The voltage is converted to an output signal with a frequency range of 40 kHz by using the ADC input and lookup table of the microcontroller. The output value of the Hall switch is converted to a low-level signal or a 3.3 V high-level signal. Hall switch A3144 and linear Hall CY106S were used as sensors, while C8051F was chosen as a microcontroller.
The flow chart in Fig. 10 shows how the Hall switch works. and are the operating and release point thresholds of the Hall switch, respectively. The output becomes “low” when the magnetic field at the Hall sensor exceeds the ; when the magnetic field is reduced to a value below the , the device output becomes high.
4.2. Shielding experiment in a high magnetic field generator
The high magnetic field generator is composed of a pick-up coil, compensation circuit and acquisition card, as shown in Fig. 11. The induction electromotive force is generated by the pick-up coil, and the extra voltage of the pick-up coil is eliminated by the compensation coil. Finally, voltage acquisition and processing are completed by the acquisition card. The whole process of signal acquisition and processing is outlined by the dotted red line.
Fig. 11Working principle of the magnetic measurement system
Testing and calibration of the testing circuit were performed at Wuhan National High Magnetic Field Center using a high magnetic field generator. Pulsed magnetic fields were generated by multiple winding coils with an aperture of 75 mm and a height of 228 mm. The pulses used for testing and calibration were half-period sinusoidal pulses with amplitudes up to 3.5 T. The pick-up coil equipped with an integrator was used to calibrate the magnetic field sensor. The pick-up coil was positioned in the centre of the coil at the same location as the projectile-borne storage testing system. To verify the stability and reliability of the testing system, the mapping relationship between the output voltage of the testing system and magnetic induction is studied by using Gaussian process regression.
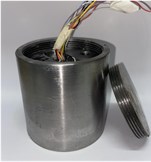
The same charging and discharging modules in Section 4.2 are also utilized in the shielding experiment. Except for the module for the real-time signal test, the magnetic field test circuit is packaged in the shielding material. The thicknesses of the shielding materials are 3.5 mm and 5 mm, which are the same as those in Section 3.1. As shown in Fig. 12, the wooden bearing plate, insulation bush and fittings are used to limit and fix the magnetic measurement system and make the test position of the magnetic field sensor the same as that of the pick-up coil. After the experiment, the upper computer is used to read back the data in the magnetic measurement system.
Fig. 12Measurement of SE with different materials
4.3. Shielding experiment during launch
A schematic diagram of an electromagnetic railgun is shown in Fig. 13(a), where the width, length and calibre of the rail are 80 mm, 4 m and 75 mm, respectively. The integrated test projectile and insulation support are fixed to the armature. The integrated projectile is composed of a projectile-borne storage testing system, a copper alloy package and an insulating sabot. The test device is shown in Fig. 13(b), which mainly consists of a control circuit, lithium battery and battery holder. The shielding of the test device is low carbon 1008 steel.
Fig. 13Experimental diagram of electromagnetic launch
a) Schematic diagram of electromagnetic launch
b) Storage system
5. Results and discussions
5.1. Measurement results of the pulsed magnetic field generator
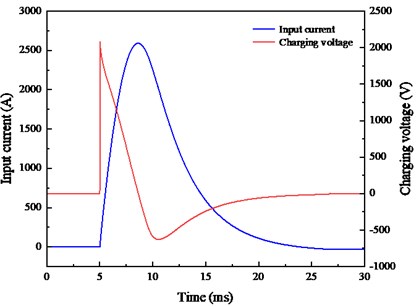
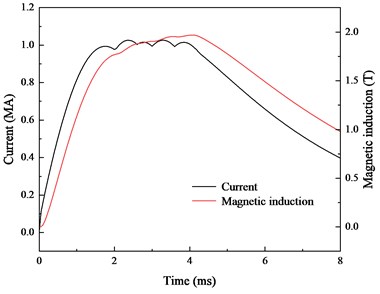
The input current of the inductive coil and electromagnetic railgun is provided by a large capacitance discharge. Therefore, the discharge circuit is designed to simulate the distribution of in-bore magnetic induction during electromagnetic launch. The discharge experiment is carried out with a 1-MJ power supply, a charging voltage of 2 kV, and with the pick-up coil located in the centre of multiple winding coils. The input current is shown in Fig. 14(a).
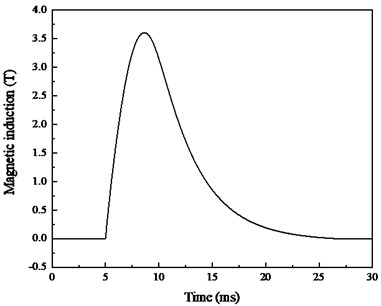
The current starts to rise at 5.015 ms, reaches the peak value of 3376.6 A at 8.35 ms and then begins to decline. The current is just 28.4 A at 25 ms and drops to zero at 30 ms. The magnetic induction is basically consistent with the pulse current, as shown in Fig. 14(b). It rises from 4.7 ms to 8.35 ms, reaches the peak value of 3.60 T and then decreases gradually. The magnetic induction is close to zero at 25 ms. Therefore, multiple winding coils can be used to simulate the magnetic induction of the projectile position in the electromagnetic launching process.
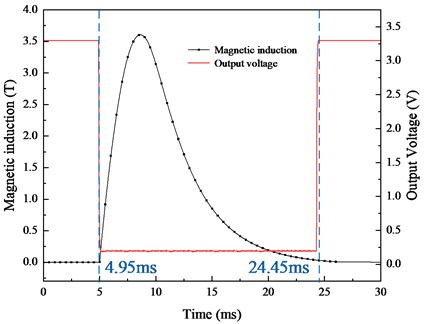
Following the method given in Fig. 11, the magnetic induction and Hall switch signal readback are shown in Fig. 15. The red line represents the output voltage of the Hall switch, and the black line indicates the magnetic induction. When the magnetic induction changes ( 4.95 ms), the voltage signal decreases to 0.2 V in 0.1 ms and remains unchanged in the magnetic induction pulse width; when the magnetic induction decreases to nearly 0 T ( 24.45 ms), the voltage signal increases to 3.3 V in 0.1 ms. In this process, the Hall switch completes the measurement of the magnetic induction signal in multiple winding coils.
Fig. 14Measurement results of the pulsed high magnetic field generator
a) Input curve
b) Output magnetic induction
Fig. 15Measurement results of magnetic induction and output voltage
5.2. Experiment of shielding effectiveness with different materials
The same discharge voltage was used for the pulsed magnetic field experiment. Copper, low carbon 1008 steel and double layer shielding materials are chosen for the experiment. The experimental values of magnetic induction are shown in Fig. 16(a). As indicated, the composite of low carbon 1008 steel and copper have the lowest magnetic induction. The experimental value closely matches the simulation results presented in Section 3. Figs. 16(b)-(d) show comparisons between the internal magnetic induction and the output voltage signal of the Hall switch under different shielding materials. The duration of the measured magnetic induction under different shielding materials is consistent with the simulation results.
Fig. 16Comparison of magnetic induction and output voltage
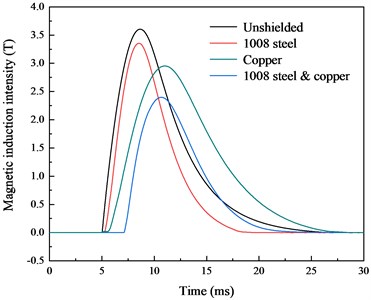
a) Comparison of magnetic induction
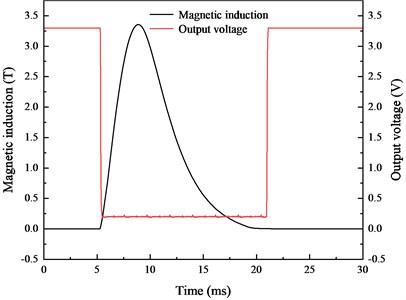
b) Low carbon 1008 steel
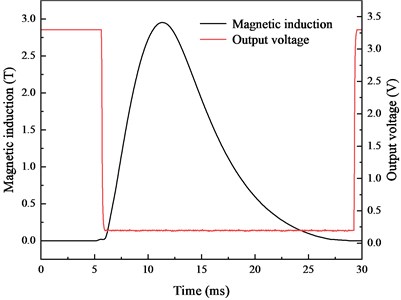
c) Copper
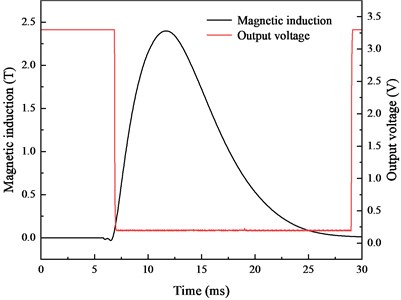
d) Low carbon 1008 steel and copper.
The change time of the Hall switch and the duration of magnetic induction are listed in Table 3. It can be found that different shielding materials exert different influences on the response time of the internal Hall switch. Compared with the unshielded experiment, the time errors of low carbon 1008 steel, copper and the composite of low carbon 1008 steel and copper are 18.97 %, 22.77 % and 12.82 %, respectively. Therefore, the magnetic and conductive materials affect the internal magnetic induction in the pulsed magnetic field environment, and the shielding effectiveness of composite shielding is the best, reaching 3.57 dB. Additionally, conductive and magnetic materials also affect the change time and pulse width of the pulsed magnetic field due to their shielding mechanisms.
Table 3Peak magnetic induction and shielding effectiveness of different shielding materials
Shielding material | Peak magnetic induction (T) | SE (dB) | Change time (ms) | Duration (ms) | Time error (%) |
Steel 1008 | 3.35 | 0.64 | 5.33/21.09 | 15.76 | 18.97 |
Copper | 2.95 | 1.74 | 5.67/29.55 | 23.88 | 22.77 |
1008 & copper | 2.39 | 3.57 | 6.85/29.05 | 22.20 | 12.82 |
5.3. Recovery considering the influence of projectile shielding during launch
The dynamic test current, which has a peak current of approximately 1 MA, is shown in Fig. 17(a). The distribution of the magnetic induction without considering the shielding material is shown in Fig. 17(b), which has a peak value of approximately 2 T.
Fig. 17Comparison of velocity, magnetic induction and output voltage of the Hall switch during launch
a) Input current and simulation magnetic induction
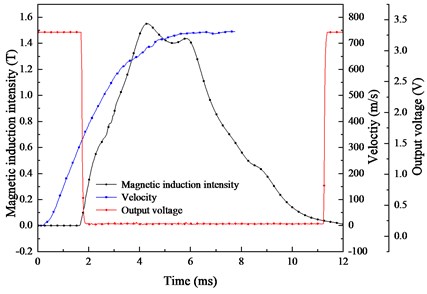
b) Measured data during launch
The results of the dynamic experiment are shown in Fig. 17(b). The blue curve is the velocity, which is integrated by the measured value of the acceleration sensor. The velocity changes within a time range of 0.15-7.8 ms, and the muzzle velocity is 750 m/s. The red curve is the Hall switch test value, and the black curve is the linear Hall sensor test value. This work uses envelopes of the analogue signal measured by the linear Hall sensor, which does not affect the analysis of the peak value and duration of the magnetic field. The magnetic induction curve begins to rise at 1.65 ms and decreases to 0 T at 12 ms. The peak magnetic induction is 1.55 T.
Without shielding, the trends of the simulated magnetic field and current are similar. Under the double shielding effect, the magnetic field clearly has a time delay, and the time error reaches 18 %. In further designs, this delay should be corrected.
6. Conclusions
In this paper, an equivalent model of an electromagnetic railgun during launch is established, and it can simulate the distribution of in-bore magnetic induction throughout the launch. By means of simulation and experimental validation, the influence of packaging materials on the internal magnetic induction is studied, and the following is determined:
1) During electromagnetic launch, the distribution of magnetic induction decreases with increasing distance from the armature, and the magnetic field signal in the railgun can be used to judge the muzzle time.
2) The projectile package affects the amplitude of interior magnetic induction. The peak magnetic induction of 1008 steel decreases by 7 %. Magnetic and conductive materials have a better composite shielding effect than other materials, and the magnetic induction decreases by 33 %.
3) Different packaging materials affect the pulse width of the internal magnetic field to different degrees. The pulse width of the permeable magnetic material is shorter than that without shielding. The pulse width of the conductive material is longer than that without shielding. This phenomenon has been validated in the compensation coil and electromagnetic launch. In the dynamic test, the time error reaches approximately 18 %, so the characteristics of projectile shielding should be fully considered when using this environment.
References
-
H. D. Fair, “Advances in electromagnetic launch science and technology and its applications,” 2008 14th Symposium on Electromagnetic Launch Technology, Vol. 45, No. 3, pp. 225–230, Jun. 2008, https://doi.org/10.1109/elt.2008.9
-
I. R. Mcnab, “Early electric gun research,” IEEE Transactions on Magnetics, Vol. 35, No. 1, pp. 250–261, 1999, https://doi.org/10.1109/20.738413
-
Jun Li et al., “Design and testing of a 10-MJ electromagnetic launch facility,” IEEE Transactions on Plasma Science, Vol. 39, No. 4, pp. 1187–1191, Apr. 2011, https://doi.org/10.1109/tps.2011.2110649
-
R. Ciolini, M. Schneider, and B. Tellini, “The use of electronic components in railgun projectiles,” IEEE Transactions on Magnetics, Vol. 45, No. 1, pp. 578–583, Jan. 2009, https://doi.org/10.1109/tmag.2008.2008431
-
K. Dai, Y. Yang, Q. Yin, and H. Zhang, “Theoretical model and analysis on the locally concentrated current and heat during electromagnetic propulsion,” IEEE Access, Vol. 7, pp. 164856–164866, 2019, https://doi.org/10.1109/access.2019.2952981
-
M. Ghassemi and R. Pasandeh, “Thermal and electromagnetic analysis of an electromagnetic launcher,” IEEE Transactions on Magnetics, Vol. 39, No. 3, pp. 1819–1822, May 2003, https://doi.org/10.1109/tmag.2003.809862
-
Q.-H. Lin and B.-M. Li, “Numerical simulation of interior ballistic process of railgun based on the multi-field coupled model,” Defence Technology, Vol. 12, No. 2, pp. 101–105, Apr. 2016, https://doi.org/10.1016/j.dt.2015.12.008
-
Y. Yang et al., “Numerical calculation of movement electromagnetic field distribution between rail and armature,” (in Chinese), Journal of Gun Launch and Control, Vol. 35, No. 3, pp. 1–5, 2014, https://doi.org/10.19323/j.issn.1673-6524.2014.03.001
-
X. Li and C. Weng, “Three-dimensional investigation of velocity skin effect in U-shaped solid armature,” Progress in Natural Science, Vol. 18, No. 12, pp. 1565–1569, Dec. 2008, https://doi.org/10.1016/j.pnsc.2008.05.024
-
A. E. Zielinski, C. D. Le, and J. A. Bennett, “In-bore electric and magnetic field environment,” IEEE Transactions on Magnetics, Vol. 35, No. 1, pp. 457–462, 1999, https://doi.org/10.1109/20.738451
-
X. Li et al., “Analysis of distribution characteristics of in-bore magnetic field of electromagnetically launched projectile based on analytical method,” (in Chinese), Acta Armamentarh, Vol. 37, No. 12, pp. 2205–2211, 2016.
-
Q. Yin et al., “Analysis of railgun in-bore magnetic field distribution at zero speed,” (in Chinese), High Power Laser and Particle Beams, Vol. 28, No. 2, pp. 1–5, 2016, https://doi.org/10.11884/hplpb201628.025008
-
K. Yoshizawa, S. Noguchi, and H. Igarashi, “Influence of magnetic property of ferromagnetic shield on high field magnet analysis,” IEEE Transactions on Applied Superconductivity, Vol. 21, No. 3, pp. 2088–2091, Jun. 2011, https://doi.org/10.1109/tasc.2010.2093859
-
N. Shen, X. Zhang, Q. Liao, and M. Zhang, “Design and experimental analysis of magnetic shielding of electronic-magnetic rail gun ammunition fuse,” International Journal of Applied Electromagnetics and Mechanics, Vol. 53, No. 2, pp. 337–358, Feb. 2017, https://doi.org/10.3233/jae-160060
-
G. Becherini, S. Di Fraia, R. Ciolini, M. Schneider, and B. Tellini, “Shielding of high magnetic fields,” IEEE Transactions on Magnetics, Vol. 45, No. 1, pp. 604–609, Jan. 2009, https://doi.org/10.1109/tmag.2008.2008537
-
J. Li, P. Yan, and W. Yuan, “Electromagnetic gun technology and its development,” (in Chinese), Gaodianya Jishu/High Voltage Engineering, Vol. 40, No. 4, pp. 1052–1064, Apr. 2014, https://doi.org/10.13336/j.1003-6520.hve.2014.04.014
-
Fair H. D., “Electromagnetic Launch,” International Journal of Impact Engineering, Vol. 29, No. 1-10, pp. 247–262, Dec. 2003, https://doi.org/10.1016/j.ijimpeng.2003.09.022
-
W. O. Coburn and W. Williams, “Static and quasi-static models for the magnetic field of a railgun,” IEEE Transactions on Magnetics, Vol. 31, No. 1, pp. 692–697, Jan. 1995, https://doi.org/10.1109/20.364609
-
Q. Yin, H. Zhang, H.-J. Li, and Y.-X. Yang, “Analysis of in-bore magnetic field in C-shaped armature railguns,” Defence Technology, Vol. 15, No. 1, pp. 83–88, Feb. 2019, https://doi.org/10.1016/j.dt.2018.07.009
-
Deng Feng et al., “Study on the curve shape of C-shaped armature’s trailing arms in rectangular bore railgun,” IEEE Transactions on Plasma Science, Vol. 41, No. 5, pp. 1460–1466, May 2013, https://doi.org/10.1109/tps.2013.2248391
-
J. Nie, J. Han, Q. Jiao, J. Li, and J. Qin, “An analytic expression of inductance gradient for rail-type electromagnetic launcher,” IEEE Transactions on Plasma Science, Vol. 39, No. 3, pp. 931–934, Mar. 2011, https://doi.org/10.1109/tps.2010.2100048
-
T. G. Engel, J. M. Neri, and M. J. Veracka, “Characterization of the velocity skin effect in the surface layer of a railgun sliding contact,” IEEE Transactions on Magnetics, Vol. 44, No. 7, pp. 1837–1844, Jul. 2008, https://doi.org/10.1109/tmag.2008.922310
-
S. Hundertmark, Y. Schaeffer, D. Simicic, and G. Vincent, “Further experiments with an UHF radio link to a railgun projectile,” 2014 17th International Symposium on Electromagnetic Launch Technology (EML), Vol. 43, No. 5, pp. 1152–1155, Jul. 2014, https://doi.org/10.1109/eml.2014.6920151
Cited by
About this article

