Abstract
The static fluid-induced force and stiffness coefficient of the smooth annular seal directly affect the rotor system stability. In this paper, a computational fluid dynamics method is applied to investigate the flow characteristics of a smooth annular seal for various eccentricities, discharge/supply pressures and rotational speeds under different flow conditions (laminar, transition, and turbulent flow). The influence factors and formation mechanism of the static instability in the smooth annular liquid seal are analyzed. Results show that laminar flow dominates the flow state at a rotational speed of 2000 rpm. As the rotational speeds increase, the transition flow (2000-7000 rpm) gradually transits to the turbulent regime (7000 rpm). The direct static stiffness decreases first and then increases from laminar to transition flow state, and the viscosity effect is the dominant factor. For transition and turbulent flow with high eccentricities (80 %), the dominant viscous effect and inertial effect lead to the negative radial force and negative direct static stiffness coefficients. The smooth annular liquid seal shows best performance in the laminar flow and worst performance in the turbulent flow.
Highlights
- A full three-dimensional numerical model was established by CFD method to predict the flow characteristics under three different flow states (laminar flow, transition flow and turbulent flow).
- Rotor eccentricity affects the circumferential velocity gradient variation in minimum clearance, and for transition and turbulent flow in high eccentricity (ε=80 %), the dominant viscous effect and inertial effect lead to the negative radial force and the negative direct static stiffness coefficient.
- The smooth annular liquid seal shows best performance in the laminar flow and worst performance in the turbulent flow.
1. Introduction
Smooth annular seals are the essential component to reduce the leakage flow due to the pressure difference across the seal [1-3]. Meanwhile, the rotordynamic performance related to the stability of the rotor-bearing-seal system are found to be affected mainly by the annular seal in many engineering applications [4-8]. Annular seals working in different flow states (laminar flow, transition flow and turbulent flow) produce different seal forces on the rotor, leading to instability of the rotor. Therefore, it is of great theoretical significance to study annular seals [9-11].
The seal forces acting on the rotor surface can include static force and dynamic force. The static force is produced by the rotor, while the dynamic force is produced by the rotor vibration. The influence of static force on the rotor system is manifested in changing the system direct static stiffness, leading to the static instability. On the one hand, the static instability mechanism for smooth annular seals is not clear, especially when the fluid is in various flow states, such as laminar flow, transition flow and turbulent flow. On the other hand, the trend of the direct static stiffness coefficient and static instability mechanism need more investigations [12-15].
The static seal force and the direct static stiffness coefficient show significant influence the system stability. In 1958, Lomakin [16] firstly proposed the axial pressure drop would lead to positive direct radial stiffness of smooth annular seal, and it was independent of rotational speed and a function of Reynolds number, pressure drop, rotor radius and radial clearance. Fleming [17] changed the working medium, thus found the annual seal produced negative stiffness. Alexander et al [18] found that the sealing force generated by a smooth ring seal shifted the rotor eccentric, and further pointed out that negative static stiffness coefficient could cause static instability of the system. Arghir [19] pointed out that under high static eccentricity, the traditional lomakin effect was weakened by the viscous force effect in maximum clearance, which leads to the negative stiffness of the smooth annular seal. Zhang W. et al [20] determined that for flow conditions without choking the flow in an annular gas seal, the viscous effect was the dominant factor for the negative static direct stiffness coefficient at 1.0 with large eccentricity values.
However, when the fluid inside the seal is in various flow states (laminar flow, transition flow, turbulent flow), it will show different static characteristics. Based on turbulent theory, Black [21-22] proposed a solution model for fluid flow characteristics (low viscosity, large axial pressure drop and large radial clearance) for annular seal.
In 2015, Salas [23] measured the static and rotordynamic characteristics of the smooth annular seal under laminar flow, and found maximum axial, circumferential, and vector Reynolds numbers of 12, 143, and 144, also under laminar flow. In 2021, Maximilian et al. [24] studied investigating plain, symmetrically profiled and non-symmetrically profiled annular seals within the relevant parameter range for turbulent flow in pumps. The results are compared to the simulation results showing a significant influence ofprofiled gaps on the dynamic characteristics in comparison to plain annular seals. Bullock et al. [25] studied the static characteristics of the seal rotor during the transition state from the turbulent state, but its stability formation mechanism is still unclear.
Based on the experimental results by Childs [25], ISO VG2 fluid was selected in working fluid. This paper presents a comprehensive analysis of the static characteristics for a smooth annular seal in laminar, transition and turbulent flow regimes. CFD method is used to establish the three-dimensional numerical analysis model for the smooth annular liquid seal with various rotational speeds, eccentricity ratios and axial pressure drop. The work aims to evaluate the static stability of the smooth annual seal. The flow field inside the seal and its static performance are discussed in detail.
2. Numerical method
2.1. Solution method for the direct static stiffness coefficient
The relation between the fluid-induced force and rotor whirling displacement can be expressed as:
Fig. 1 and Fig. 2 display the seal geometry and rotor-seal system respectively. In Fig. 1, and denote the maximum and minimum clearance. The rotor is eccentric in the negative direction of y axial direction. , , are the seal clearance, the eccentric distance and the eccentricity ratio, respectively, which can be expressed as:
Fig. 1Schematic diagram of the eccentric rotor-seal system
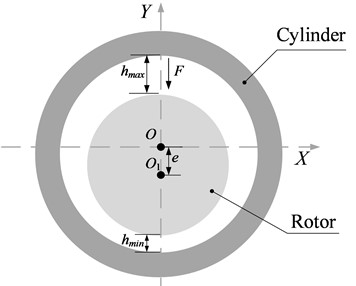
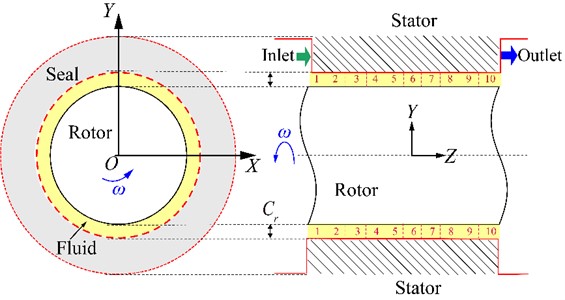
Fig. 2Two dimensional model for the smooth annular liquid seal
The direct stiffness coefficient can be expressed as:
In the following discussion, the axial Reynolds number is:
where, is annular clearance area (), is viscosity, is density, and is volumetric leakage rate. The circumferential Reynolds number is:
Following Zirkelback and Andrés [14], Cr is used as the hydraulic diameter. The vector Reynold number is:
The configuration of the smooth annular liquid seal is shown in Fig. 2. Table 1 lists the detailed operating conditions. In order to further analyze the internal flow state, Fig. 2 shows the diagram of the different seal sections (1, 2, ..., 9, 10).
Table 1Seal dimensions
Parameters | Value |
Seal length / mm | 50.8 |
Rotor diameter / mm | 111.6 |
Radial clearance / mm | 0. 18493 |
Eccentricity ratio / % | 0, 27, 53, 80 |
The inlet boundary sets the total pressure and temperature. The detailed dimensions of the annular seal are referred from Ref. [25].
2.2. Mesh and verification
Fig. 3 illustrates the structured grid distribution. On the one hand, in order to ensure numerical stability, extensional sections are set at the seal inlet and outlet respectively. The length of the extensional section depends on the backflow phenomenon at the outlet and computational convergence residual.
Fig. 3Three dimensional mesh grids distribution
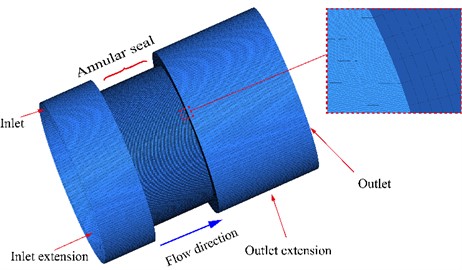
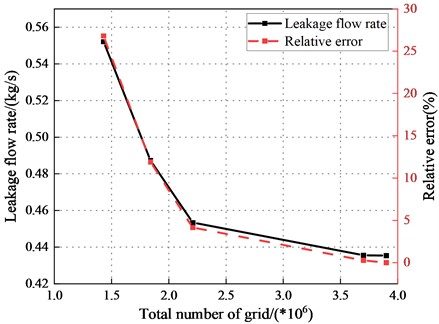
On the other hand, the grid independence verification is carried out to verify the numerical reliability. The Computational fluid dynamics (CFD) model with five different mesh density (1.43 million, 1.84 million, 2.21 million, 3.73 million, 3.91 million) was calculated. Meanwhile, Fig. 4 illustrates different mesh densities relative error of fluid leakage flow rate. The mesh density is acceptable when the relative error of the fluid leakage is under 1 %. Therefore, the number of grids is chosen to be 3.7 million.
Fig. 4Grid independence verification
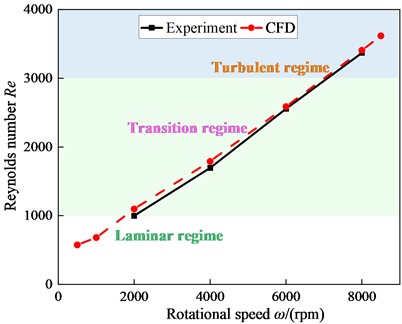
To validate the current numerical method, simulated and experimental values of Reynolds number Re and direct static stiffness coefficients are compared, as shown in Fig. 5. When pressure drop 4.13 bar, the simulated direct static stiffness is slightly larger than the experimental value. Direct static stiffness is negative, and the seal will be unstable. also increases gradually with the increasing . The direct static stiffness coefficient changes from negative to positive, which means the system will become stable. For 4000 rpm, the simulated value of is larger than the experimental value, the error is within the acceptable range.
Fig. 5CFD validation
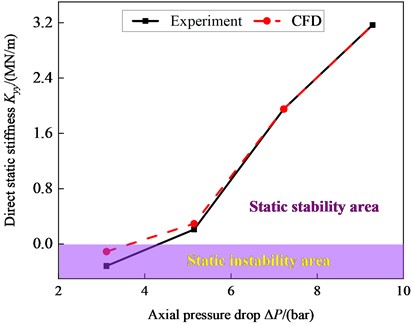
a) Stiffness validation
b) validation
2.3. Boundary conditions
This paper applies ANSYS CFX to solve the flow field of the annual seal. The numerical domain and boundary conditions are shown in Table 2. The working medium is the ISO VG2 oil. The standard k-ε with a scalable wall function is used as the turbulent model. The rotor and stator walls are assumed to be adiabatic and hydraulically smooth. Non-slip condition applies to the wall surfaces. Total pressure and total temperature are defined for the inlet boundary, while static pressure is specified for the outlet boundary.
Table 2Calculation conditions
Simulation condition | Definition |
Fluid | ISO VG 2 oil liquid with dynamic viscosity of 1.831×10⁻⁵ N·s/m2, specific heat capacity of 1921.49 J/(kg·K) and thermal conductivity of 0.12788 W/(m·K) |
Wall | Adiabatic, non-slip |
Laminar model | Laminar |
Turbulent model | - |
Supply pressure / bar | 2.1, 3.1, 5.13, 8.21, 9.27 |
Discharge pressure / bar | 1 |
Supply temperature / K | 319.1 |
Rotational speed / rpm | 500, 1000, 2000,4000,6000,8000,8500 |
3. Results and discussion
3.1. Reynolds number
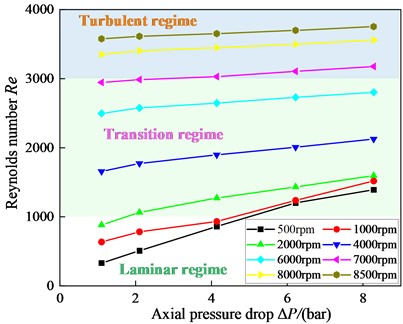
Fig. 6 presents the vs. axial pressure drop . is not sensitive to , while gradually increasing with the increasing . The velocity transition points from laminar to transition flow approaches about 2000 rpm. Because the fluid inside the seal is under laminar flow at 2000 rpm. The rotational speed range of the transition flow is moving from 2000 to 7000 rpm. The velocity transition point from transition to turbulent flow approaches about 7000 rpm. The fluid inside the seal is under turbulent flow when rotational speed is larger than 7000 rpm.
Fig. 6Reynolds number
3.2. Laminar flow
3.2.1. Static characteristics
The direct static stiffness coefficient vs. axial press drop is shown in Fig. 7. Note the 500 rpm results where increases slightly in moving from 1 bar to 4 bar, then drops steadily in moving from 4 to 6 bar, and finally rise in moving greatly from 6 to 8 bar. Meanwhile, for 2000 rpm, drops slightly in moving from 1 to 2 bar and then increases steadily with increasing . When the approaches 1000, drops in the laminar flow. However, for 1000, increase with increasing .
To study the effect of laminar flow on the system stability, friction factor, circumferential pressure, axial and circumferential velocity are analyzed, respectively.
Fig. 7Direct static stiffness coefficient Kyy vs. axial pressure drop ΔP (Laminar flow)
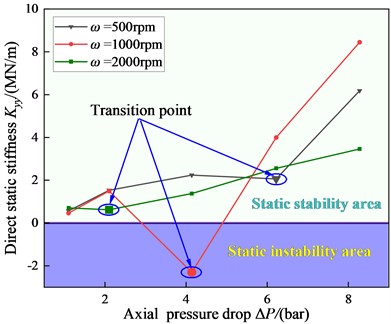
Fig. 8Friction factor λ vs. Reynolds number Re, Yamada [26] with Cr/R= 0.0136
![Friction factor λ vs. Reynolds number Re, Yamada [26] with Cr/R= 0.0136](https://static-01.extrica.com/articles/23283/23283-img9.jpg)
3.2.2. Friction factor
Fig. 8 shows Yamada [26]’s friction factor -vs.- results for 0.0136, where is the present circumferential Reynolds number . For the current test results, at 1 rpm, 434, which is closest to the curve for 500, and at about 1200, stops falling and starts leveling off, then remains relatively stable until 2000. Although Yamada’s minimum is 3.4 times larger than the present test seal, it shows that the transition from laminar to transition flow state occurs around 1200. According to Yamada’s data, the drop in at 1000 rpm is caused by the laminar to transition flow, as shown in Fig. 8.
Fig. 9 depicts the direct static stiffness coefficient vs. eccentricity ratio . The results show that the positive decreases as the increase of and decreases more with higher pressure. is generally unaffected by increasing , but grows obviously with the increasing .
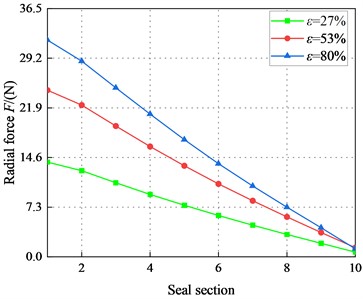
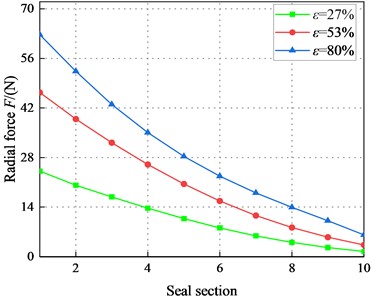
Fig. 10 provides the direct radial force vs. eccentricity ratio . In the laminar flow, the radial force increases linearly with increasing eccentricity at 1.1 bar, the positive radial force means that the seal produces a positive centering force. is hardly affected by , while it gradually increases with the increasing .
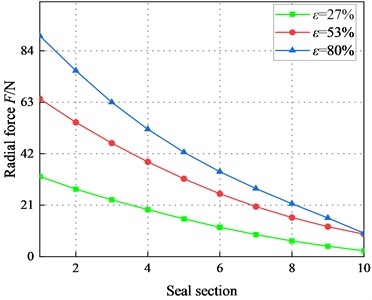
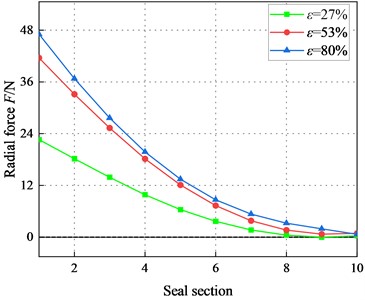
Fig. 11 displays radial force in different seal sections (1, 2, …, 9, 10). Note that the radial force is positive, decreases with the increasing axial distance . For the same , increase significantly with the increasing and . The difference between radial forces at different eccentricity ratios decreases with increasing axial distance. The difference between the radial forces at different eccentricities increases with the increase of .
Fig. 9Direct static stiffness coefficient Kyy vs. static eccentricity ratio ε (Laminar flow)
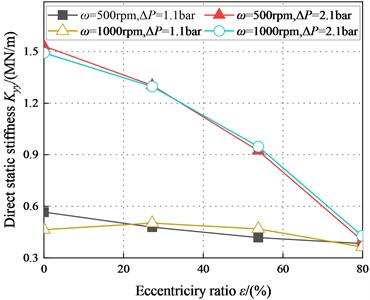
Fig. 10Radial force F vs. eccentricity ratio ε (Laminar flow)
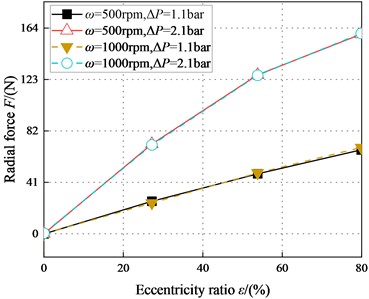
Fig. 11Radial force F (Laminar flow)
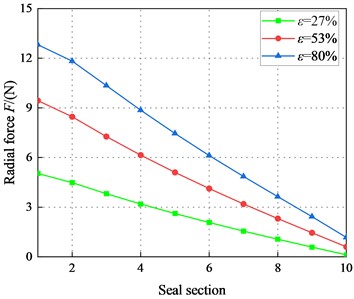
a)1000 rpm, 1.1 bar
b)1000 rpm, 2.1 bar
Fig. 12Direct static stiffness coefficient Kyy (Laminar flow)
a)1000 rpm, 1.1 bar
b)1000 rpm, 2.1 bar
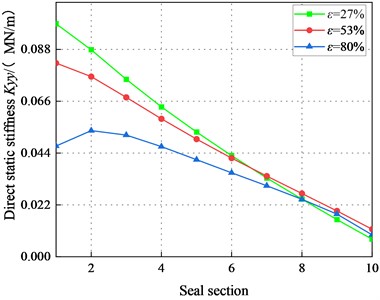
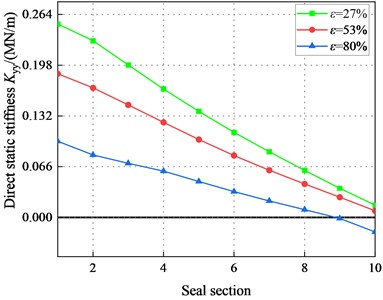
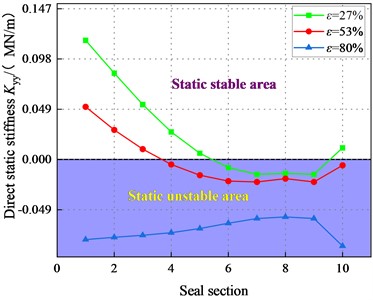
Fig. 12 depicts the direct static stiffness coefficient in different sections. The shows a decreasing tendency and transforms from negative to positive. increases significantly with the increasing . decreases with the increasing . However, negative values of appear in the tenth section when 2.1 bar and 80 %. The decreases as the axial distance increases, while it shows an opposite tendency as the eccentricity increases. Moreover, the difference of direct static stiffness coefficients at different eccentricities decreases as the axial distance increases. In conclusion, the static stability of the system in the laminar flow state is well.
3.2.3. Circumferential pressure
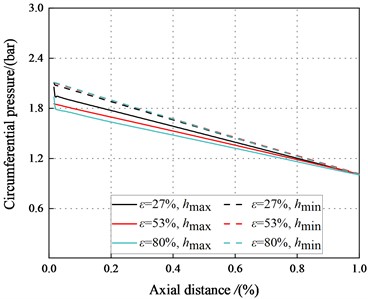
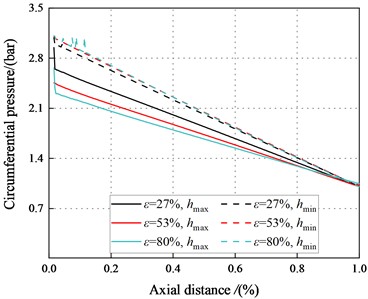
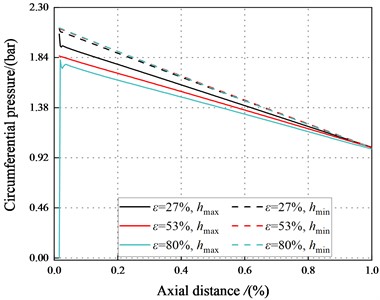
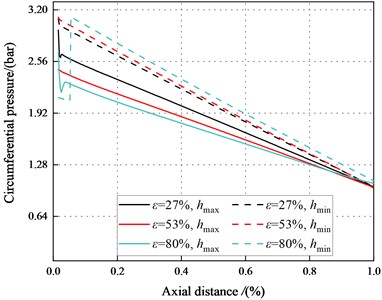
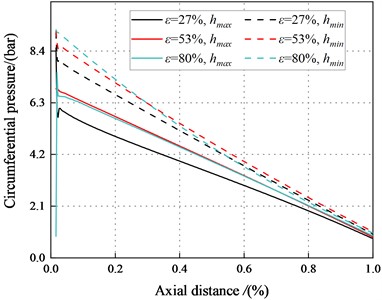
To illustrate the negative direct static stiffness in the tenth section, Fig. 13 displays the circumferential pressure inside the maximum and minimum clearance of the smooth annular seal along the leakage path. The pressures in the maximum and minimum clearance decreases with the increasing axial distance. The pressures in the maximum clearance decrease with the increase of axial distance and . However, the pressure in the minimum clearance increases with the increasing .
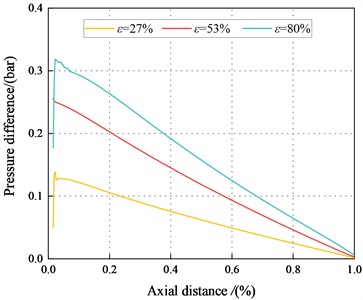
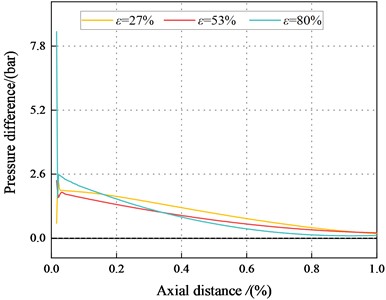
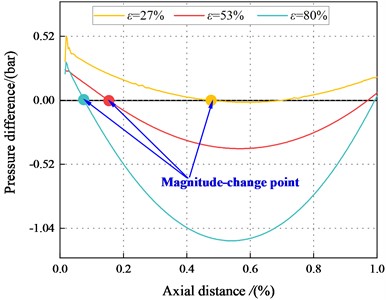
Fig. 14. depicts the pressure difference between the maximum and minimum clearance along the axial direction. The pressure difference between the maximum and minimum clearance decreases with the increasing axial distance. The pressure difference between the maximum and minimum clearance decreases with the increasing . When 500 rpm, 2.1 bar, the pressure difference and the static stiffness coefficient inside the tenth section are all negative.
Fig. 13Circumferential pressure along the axial direction (Laminar flow)
a)500 rpm, 1.1 bar
b)500 rpm, 2.1 bar
c)1000 rpm, 1.1 bar
d)1000 rpm, 2.1 bar
3.2.4. Axial velocity
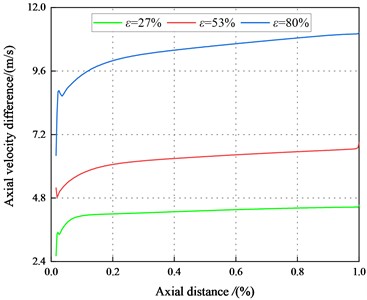
Fig. 15 depicts the axial velocity various with axial distances in different eccentric conditions. The axial velocity increases with the increase of pressure in the maximum clearance, while the minimum clearance is not affected for the same condition. The axial velocity rises with increasing eccentricity in the maximum clearance and decreases in the minimum clearance. The axial velocity difference between the maximum and minimum clearance increases with the eccentricity ratio increases.
Moreover, the axial velocity in the minimum clearance of the tenth section increases more quickly than that inside the maximum clearance. This means that the fluid inside minimum clearance shows greater accelerations, and the inertia effects dominate the flow.
Fig. 14Pressure difference between the maximum and minimum clearance along the axial distance (Laminar flow)
a)500 rpm, 1.1 bar
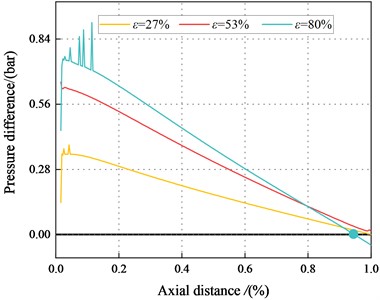
b)500 rpm, 2.1 bar
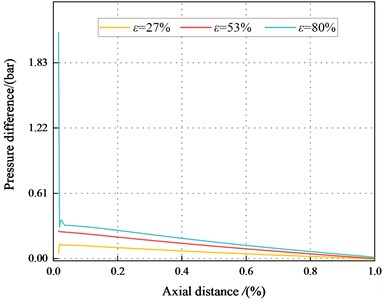
c)1000 rpm, 1.1 bar
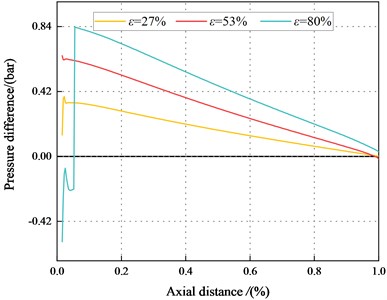
d)1000 rpm, 2.1 bar
Fig. 15Axial velocity between the maximum and minimum clearance along the axial direction (Laminar flow)
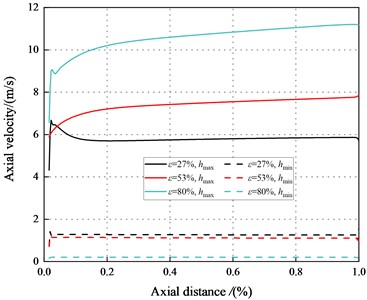
a) Axial velocity (500 rpm, 1.1 bar)
b) Axial velocity difference (500 rpm, 1.1 bar)
3.2.5. Circumferential velocity
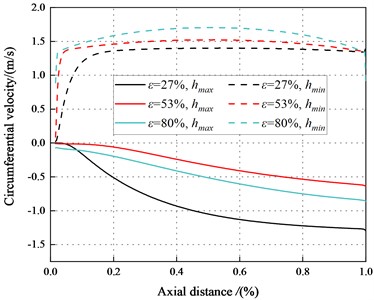
Fig. 16 depicts the variation tendency of circumferential velocity along the axial direction inside the maximum and minimum clearance. It can be observed that the circumferential velocity shows an increasing trend with the increases of axial distance, while it shows an opposite trend in the minimum clearance. The difference in circumferential velocity between the maximum and minimum clearance is small and the seal circumferential velocity changes slowly. Meanwhile, the circumferential velocity gradient in the minimum clearance is almost negligible. Therefore, the negative static stiffness cannot be accounted for by the circumferential velocity.
Fig. 16Circumferential velocity between the maximum and minimum clearance along the axial direction (Laminar flow)
a)500 rpm, 1.1 bar
b)500 rpm, 2.1 bar
3.3. Transition flow
3.3.1. Static characteristics
Fig. 17 depicts radial force vs. eccentricity ratio . Note the radial force is positive in the transition regime. For 2.1 bar, tends to increase and then decrease as increases. And for 4.14 bar at high pressure shows an increasing trend with the increase of . Moreover, difference of the radial force in three eccentric conditions gradually increases with increasing .
Fig. 17Radial force F vs. static eccentricity ratio ε (Transition flow)
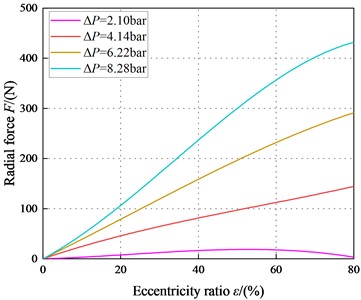
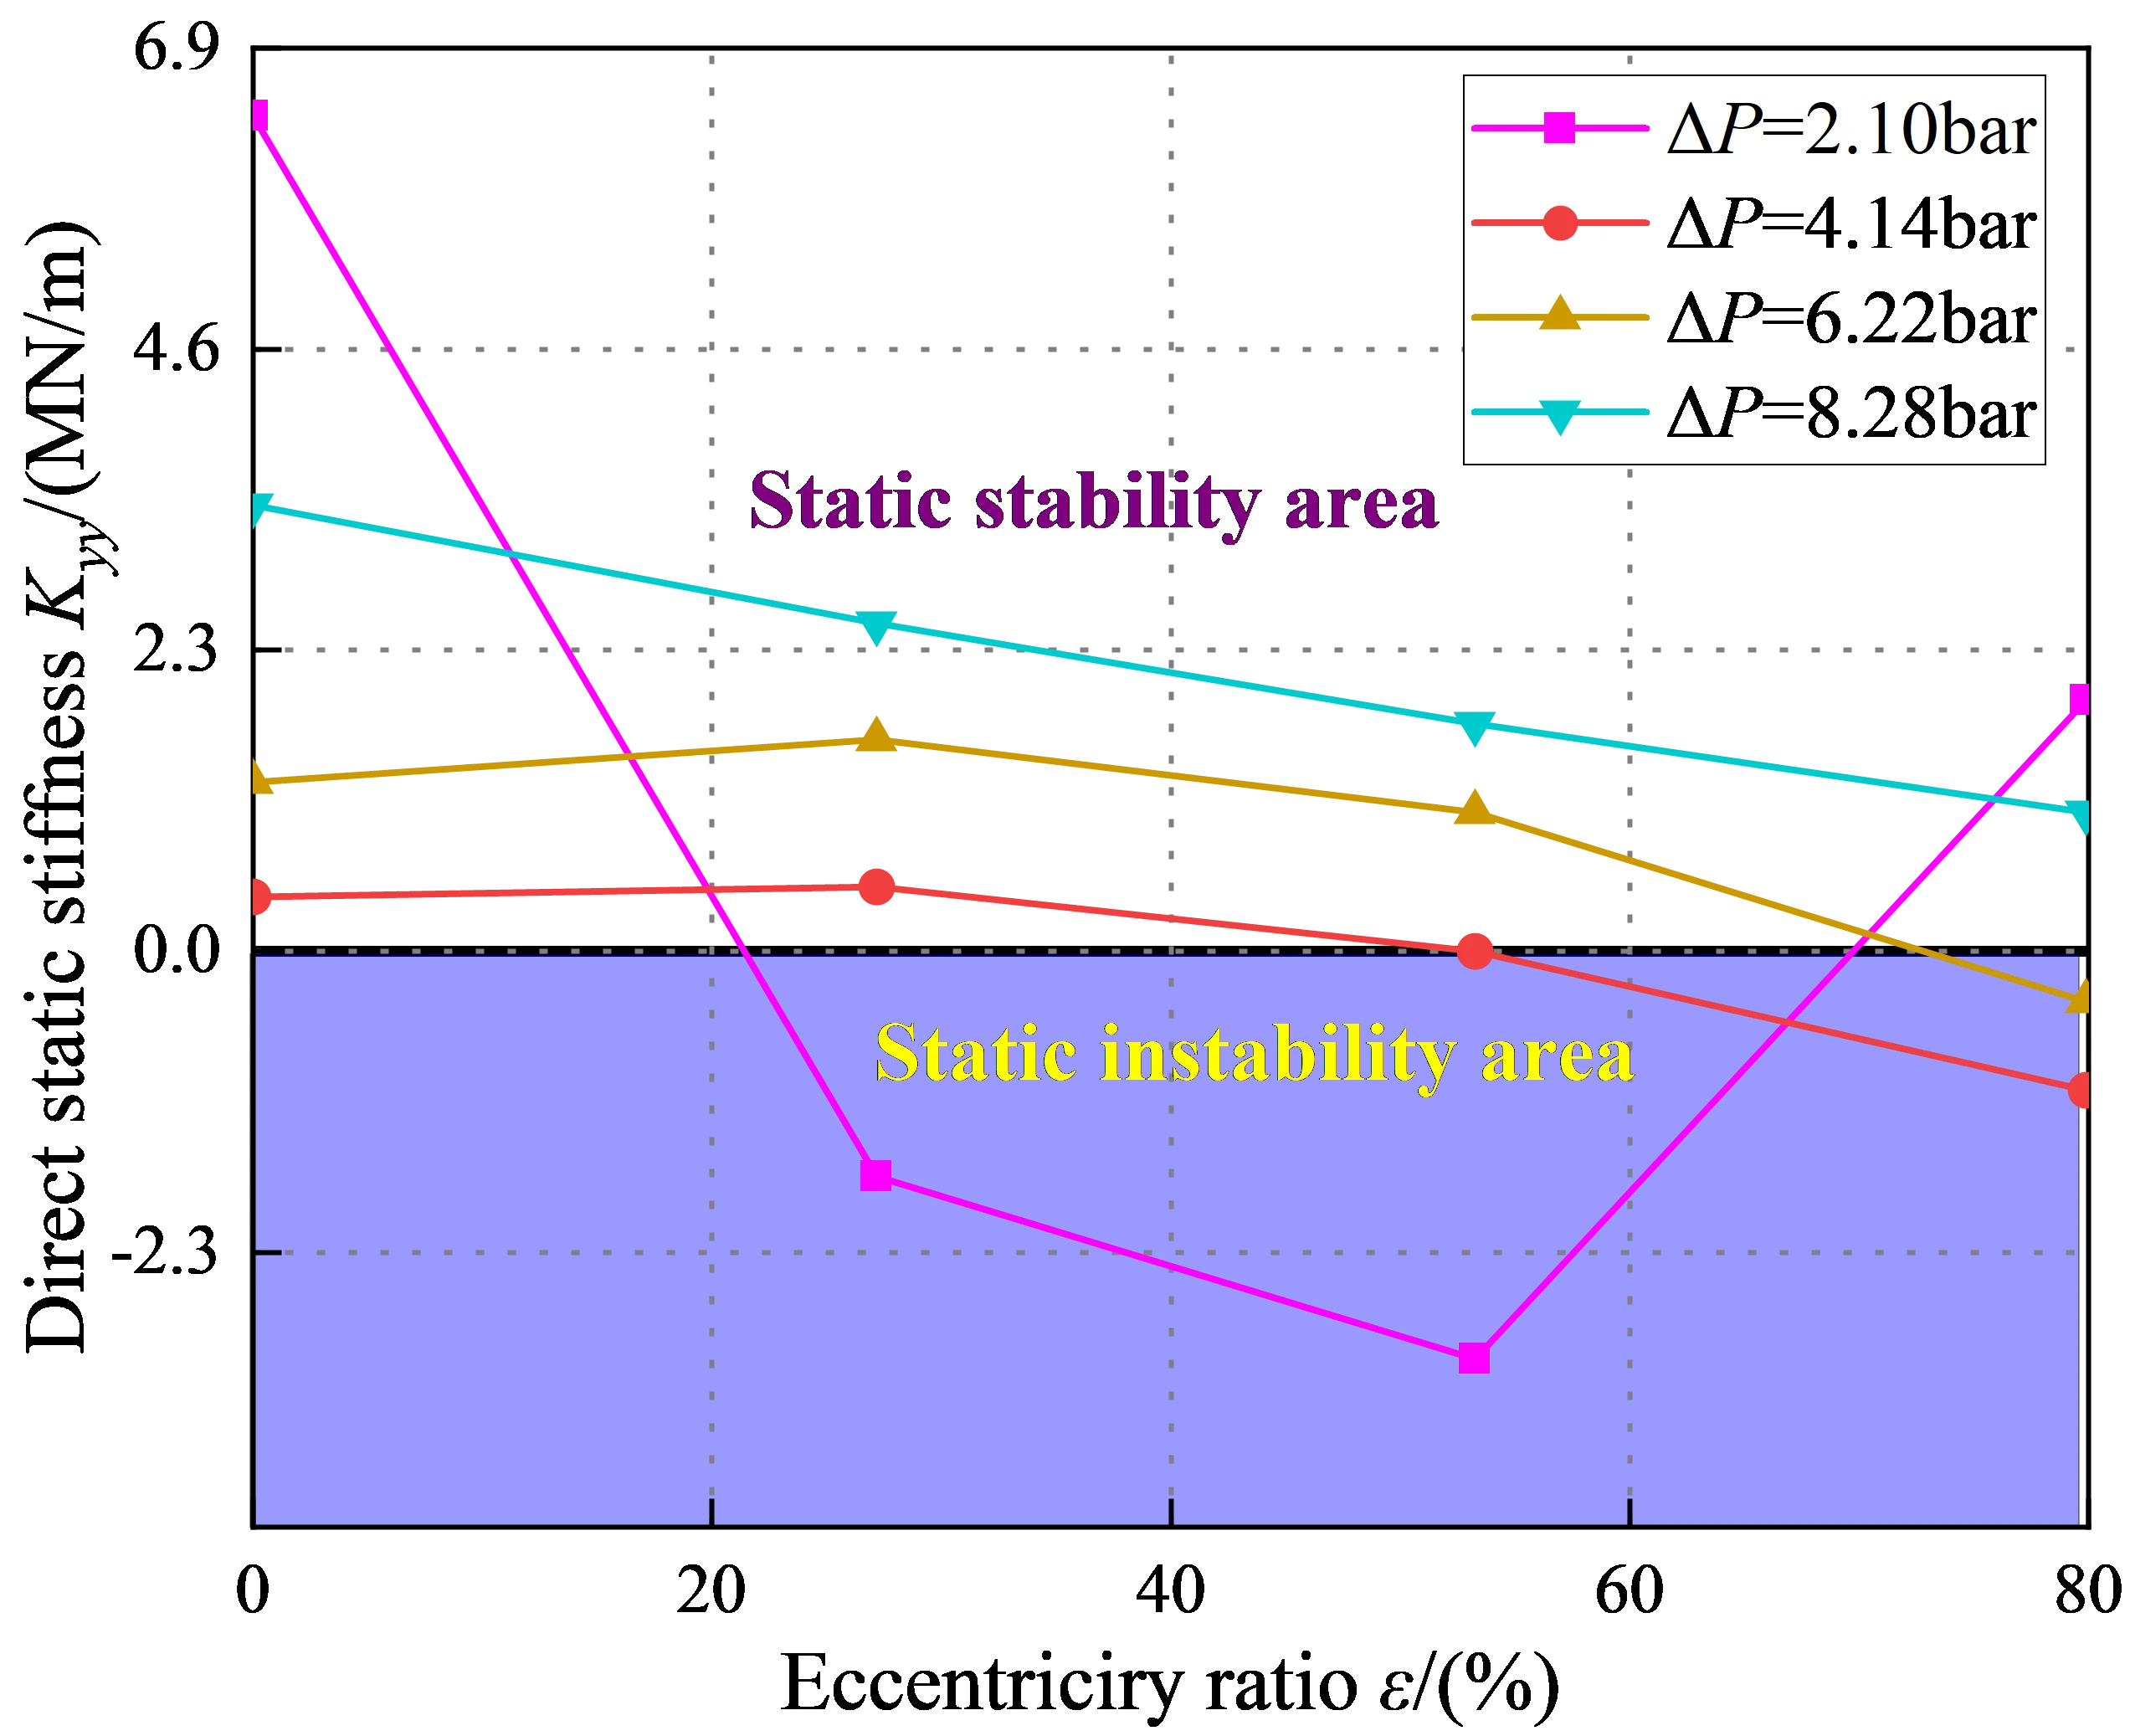
Fig. 18Direct static stiffness coefficient Kyy vs. static eccentricity ratio ε (Transition flow)
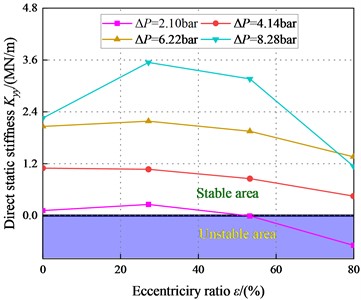
Fig. 18 depicts static stiffness coefficient vs. eccentricity ratio . Notice increases firstly and then decreases. Meanwhile, for 2.1 bar, the static stiffness is negative value at high eccentricity (80 %). For 4.14 bar, all values are negative, which would tend to destabilize the rotor. In a word, the static stability of the system is better at high pressure difference ( 4.14 bar). By contrast, friction coefficient decreases as rises, most transition flow show a positive centering effect. The test data of seal [25] shows that the friction coefficient basically remains little or no changes, and increases from 1200 to 2000. So, 2000 is the upper limit of Yamada’s test data.
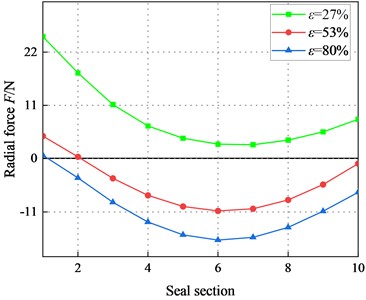
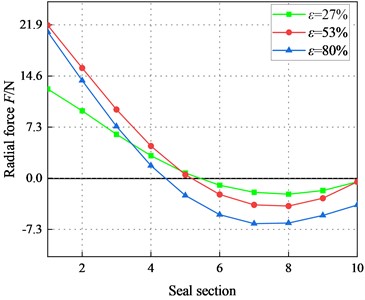
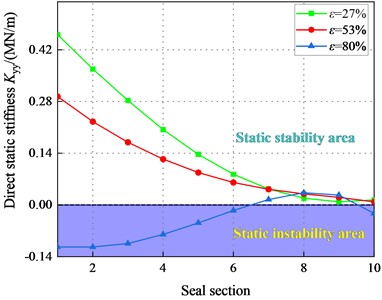
Fig. 19 depicts the variation of radial force for different sections of the seal. For 2.1 bar, decreases overall. Moreover, the difference of on different sections decrease along the axial distance. However, increases with increasing . As the axial distance increases, changes from positive to negative. The negative value region of grows continually as increases, which increases the destabilizing for the seal. For 6.22 bar, increases with the increase of . By contrast, remains positive for 4.14 bar. Therefore, pressure (4.14 bar) in the transition regime is stable.
Fig. 19Radial force F for different rotor sections (Transition flow)
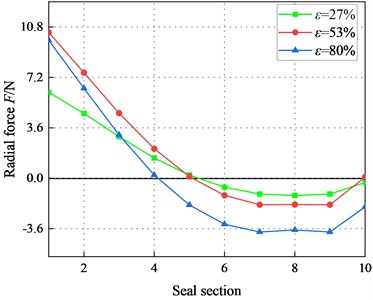
a)6000 rpm, 2.1 bar
b)6000 rpm, 4.14 bar
c)6000 rpm, 6.22 bar
d)6000 rpm, 8.28 bar
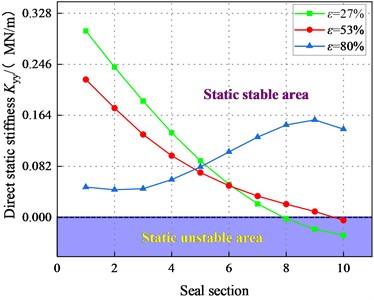
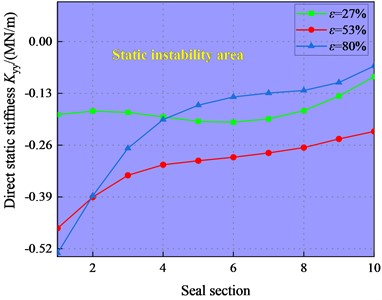
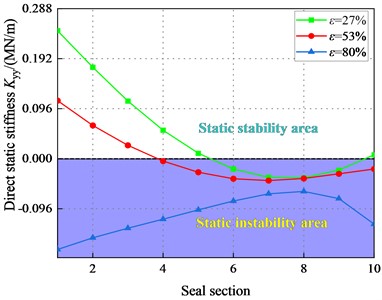
Fig. 20 illustrates the direct static stiffness coefficient at different sealing sections. At 2.1 bar, and 80 %, is all negative. For 2.1 bar, increases with the increase of . is positive at a large pressure difference. Overall, the system is statically stable with a large pressure difference in the transition regime.
3.3.2. Circumferential pressure
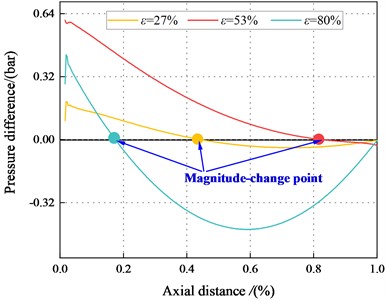
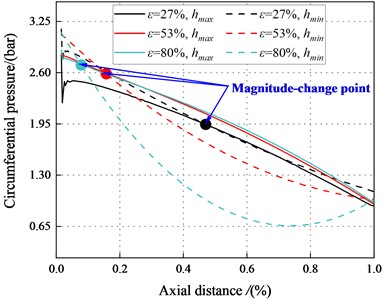
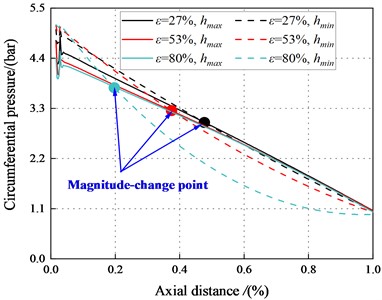
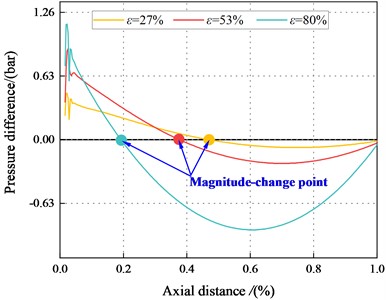
Fig. 21 and Fig. 22 depict the circumferential pressure difference between the maximum and minimum clearance along the axial direction. The result depicts decreases continuously along the axial direction. Meanwhile, at 2.1 bar, a magnitude change point appeared in the flow path. The pressure in the maximum clearance is smaller than that in the minimum clearance when 10 mm. For this section (10 mm), flow characteristic conforms to the traditional Lomakin Effect. The Lomakin effect causes the rotor to produce a restoring force that is opposite to its eccentric direction, pushing the rotor back to its initial position. For 10 mm, pressure in the maximum clearance is greater than that in the minimum clearance. This phenomenon results in a negative reaction force that pushes the rotor away from the seal center.
Fig. 20Direct static stiffness coefficient Kyy (Transition flow)
a)6000 rpm, 2.1 bar
b)6000 rpm, 4.14 bar
c)6000 rpm, 6.22 bar
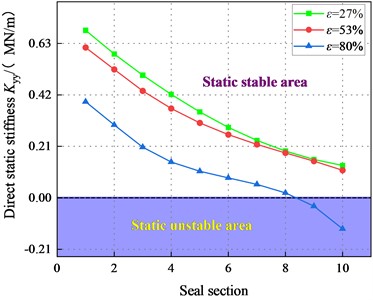
d)6000 rpm, 8.28 bar
Fig. 21Circumferential pressure distribution (Transition flow)
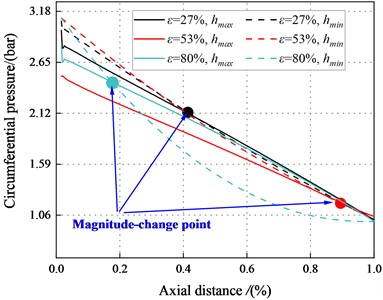
a)6000 rpm, 2.1 bar
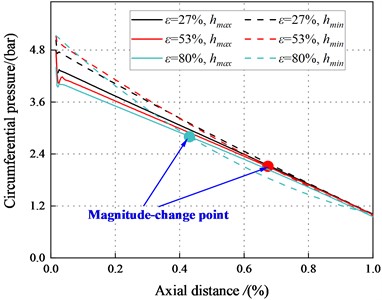
b)6000 rpm, 4.14 bar
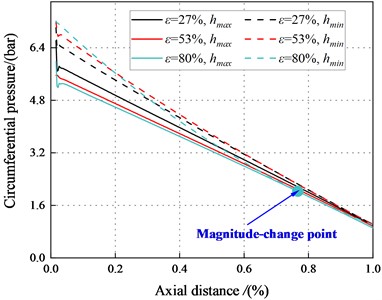
c)6000 rpm, 6.22 bar
d)6000 rpm, 8.28 bar
Fig. 22The pressure difference between the maximum and minimum clearance for different eccentric conditions (Transition flow)
a)6000 rpm, 2.1 bar
b)6000 rpm, 4.14 bar
c)6000 rpm, 6.22 bar
d)6000 rpm, 8.28 bar
For 53 %, the magnitude change point tends to move toward 1st section as increases, and the Lomakin effect weakes. However, at 80 %, the magnitude-change point tends to move to the tenth section as increases, and the Lomakin effect enhances gradually. As increases, and the inertia effect enhances.
For 2.1 bar, and 80 %, the pressure at maximum clearance is higher than that at the minimum clearance. This finding contradicts the Lomakin effect. The fluid inertia force and viscous effect can account for this phenomenon. On the one hand, the flow at the seal accelerates with the increase of eccentricity, and the minimum clearance can no longer ignore the wall friction. On the other hand, the flow viscosity effect is enhanced, and the traditional Lomakin effect weakes.
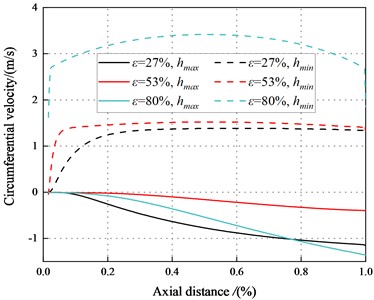
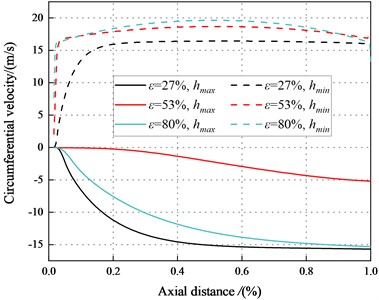
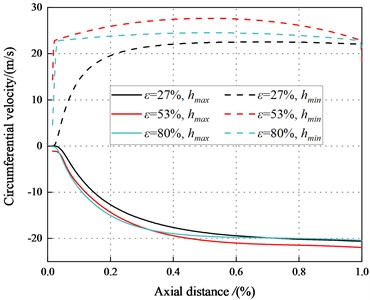
3.3.3. Circumferential velocity
Fig. 23 depicts axial velocity vs. axial distance. The results conduct the difference in circumferential velocity between the maximum and minimum clearance in transition flow is greater than that in laminar flow. For the minimum clearance, fluid flows faster in the circumferential direction and the pressure is lower. The viscous dissipation of fluid reduces the pressure in the minimum clearance, the direct static stiffness tends to be negative at a high eccentricity ratio.
The circumferential flow of annular seal fluid is disrupted, and this will lead to increasing the vicious influence of flow. The radial force decreases with in decrease of .
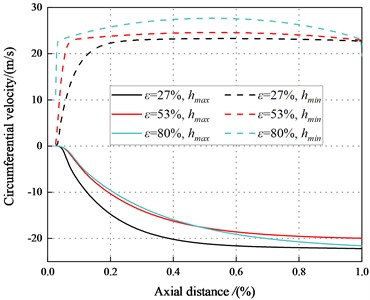
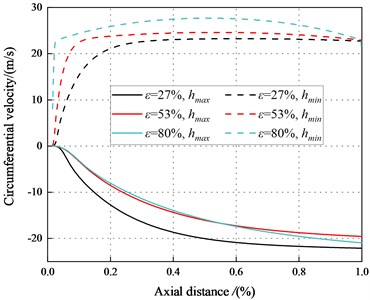
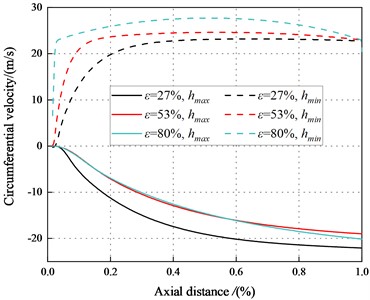
Fig. 23The circumferential velocity between the maximum and minimum clearance for different axial distance (Transition flow)
a)6000 rpm, 2.1 bar
b)6000 rpm, 4.14 bar
c)6000 rpm, 6.22 bar
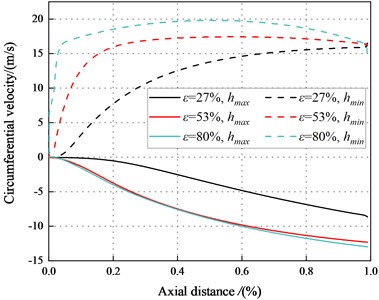
d)6000 rpm, 8.28 bar
As the eccentricity increases, the viscosity effect of smooth annular seal at the maximum clearance increases, while the inertia effect at the minimum clearance is hardly affected. Thus, viscous force dominates instead of the typical annular seal inertia effects. The circumferential velocity of maximum clearance is significantly lower than that of the minimum clearance, which increase the effect of energy dissipation at the maximum clearance. increase with the increasing pressure at the maximum clearance. Thus, the seal is statically unstable. The growth rates of the circumferential velocity go up when the eccentricity ratio increases and the inertia effect enhances.
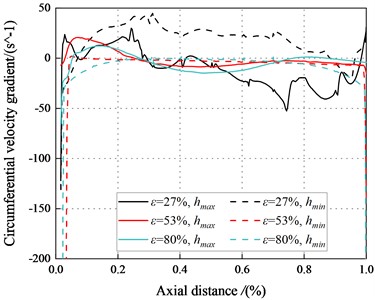
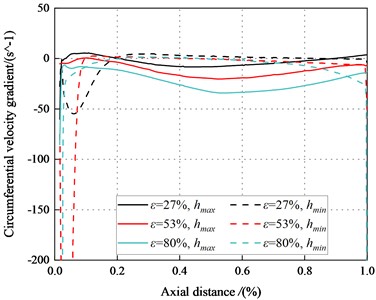
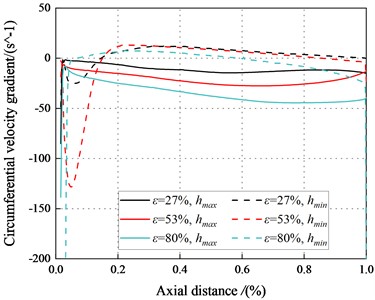
3.3.4. Circumferential velocity gradient
The circumferential velocity gradients represent the amplitude change rate of the circumferential velocity at the average sealing clearance. The change in the circumferential velocity gradients affect the viscous effect of the fluid within the seal. Fig. 24 displays the circumferential velocity gradients varying with eccentricity ratios (27 %, 53 %, 80 %) along the axial direction. The circumferential velocity gradients in the minimum clearance are positive, while the circumferential velocity gradients in the maximum clearance are negative. The circumferential velocity gradients decrease as the eccentricity ratio rises. The circumferential velocity gradients for the minimum clearance are close to zero. The negative circumferential velocity gradients in the maximum clearance clearance to a strong viscous effect in the seal. The dominant viscous effect leads to negative direct static stiffness. The negative region in the minimum clearance decreases with the increase of eccentricity. The system may be statically unstable with the high eccentricity ratios at 2.1 bar. In brief, the system tends to be statically stable as increases.
Fig. 24Circumferential velocity gradient in the maximum and minimum clearance for different eccentric conditions (Transition flow)
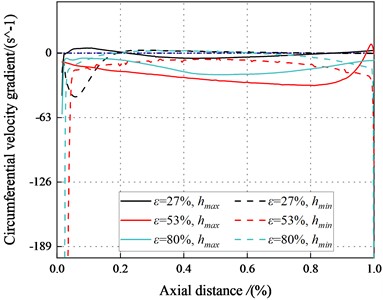
a)6000 rpm, 2.1 bar
b)6000 rpm, 4.14 bar
c)6000 rpm, 6.22 bar
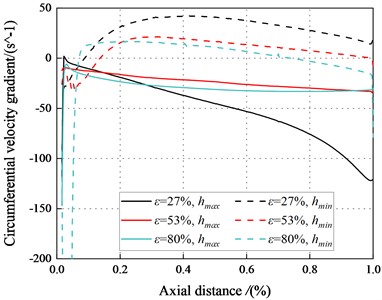
d)6000 rpm, 8.28 bar
3.4. Turbulent flow
3.4.1. Static characteristics
Fig. 25 provides radial force vs. the eccentricity ratio . Results show that radial force shows a negative sign at 2.1 bar. When the eccentricity increases, the negative region increases. For 6.22 bar, the radial force shows a first increase and then decrease with increasing . For 6.22 bar, the magnitudes of the radial force increase with ε increases. And the difference for the radial forces increase as increases.
Fig. 25Radial force F vs. static eccentricity ratio ε (Turbulent flow)
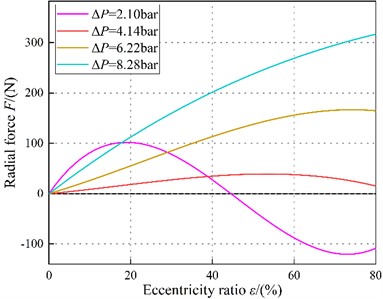
Fig. 26Direct static stiffness coefficient Kyy vs. static eccentricity ratio ε (Turbulent flow)
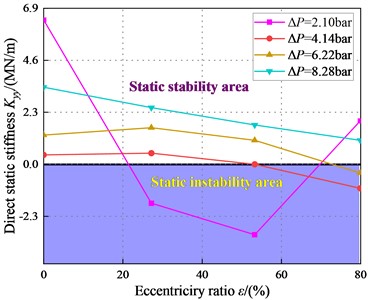
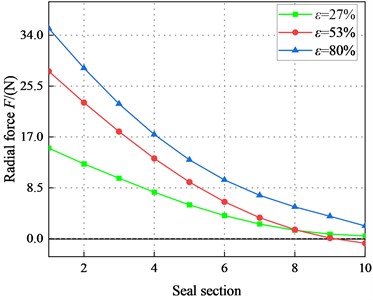
Fig. 27Radial force F (Turbulent flow)
a)8500 rpm, 2.1 bar
b)8500 rpm, 4.14 bar
c)8500 rpm, 6.22 bar
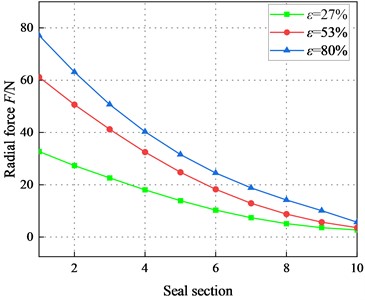
d)8500 rpm, 8.28 bar
Fig. 26 depicts vs. static eccentricity ratio . With the increasing static eccentricity ratio , the changes from positive to negative. The is positive at 8.28 bar. However, has a negative region with low . The system will be statically unstable at 2.1 bar. In the turbulent regime, the static stability of the system is stable at high .
The trend is consistent with that of the turbulent and transition flow regimes, but the negative stiffness region of the turbulent region is larger than the transition region. Thus, the turbulent flow shows worse static stability performance than transition flow.
Fig. 27 illustrates radial force in different sections (1, 2, …, 9, 10). Radial force is negative under the low-pressure difference (2.1 bar), and their values increase with the increasing . Meanwhile, the negative region gradually decreases. For 6.22 bar, the direct static stiffness is positive. The static stability of the system in the turbulent flow is stable under high pressure difference ( 6.22 bar).
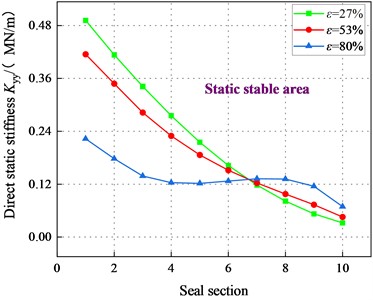
Fig. 28 depicts the in different sections vs. . For 2.1 bar, the show negative signs, as the grows, the negative area of decreases. Both and transform from negative to positive, which means that the system is statically stable. For 8.28 bar, is positive. Hence, when the fluid is in high pressure difference region, the system is statically stable.
Fig. 28Direct static stiffness coefficient Kyy (Turbulent flow)
a)8500 rpm, 2.1 bar
b)8500 rpm, 4.14 bar
c)8500 rpm, 6.22 bar
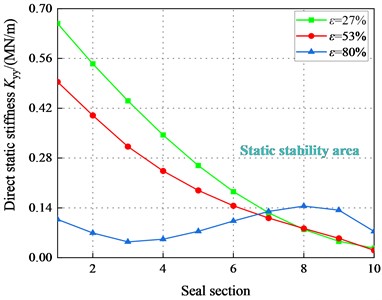
d)8500 rpm, 8.28 bar
3.4.2. Circumferential pressure
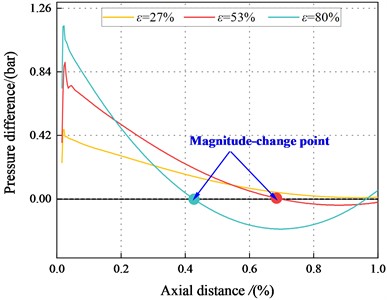
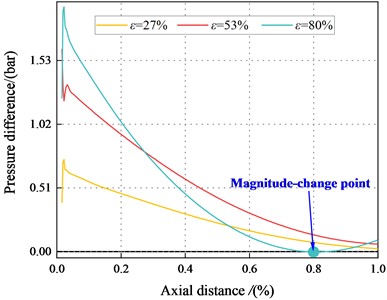
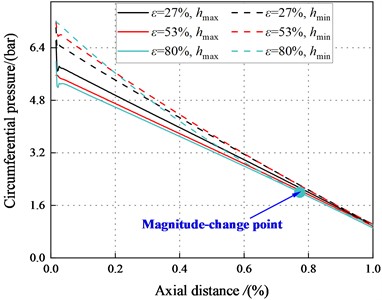
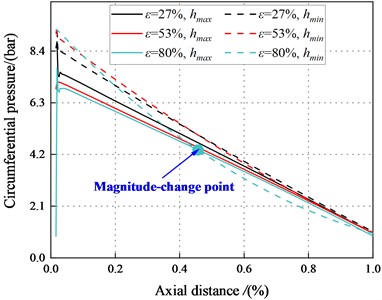
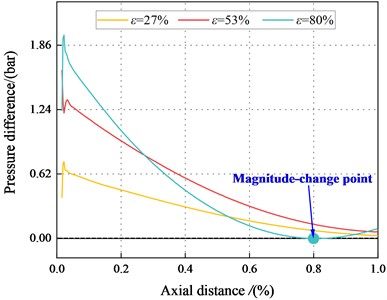
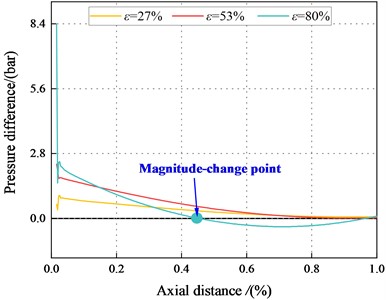
Fig. 29 and Fig. 30 show the pressure distributions in the maximum and minimum clearance along the axial direction for the annular seal. It can be observed that the decreases with the increase of axial direction. The trend is consistent with that of transition regime. For 6.22 bar, in the tenth section, the maximum clearance pressure is greater than the minimum clearance pressure. The fluid inertia force and viscous effect can account for this phenomenon. Results also show the clearance pressure crossover point appears at a specific location of the seal. Point moves to the first section with increasing eccentricity, and the Lomakin effect lessens. The results also show that for the seal with the same eccentricity, the maximum and minimum clearance pressure difference in the turbulent region is smaller than that in the transition region. The direct static stiffness becomes to be negative at low eccentricity (4.14 bar). In the turbulent regime, the static stability of the system is unstable at low pressure.
Fig. 29Pressure in the smooth annular seal (Turbulent flow)
a)8500 rpm, 2.1 bar
b)8500 rpm, 4.14 bar
c)8500 rpm, 6.22 bar
d)8500 rpm, 8.28 bar
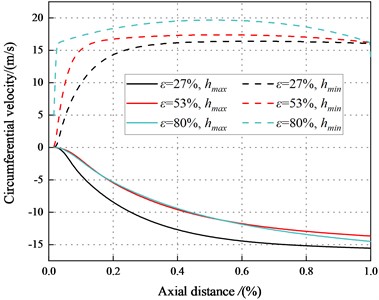
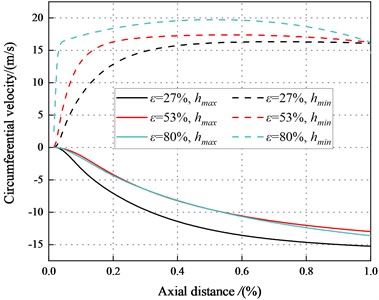
3.4.3. Circumferential velocity
Fig. 31 depicts the circumferential velocity distribution in the maximum and minimum clearance along the leakage path for different eccentricity ratios. Compared with the transition flow, the circumferential velocity between maximum and minimum clearance in the turbulent regions is larger.
The circumferential velocity in the minimum clearance is faster than that in the maximum clearance, which reduces the pressure in the minimum clearance. Because the viscous dissipation of the fluid in the minimum clearance reduces the pressure in the minimum clearance. Viscous dissipation of the fluid at the minimum clearance reduces the pressure of the minimum clearance fluid, and static stiffness shows negative signs at high eccentricity ( 53 %). The circumferential velocity increases in the negative region at the maximum clearance, which enhances the viscous effect in the seal and reduces the pressure at the maximum clearance. The seal exhibits negative direct stiffness coefficients, so it is statically unstable.
On the one hand, the effect of energy dissipation is weakened in the minimum clearance by the larger circumferential velocity of the minimum clearance and the smaller pressure in the minimum clearance. On the other hand, the circumferential velocity in the maximum clearance is significantly smaller than that in the minimum clearance, which makes the energy dissipation in the maximum clearance effect stronger. Therefore, the increase of pressure in the maximum clearance will lead to the increase of pressure difference between the maximum and the minimum clearance. Hence, the system is statically unstable.
Fig. 30The pressure difference between the maximum and minimum clearance for different eccentric conditions (Turbulent flow)
a)8500 rpm, 2.1 bar
b)8500 rpm, 4.14 bar
c)8500 rpm, 6.22 bar
d)8500 rpm, 8.28 bar
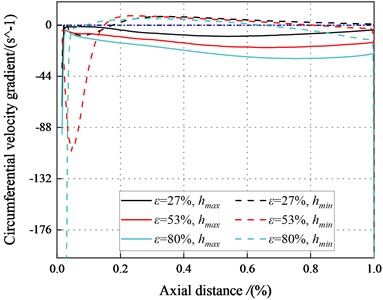
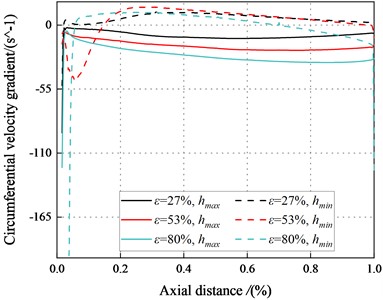
3.4.4. Circumferential velocity gradient
Fig. 32 presents the circumferential velocity gradient distribution along the axial direction under the turbulent regime.
Fig. 31Circumferential velocity between the maximum and minimum clearance (Turbulent flow)
a)8500 rpm, 2.1 bar
b)8500 rpm, 4.14 bar
c)8500 rpm, 6.22 bar
d)8500 rpm, 8.28 bar
Fig. 32Circumferential velocity gradient in the maximum and minimum clearance (Turbulent flow)
a)8500 rpm, 2.1 bar
b)8500 rpm, 4.14 bar
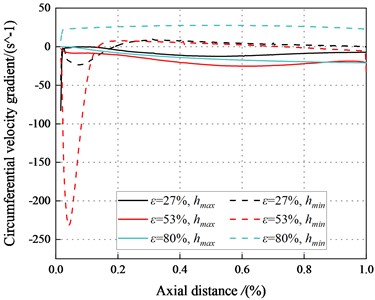
c)8500 rpm, 6.22 bar
d)8500 rpm, 8.28 bar
The circumferential velocity gradient in the minimum clearance changes from a negative value to a positive value. For the maximum clearance, the circumferential velocity gradient is close to zero. The large negative value of the circumferential velocity gradient in the minimum clearance results in the intense viscous effect in the seal. This dominant viscous effect leads to the negative direct static stiffness, even for the seal with low eccentricity ratios. For low , the direct static stiffness is susceptible to be negative for high eccentricity ratios. The viscous effect is the main factor for the de-centering reaction force and the negative direct static stiffness under the turbulent regime.
4. Conclusions
In this paper, the static stability of smooth annular liquid seal under different working conditions (rotational speed, axial distance drop and eccentricity) is discussed. A full three-dimensional numerical model was established by CFD method to predict the flow characteristics under three different flow states (laminar flow, transition flow and turbulent flow).
The magnitude and direction of the radial force on the annular seal is related to the flow state of the fluid inside the seal. The radial force is positive in laminar and transition flows, while it may be negative in turbulent flows.
The increases as the rotational speeds increase. At 2000 rpm, the flow state is dominated by laminar flow. As the rotational speeds increase, the transition flow (2000-7000 rpm) gradually transition to the turbulent regime (7000 rpm).
When the flow state changes from laminar state to transition static state, the direct static stiffness decreases, resulting in static instability of smooth annular seal. Rotor eccentricity affects the circumferential velocity gradient variation in minimum clearance, and for transition and turbulent flow in high eccentricity (80 %), the dominant viscous effect and inertial effect lead to the negative radial force and the negative direct static stiffness coefficient.
The radial force and direct static stiffness of the laminar flow state are positive. The transition flow only has negative direct static stiffness at high eccentricity, while the turbulent low eccentricity radial force and direct static stiffness have negative static stiffness coefficients even at low eccentricity. Hence, the smooth annular liquid seal shows best performance in the laminar flow and worst performance in the turbulent flow.
References
-
R. E. Chupp, R. C. Hendricks, S. B. Lattime, and B. M. Steinetz, “Sealing in turbomachinery,” Journal of Propulsion and Power, Vol. 22, No. 2, pp. 313–349, Mar. 2006, https://doi.org/10.2514/1.17778
-
Y. Lin, J. Zhang, X. Yu, S. Chen, and Y. Guo, “Gas leakage evaluation of metallic sealing surfaces with annular morphology,” in Journal of Physics: Conference Series, Vol. 2437, No. 1, p. 012008, Jan. 2023, https://doi.org/10.1088/1742-6596/2437/1/012008
-
D. W. Childs, J. Yang, L. San Andrés, J. M. Torres Rueda, and J. Alex Moreland, “Measured leakage and rotordynamic force coefficients for two liquid annular seal configurations: smooth-rotor/grooved-stator versus grooved-rotor/smooth-stator,” Journal of Engineering for Gas Turbines and Power, Vol. 145, No. 3, p. 03100, Mar. 2023, https://doi.org/10.1115/1.4055638
-
D. W. Childs, Turbomachinery Rotordynamics with Case Studies. Wellborn, Texas: Minter Spring Publishing, 2016.
-
Q. Gu, J. Yang, W. Zhang, and M. Zhang, “On the rotordynamic performance of an annular gas seal with self-adaptive jet slots: Comparisons to the swirl brake and shunt injection,” Tribology International, Vol. 176, p. 107898, Dec. 2022, https://doi.org/10.1016/j.triboint.2022.107898
-
M. Zhang, J. Yang, and W. Zhang, “Annular seal rotordynamic stability enhancement with circumferential spiral flow control using helical deflectors,” Journal of Mechanical Science and Technology, Vol. 36, No. 3, pp. 1263–1277, Mar. 2022, https://doi.org/10.1007/s12206-022-0217-4
-
T. Inoue and K. Yamada, “Simplified improvement of higher order extended bulk flow analysis specialized for derivation of rotordynamic coefficients of the annular plain seal with large static eccentricity,” Journal of Computational and Nonlinear Dynamics, Vol. 17, No. 10, p. 10100, Oct. 2022, https://doi.org/10.1115/1.4054680
-
D. Pan, H. Xu, B. Liu, and C. Yang, “Research on sealing characteristics of annular power cylinder based on twin-rotor piston engine,” Proceedings of the Institution of Mechanical Engineers, Part C: Journal of Mechanical Engineering Science, Vol. 236, No. 3, pp. 1861–1876, Feb. 2022, https://doi.org/10.1177/09544062211021440
-
R. Tiwari, “A review of the experimental estimation of the rotor dynamic parameters of seals,” The Shock and Vibration Digest, Vol. 37, No. 4, pp. 261–284, Jul. 2005, https://doi.org/10.1177/0583102405055442
-
J. Li, X. Guo, C. Yu, and S. Huang, “Catastrophe performance analysis of steam-flow-excited vibration in the governing stage of large steam turbines with partial admission,” Journal of Energy Resources Technology, Vol. 135, No. 4, p. 04160, Dec. 2013, https://doi.org/10.1115/1.4023742
-
D. G. Huang and X. S. Li, “A new model of exciting force in a gas seal of large rotating machinery: N-S method,” (in Chinese), Proceedings of the CSEE, Vol. 20, No. 6, pp. 75–78, 2000, https://doi.org/10.13334/j.0258-8013.pcsee.2000.06.019
-
R. Leonard and W. B. Rowe, “Dynamic force coefficients and the mechanism of instability in hydrostatic journal bearings,” Wear, Vol. 23, No. 3, pp. 277–282, Mar. 1973, https://doi.org/10.1016/0043-1648(73)90016-1
-
D. W. Childs, L. E. Rodriguez, V. Cullotta, A. Al-Ghasem, and M. Graviss, “Rotordynamic-coefficients and static (equilibrium loci and leakage) characteristics for short, laminar-flow annular seals,” Journal of Tribology, Vol. 128, No. 2, pp. 378–387, Apr. 2006, https://doi.org/10.1115/1.2164468
-
N. Zirkelback and L. San Andres, “Bulk-flow model for the transition to turbulence regime in annular pressure seals,” Tribology Transactions, Vol. 39, No. 4, pp. 835–842, Jan. 1996, https://doi.org/10.1080/10402009608983602
-
C. Zhong, L. Zhai, J. Guo, B. Cui, and G. Chen, “Static characteristics and leakage rates of smooth annular seals based on a new solution method for gas-liquid two-phase conditions,” Journal of Marine Science and Engineering, Vol. 9, No. 5, p. 523, May 2021, https://doi.org/10.3390/jmse9050523
-
A. A. Lomakin, “Calculating of critical speed and securing of dynamic stability of high pressure pumps with reference to forces arising in seal clearances,” Energomashinostroenie, Vol. 4, No. 1, pp. 1158–1162, 1958.
-
D. P. Fleming, “Stiffness of straight and tapered annular gas path seals,” Journal of Lubrication Technology, Vol. 101, No. 3, pp. 349–354, Jul. 1979, https://doi.org/10.1115/1.3453371
-
C. R. Alexander, D. W. Childs, and Z. Yang, “Theory versus experiment for the rotordynamic characteristics of a smooth annular gas seal at eccentric positions,” Journal of Tribology, Vol. 117, No. 1, pp. 148–152, Jan. 1995, https://doi.org/10.1115/1.2830591
-
M. Arghir and A. Mariot, “About the negative direct static stiffness of highly eccentric straight annular seals,” Journal of Engineering for Gas Turbines and Power, Vol. 137, No. 8, p. 08250, Aug. 2015, https://doi.org/10.1115/1.4029624
-
W. Zhang, L. Chen, J. Yang, J. Yang, and C. Li, “Static instability of the smooth annular seals with choked/unchoked flow,” Tribology International, Vol. 144, p. 106120, Apr. 2020, https://doi.org/10.1016/j.triboint.2019.106120
-
H. F. Black, “Effects of hydraulic forces in annular pressure seals on the vibrations of centrifugal pump rotors,” Journal of Mechanical Engineering Science, Vol. 11, No. 2, pp. 206–213, Apr. 1969, https://doi.org/10.1243/jmes_jour_1969_011_025_02
-
L. Y. Balakh and A. N. Nikiforov, “The reduction of the vibration level in high-speed rotor systems by means of floating seal rings,” Journal of Machinery Manufacture and Reliability, Vol. 42, No. 4, pp. 276–280, Jul. 2013, https://doi.org/10.3103/s105261881304002x
-
J. Salas, “The reduction of the vibration level in high-speed rotor systems by means of floating seal rings,” M.S. Thesis, Texas A & M University, College Station, Texas, 2015.
-
M. M. G. Kuhr, G. Ludwig, and P. F. Pelz, “Measurement and simulation of the dynamic characteristics of plain and profiled annular seals,” IOP Conference Series: Earth and Environmental Science, Vol. 774, No. 1, p. 012073, Jun. 2021, https://doi.org/10.1088/1755-1315/774/1/012073
-
D. W. Childs and J. Bullock, “Static performance of smooth liquid annular seals in the transition and turbulent regimes,” in ASME Turbo Expo 2021: Turbomachinery Technical Conference and Exposition, Jun. 2021, https://doi.org/10.1115/gt2021-58543
-
Y. Yamada, “Resistance of a flow through an annulus with an inner rotating cylinder,” Bulletin of JSME, Vol. 5, No. 18, pp. 302–310, 1962, https://doi.org/10.1299/jsme1958.5.302
About this article

The authors are grateful for the Grants from the National Natural Science Foundation of China (51875361), Natural Science Foundation of Shanghai (20ZR1439200).
The datasets generated during and/or analyzed during the current study are available from the corresponding author on reasonable request.
Zhongjie Yang: conceptualization, methodology. Jin Feng: data analysis, software. Jingyu Wan: original draft preparation. Xiaobin Yu: reviewing and editing. Zhangjin He: data analysis, reviewing. Wanfu Zhang: software, reviewing.
The authors declare that they have no conflict of interest.
