Abstract
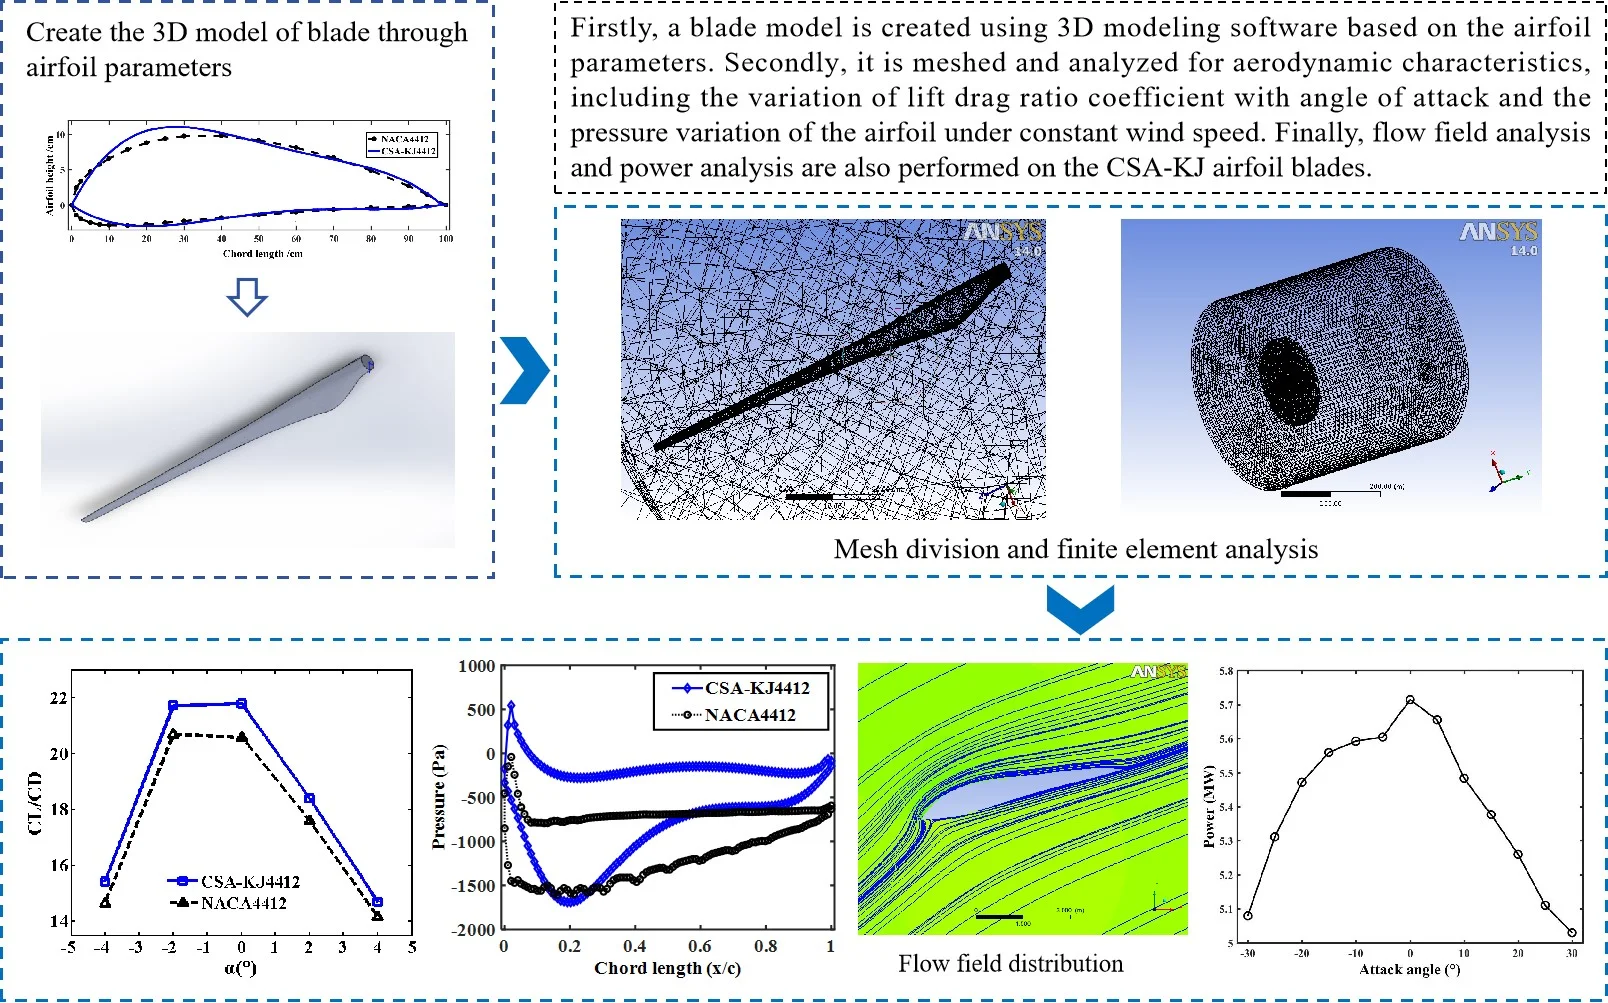
In order to enable the offshore wind farm to produce electric energy efficiently, stably and economically, the optimization method of CSA-KJ airfoil is proposed, and the optimized CSA-KJ4412 airfoil is obtained, and the aerodynamic characteristics of the airfoil are compared and analyzed. Combined with Wilson method, the high-power CSAKJ4412-08 wind turbine blade is designed, the flow field characteristics of the blade under different working conditions are simulated and analyzed, and its power is verified. The results show that compared with the NACA4412 airfoil, the average lift-drag ratio coefficient and the maximum value of the CSA-KJ4412 airfoil increase. Meanwhile, the pressure distribution rises, and the aerodynamic characteristic is better. The fluid around CSAKJ4412-08 blade at different attack angles is attached to the blade surface tightly for adhesive flow, and no stall phenomenon is identified. The pressure on the suction and pressure surfaces for the optimized CSAKJ4412-08 blade shows an opposite trend as the wingspan in-creases, leading to an increase in the pressure difference between the upper and lower surfaces, thereby improving the lift of the blade. In the range of –30° to 30° attack angle, the power of CSAKJ4412-08 blade increases first and then decreases as the attack angle rises, and the ratio of the maximum power to the rated value reaches 71.38 %, indicating that the optimized CSAKJ4412-08 blade exhibits better aerodynamic characteristics. The relevant results can provide technical reference for the optimal design of wind turbine blades.
Highlights
- The optimization method of CSA-KJ airfoil was proposed.
- A high-power CSAKJ4412-08 wind turbine blade was designed.
- The flow field characteristics under different conditions were obtained.
- The CSAKJ4412-08 blade power rises first and then reduces in a certain attack angle.
- The ratio of the maximum power of CSAKJ4412-08 blade to the rated one reaches 71.38%.
1. Introduction
With the rapid development of global economy, the demand for energy has been increasing significantly. Due to the depletion of non-renewable energy such as coal, oil and natural gas, the cost of traditional energy is growing gradually, and the contribution of renewable energy to energy consumption has enhanced rapidly [1]. As an important clean and renewable energy, wind energy has been developing rapidly all over the world by virtue of its abundant reserves, short construction period and relatively mature technology [2-3]. The wind turbine design is an important part of wind energy utilization, and the blade design directly affects the power generation efficiency of wind turbines. With the increasing complexity of wind turbine operating conditions, the blade optimization design and the performance analysis become particularly important, so the flow field distribution and the power analysis of offshore wind turbine blades have important theoretical significance and application value [4].
The blade with high wind energy conversion efficiency is the crucial factor to ensure the power generation of wind turbine, and the blade airfoil with excellent aerodynamic performance can greatly improve the wind energy conversion efficiency, scholars from around the world have conducted a series of studies on airfoil optimization [5-7]. Umutlu et al. [8] generated the airfoil polar points based on the Bezier curves, employed XFOIL as a solution tool and combined it with genetic algorithm (GA) to obtain the optimization code of high lift airfoil, the optimized airfoil shape produces more lift than the original airfoil shape. In order to efficiently perform a low-Reynolds-number airfoil design, Li et al. [9] presented a tailored airfoil modal parameterization method and developed an airfoil optimization program with low Reynolds number using deep learning technology, thus improving the optimization efficiency. Tang et al. [10] combined the quantitative interval method with Kriging model to optimize the airfoil, thereby improving the reliability of wind turbine design, and the verification was conducted by computational fluid dynamics (CFD) method. The approach Bouhlel et al. [11] proposed a method for rapid airfoil design in combination with artificial neural network, and the obtained airfoil optimization solution is similar to the high-fidelity CFD one. Khalil et al. [12] improved the aerodynamic efficiency of wind turbine by modifying airfoil geometry and adopted a non-uniform rational B-spline approximation of the airfoil to reduce the number of optimization design variables, this methodology determined the best airfoil for the design of a small wind turbine, and the improved power coefficient was 0.42. Zhou et al. [13] combined the airfoil analysis tool Rfoil and the wind turbine analysis code Bladed to examine the effects of serrations on the performance of a 2.3 MW wind turbine, including power output and load characteristic.
The blade optimization design involves aerodynamic and structural performance. Domestic and foreign scholars have accumulated a lot of research results in the blade optimization design of wind turbine. Rodriguez et al. [14] proposed a comprehensive methodology for the design optimization of wind turbine blade which coupled a numerical model based on CFD to a GA-based optimization tool, and designed the blade with excellent aerodynamic performance such as tip speed ratio by combining BEM theory. Xu et al. [15] developed a wind turbine blade design and optimization program to solve the problem of coupled power generation efficiency and blade structure strength design, which can be used as a general program for wind turbine blades and propeller blades. Chen et al. [16] optimized the topology of wind turbine blades with the goal of minimum flexibility, and analyzed the influence of different characteristic parameters on blade performance with finite element method, and the updated blade structure has a high reliability. In order to maximize the sum of energy production at the selected sites, Azizi et al. [17] considered the known Riso wind turbine blade as the base geometry and optimized it by modifying blade element momentum (BEM) theory and genetic algorithm. Wu et al. [18] proposed a simple iterative method to design the structure of the composite blade based on the numerical stress analysis of the turbine blade and constructed the blade model for the stress analysis by ANSYS. Buckney et al. [19] applied topology optimization to find alternative structural configurations for a 45 m blade from a 3 MW wind turbine, and then the sizing optimization was performed on a section with the trailing edge reinforcement.
With the continuous growth of wind turbine blade size, the blade flexibility is also increasing, and the aeroelastic deformation under the effect of flow field is also more obvious. Therefore, the blade aerodynamic performance is an essential evaluation criterion to measure the rationality of blade design [20-22]. In order to determine the optimal blade angle, Afshari et al. [23] conducted numerical simulation on various blade angles and compared with the experimental results of NACA4412 blade, and it was found that the blade angle within the range of 5°-10° showed the best performance. Qiu et al. [24] used RNG turbulence model and Coupled algorithm to simulate the unsteady value of the aerodynamic performance of the model, and found that the wind speed around the wind turbine blades has a significant gradient. Nejat et al. [25] applied the multi-objective particle swarm optimization algorithm to optimize the chord length distribution, the twist and the rotation speed of the airfoil, and the improved blade element momentum theory was employed to calculate the power of the wind turbine generator in the optimization process. In order to study the impact of wind speed and turbulence model on the numerical simulation of aerodynamic characteristics for the wind turbine, Ji et al. [26] employed SST komega and transition SST turbulence models to numerically simulate the aerodynamic characteristics at the inlet wind speed of 7 m/s, 10 m/s and 20 m/s, respectively, and the numerical results were compared with the experimental ones. Ke et al. [27] modelled a horizontal-axis wind turbine blade with tubercles distributed on the leading edge, and conducted a parametric study on the aerodynamic characteristics of wind turbine based on computational fluid dynamics.
From the above studies, using CSA-KJ optimized CSA-KJ4412 airfoil combined with Wilson method to design blades has high engineering application value. Therefore, the airfoil aerodynamic characteristics are then calculated and analyzed, the CSAKJ4412-08 blade is designed, and the flow field distribution and the power generation are analyzed, which can provide a new feasible idea for the optimization design of offshore wind turbine blades to ensure the efficient operation of offshore wind farms.
2. CSA-KJ airfoil optimization and blade design theory
2.1. Objective function and CSA update formula
The Kutta-Joukowski (KJ) lift theorem is the most important theory of airfoil lift [28], and Cuckoo Search Algorithm (CSA) has not only high search efficiency [29], but also good convergence and global search ability [30]. Therefore, the CSA-KJ aerodynamic optimization method is achieved in this work by taking KJ airfoil as an objective function and treating CSA as an iterative updating tool.
It is assumed that the flow field around the airfoil is uniform, non-viscous and incompressible and that no turbulence occurs. In accordance with KJ theorem, the airfoil lift force can be calculated as [31]:
where and denote the flow velocity and density of the fluid at infinity respectively, and is the path integral of fluid velocity along a closed curve.
And then the objective function of CSA-KJ aerodynamic optimization method is obtained as:
where represents the radius of the two-dimensional flow tube where the airfoil is located, and are the unit lengths of axis and axis, respectively.
CSA is a natural heuristic algorithm, whose update equation is written as [32]:
where and denote the individuals before and after updating, respectively, is the selected individual, which consists of 0 and 1 elements, is the difference of any two individual matrices in the population.
2.2. CSA-KJ airfoil optimization process
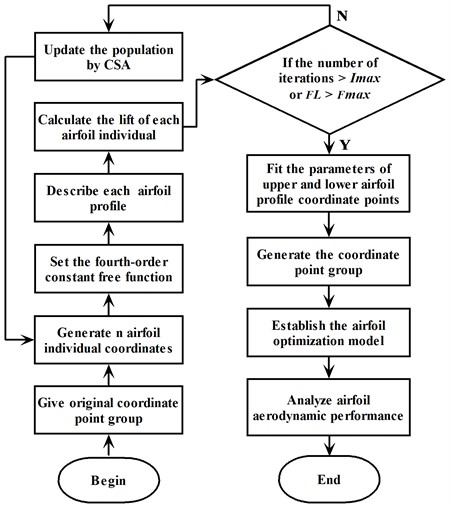
The coordinate points constituting the airfoil are taken as the individuals of the population in CSA algorithm, the updated Eq. (3) is used to iterate the individuals, and then the coordinate points of the airfoil profile can be obtained by CSA-KJ method. The specific steps of CSA-KJ airfoil optimization are as follows.
1) Select a certain airfoil as the object.
2) Fit the airfoil coordinate points by using a fourth-order constant-free polynomial function, and obtain the smooth profiles of airfoil suction surface and pressure surface.
3) Take Eq. (1) derived from KJ theorem as an objective function, and employ CSA to iteratively update the coordinate points of the airfoil with the maximum lift force as the target.
4) In the iteration process, when the calculated airfoil lift force exceeds the set maximum value or the number of iterations is greater than , the iteration ends and the processed airfoil is obtained.
In order to see the optimization process more clearly, the process of CSA-KJ airfoil optimization method is illustrated in Fig. 1.
Fig. 1Flow chart of CSA-KJ airfoil optimization method
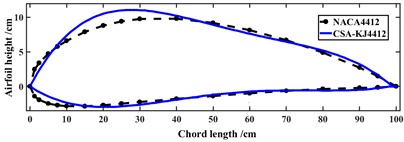
CSA-KJ method is employed to calculate iteratively and obtain the CSA-KJ4412 airfoil so as to verify the performance of airfoil optimization. The airfoil shapes before and after processing are shown in Fig. 2. It can be seen that the profile smoothness of CSA-KJ4412 airfoil is better.
Fig. 2Flow chart of CSA-KJ airfoil optimization method
2.3. Design theory of CSAKJ4412-08 blade
In order to design high lift blades, based on the CSA-KJ4412 airfoil, the Wilson blade design method was used to design the blades. Wilson is an improvement on Glauert’s design. The specific steps of Wilson blade design method are as follows: 1) Select the rated power of wind turbine; 2) Calculate the blade length of wind turbine; 3) Determine the blade tip speed ratio; 4) Optimize and design the airfoil; 5) Simulate flow field, and analyze the blade mode and load; 6) Describe the wind distribution; 7) Design the parameters.
According to the confirmed rated power of wind turbine, the diameter of wind wheel is as follows:
where denotes the rated power of wind turbine, represents the designed wind speed, is the utilization coefficient of wind energy, is the efficiency of wind turbine, refers to the fluid density of the flow direction of wind turbine. Here, air is taken as inflow fluid, with the density of 1.225 kg/m3.
In this study, the optimization objective is to maximize the wind energy utilization coefficient of the section airfoil with different wingspan lengths of wind turbine blades, and the objective function is written as:
where and represent axial and circumferential factors, respectively, denotes Blunt correction factor, is the tip speed ratio corresponding to the blade wingspan .
Moreover, the tip speed ratio at the respective key section conforms to the constraint as follows:
3. Modeling for CSA-KJ airfoil blade
3.1. CSAKJ4412-08 blade parameters
The annual average wind speed at the height of 10 m in eastern China is 7.34 m/s, and at 120 m, it is 11.89 m/s rounded to 12 m/s according to the wind shear equation [34]. To approximate the actual working conditions of the wind turbine blades more accurately, the wind speed 12 m/s is taken as the design one. The design parameters of wind turbine are shown in Table 1.
The CSA-KJ4412 airfoil stalls at the attack angle of nearly 12°, but its lift-drag ratio exceeds that of NACA4412 airfoil at the attack angle less than 12°. The maximum lift coefficient of the CSA-KJ4412 airfoil designed in this study reaches 1.65, larger than that of 1.03 in the existing literature [33], suggesting that the CSA-KJ4412 airfoil exhibits better aerodynamic characteristics. Accordingly, a novel type of wind turbine blade is developed by using CSA-KJ4412 airfoil.
Table 1CSAKJ4412-08 blade design parameters
Parameters | Value / Unit |
Rated power | 8 MW |
Design wind speed | 12 m/s |
Utilization coefficient of wind energy | 0.41 |
Airfoil lift coefficient | 1.65 |
Wind turbine efficiency | 0.8 |
Tip speed ratio | 7 |
Air density | 1.225 kg/m3 |
Diameter of wind turbine rotor | 171.29 m |
Blade length | 85.5 m |
According to Eq. (4) and Eq. (5), the section parameters of the blade wingspan ranging from 17.1 m to 85.5 m can be calculated, and the detailed parameters are listed in Table 2. The diameter of the cylinder at the blade root is the average chord length 3.5737 m of the airfoil at the respective blade node.
Table 2Blade section parameters
(m) | Torsional angle (°) | Chord length (m) | Inflow angle (°) | ||
17.10 | 0.335594 | 0.106971 | 17.205568 | 7.293658 | 0.405014 |
18.81 | 0.336219 | 0.089620 | 15.582522 | 6.944566 | 0.376686 |
20.52 | 0.336604 | 0.076085 | 14.151043 | 6.604376 | 0.351702 |
22.23 | 0.336892 | 0.065351 | 12.880448 | 6.280291 | 0.329526 |
23.94 | 0.337055 | 0.056702 | 11.749226 | 5.974651 | 0.309782 |
25.65 | 0.337162 | 0.049641 | 10.736538 | 5.688911 | 0.292108 |
27.36 | 0.337240 | 0.043809 | 9.825754 | 5.422979 | 0.276212 |
29.07 | 0.337307 | 0.038940 | 9.003051 | 5.176101 | 0.261853 |
30.78 | 0.335737 | 0.034749 | 8.291796 | 4.934832 | 0.249439 |
32.49 | 0.337564 | 0.031351 | 7.575122 | 4.735686 | 0.236931 |
34.20 | 0.337524 | 0.028354 | 6.956847 | 4.537823 | 0.226140 |
35.91 | 0.337619 | 0.025772 | 6.387695 | 4.354872 | 0.216206 |
37.62 | 0.337732 | 0.023529 | 5.864121 | 4.184760 | 0.207068 |
39.33 | 0.337865 | 0.021568 | 5.381014 | 4.026368 | 0.198636 |
41.04 | 0.338021 | 0.019845 | 4.933928 | 3.878659 | 0.190833 |
42.75 | 0.338202 | 0.018323 | 4.519045 | 3.740694 | 0.183592 |
44.46 | 0.338412 | 0.016973 | 4.133004 | 3.611619 | 0.176854 |
46.17 | 0.338655 | 0.015771 | 3.772879 | 3.490663 | 0.170569 |
47.88 | 0.339064 | 0.014698 | 3.434289 | 3.377789 | 0.164659 |
49.59 | 0.339443 | 0.013734 | 3.117902 | 3.271306 | 0.159137 |
51.30 | 0.339888 | 0.012866 | 2.820416 | 3.171110 | 0.153945 |
53.01 | 0.340407 | 0.012084 | 2.540031 | 3.076661 | 0.149052 |
54.72 | 0.341014 | 0.011377 | 2.275100 | 2.987501 | 0.144428 |
56.43 | 0.341727 | 0.010737 | 2.024097 | 2.903205 | 0.140047 |
58.14 | 0.342565 | 0.010157 | 1.785652 | 2.823369 | 0.135885 |
59.85 | 0.343554 | 0.009631 | 1.558459 | 2.747624 | 0.131920 |
61.56 | 0.344726 | 0.009154 | 1.341280 | 2.675613 | 0.128130 |
63.27 | 0.346121 | 0.008723 | 1.132907 | 2.606978 | 0.124493 |
64.98 | 0.347790 | 0.008334 | 0.932145 | 2.541361 | 0.120989 |
66.69 | 0.349800 | 0.007986 | 0.737737 | 2.478375 | 0.117596 |
68.40 | 0.352147 | 0.007675 | 0.549276 | 2.417262 | 0.114306 |
70.11 | 0.355131 | 0.007405 | 0.363373 | 2.358156 | 0.111062 |
71.82 | 0.358799 | 0.007175 | 0.179397 | 2.299971 | 0.107851 |
73.53 | 0.363351 | 0.006987 | –0.004668 | 2.241694 | 0.104638 |
75.24 | 0.369058 | 0.006847 | –0.191334 | 2.181744 | 0.101380 |
76.95 | 0.376305 | 0.006763 | –0.383922 | 2.117503 | 0.098019 |
78.66 | 0.385654 | 0.006752 | –0.587068 | 2.044144 | 0.094473 |
80.37 | 0.397975 | 0.006841 | –0.807707 | 1.951687 | 0.090623 |
82.08 | 0.414760 | 0.007090 | –1.057576 | 1.815523 | 0.086262 |
83.79 | 0.439209 | 0.007649 | –1.361899 | 1.553664 | 0.080950 |
85.50 | 0.175427 | 0.003567 | –1.694600 | 0.100000 | 0.076843 |
3.2. Blade and flow field modeling
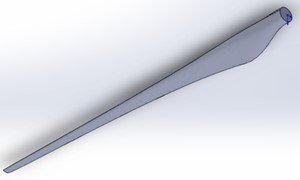
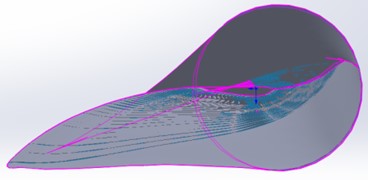
According to the Wilson blade design method, the wind turbine blade wingspan adopts the CSA-KJ4412 airfoil within the length of 17.10 m to 83.7 m and the cylinder within 0 m to 17.10 m. The 3D solid model of CSAKJ4412-08 blade is illustrated in Fig. 3.
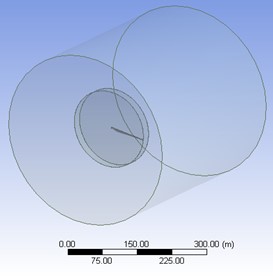
In order to carry out flow field analysis on CSAKJ4412-08 wind turbine blade and verify its power generation, a blade 3D model, an external flow field and a cylindrical internal one rotating around the blade are established in the ANSYS Geometry module in this work. The radius of the bottom surface of external flow field cylinder is 200 m, nearly twice the length of the wind turbine blade, and the cylinder length is 400 m. The corresponding radius in internal flow field is 90 m, with the cylinder length of 20 m. Considering the wake effect of the upstream wind turbine on the downstream one, the wake area length is set as 300 m. Set the bottom of the cylinder as the velocity inlet, the boundary around the cylinder as the wall, and the boundary condition at the top of the cylinder as free flow. Select the air as the fluid, and set its temperature to 298.15 K, its viscosity as 1.79×10⁻⁵ kg/(m·s), and its density as 1.225 kg/m3. The iterative residual threshold is given as 1×10⁻³, and the maximum number of iterations is 1×10³. In grid independence verification and subsequent simulation, determine SA as the turbulence model. The flow field model is displayed in Fig. 4.
Fig. 3Blade 3D model
a) Positive isometric side view
b) Vertical view
Fig. 43D model of flow field
3.3. Grid division and independent verification
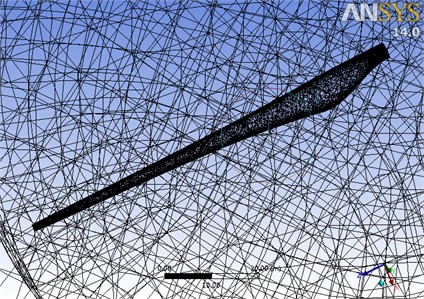
Grid division takes on a critical significance to finite element analysis, and the quality and the quantity of grid after discretizing the 3D model directly affect solution time and result accuracy. In this study, the flow field grids are generated in the Mesh module of ANSYS Workbench and divided by Sizing in Mesh Control, face Sizing method is employed to generate grids, and the flow field after division is illustrated in Fig. 5. The blade grids are generated in the Model module of ACP through mixing hexahedron and tetrahedron, as shown in Fig. 6.
Fig. 5Mesh generation of flow field
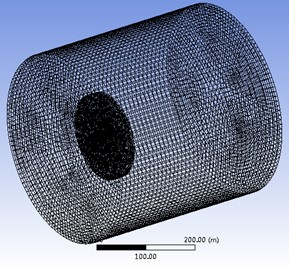
Fig. 6Grid division of blade
The mesh density directly affects the calculation accuracy. Generally, the more grids there are, the more accurate the calculation results will be. However, the too dense grid will cause the computer to spend too much time and require more storage space, which requires a balance between accuracy and computing resources. In this study, grid independence verification is carried out under design working condition, and the results are listed in Table 3. It can be seen that the lift difference between Grid 3 and Grid 4 is less than 1 % at a similar growth rate. Since the number of grids in Grid 4 is relatively large, Grid 3 is chosen to calculate the flow field of blade in order to save computing resources.
Table 3Grid independence verification
Number of grids | Growth rate (%) | Lift | Absolute relative error (%) | |
Grid 1 | 1614134 | – | 330118 | – |
Grid 2 | 2263151 | 40.21 | 418169 | 26.67 |
Grid 3 | 3329083 | 47.10 | 424562 | 1.53 |
Grid 4 | 4793880 | 44.00 | 422067 | 0.59 |
4. Aerodynamic characteristics of CSA-KJ4412 airfoil
4.1. Variation of Lift-to-drag ratio coefficient with angle of attack
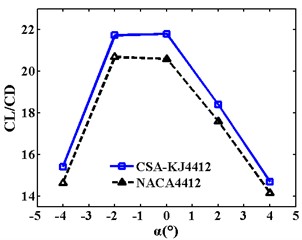
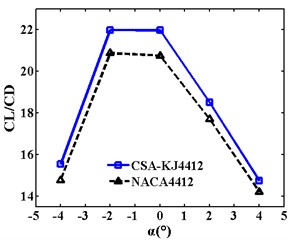
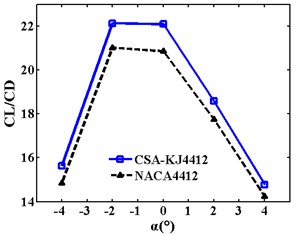
To more easily observe the change in the airfoil lift-drag ratio with a more intuitive angle of attack, the comparison curves under different incoming wind speeds are displayed in Fig. 7(a)-(c). It is clear that the CL/CD of CSA-KJ4412 at different attack angles are higher than that of NACA4412 when the incoming wind speed is constant. In the range of the attack angle of –4° to 4° the CL/CD of the two airfoils initially increases before decreasing with ascending angles of attack. It then reaches a maximum when the attack angle is –2° or 0°, and the lift-drag ratio of CSA-KJ4412 at different, and the lift-drag ratio of CSA-KJ4412 at different attack angles are higher than that of NACA4412.
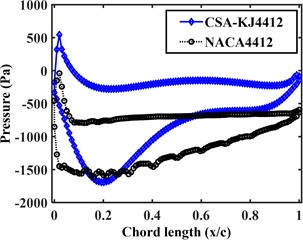
4.2. Airfoil pressure curve under constant wind speed
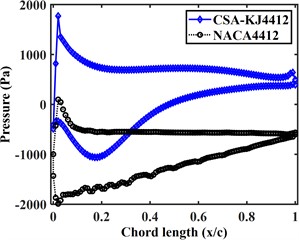
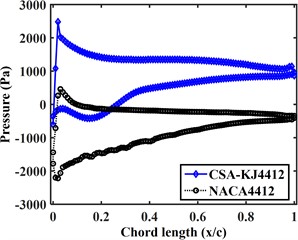
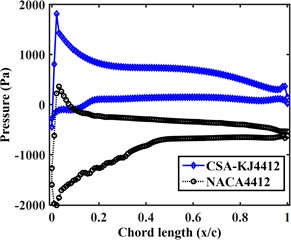
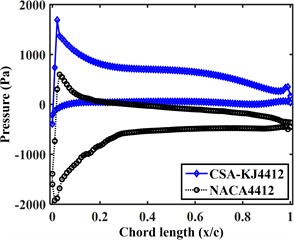
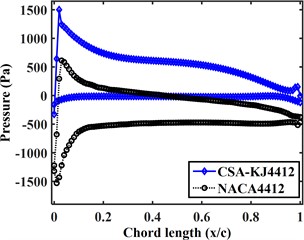
In order to compare and analyze the aerodynamic characteristics of the two airfoils when the Lift-to-drag ratio is close to the stability, the pressure curves of the suction surface and pressure surface of the two airfoils at the relative incoming wind speed of 40 m/s are plotted in Fig. 8(a-f). From the figure, it can be seen that:
1) At different attack angles, the pressure on the pressure surface of the CSA-KJ4412 airfoil increases rapidly with the increase of chord length and then decreases rapidly, and with a slight increase at the trailing edge of the airfoil. The pressure on the pressure surface of the NACA4412 airfoil and the CSA-KJ4412 airfoil have the same trend, but the pressure on the pressure surface of the tail of the NACA4412 airfoil does not increase.
Fig. 7Mesh generation of flow field
a)20 m/s
b)22 m/s
c)24m/s
2) The pressure on the suction surface of the CSA-KJ4412 airfoil varies greatly with the increase of attack angle. When the attack angle is greater than 5° but less than 20°, the pressure on the suction surface of the CSA-KJ4412 airfoil increases slightly from –500 Pa and then decreases. Subsequently, the pressure gradually increases with the increase of chord length. At 25° and 30° attack angles, the pressure on the suction surface of the airfoil reache its minimum at the leading edge, and then remain around 0 Pa as the chord length increases.
3) The pressure on the pressure surface of the NACA4412 airfoil varies relatively uniformly with chord length. Within the range of 0.1 to 0.8 chord length, the pressure on the pressure surface of the NACA4412 airfoil does not change significantly with chord length. When the attack angle is less than 20°, the pressure on the suction surface of the NACA4412 airfoil increases linearly with chord length. When the attack angle is greater than 15°, the pressure on the suction surface of the airfoil first increases to a certain value and then remains stable.
4) Except for a 5° attack angle, the maximum and minimum pressure of the NACA4412 airfoil appear at the suction surface 0.
5) When the attack angle is less than 20°, the pressure on the suction surface of the NACA4412 airfoil fluctuates slightly, which is due to the unsmooth airfoil profile at the chord length where the pressure fluctuates slightly during two-dimensional modeling.
5. Flow field analysis of CSA-KJ airfoil blade
According to its tip speed ratio of CSAKJ4412-08 wind turbine blade, the calculated tip speed is 84 m/s. The inlet fluid speed of external flow field is 12 m/s, the flow field circumference of the internal rotating field is 536.94 m, and the rotational speed is 0.1564 r/s.
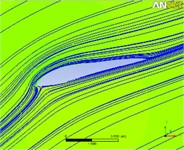
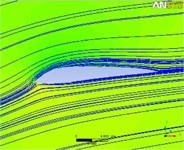
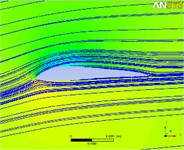
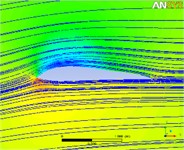
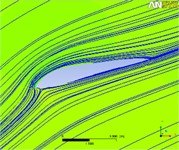
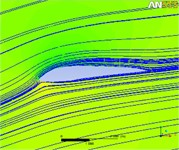
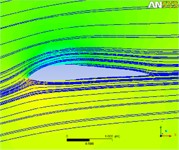
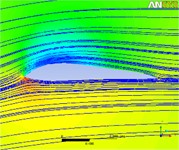
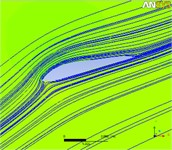
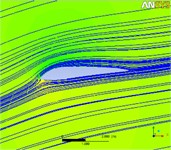
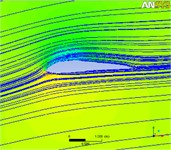
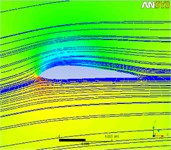
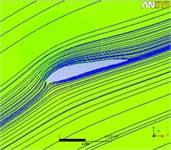
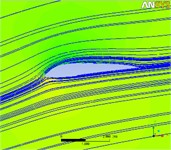
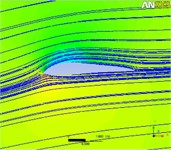
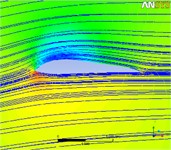
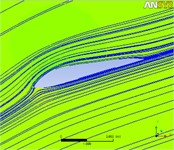
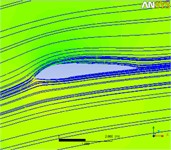
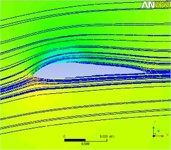
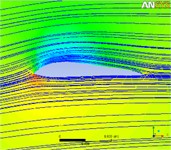
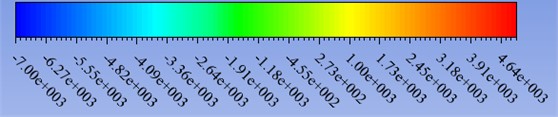
Under the rated working condition, the flow field distributions of CSAKJ4412-08 profile airfoil at different lengths at the inflow attack angle from 30° to –30° are shown in Fig. 9(a1)-(e4), where (a) to (e) represent the attack angle at 30°, 15°, 0°, –15°, –30° respectively and (1) to (4) at each attack angle show the flow field sections with the blade wingspan length of 20 m, 40 m, 60 m and 80 m respectively. What needs to be explained about Fig. 9 is that the blue line refers to the streamline of flow field, and that the gray area represents the blade profile airfoil at a certain wingspan. To observe the pressure distribution at each blade section more intuitively, the corresponding colors of different CSAKJ4412-08 blade section pressures are shown in Fig. 10.
Fig. 8Surface pressure curves of CSA-KJ4412 airfoil and NACA4412 airfoil
a) 5°
b) 10°
c) 15°
d) 20°
e) 25°
f) 30°
In terms of streamline, it can be found that:
1) The pressure surface exhibits a relatively high streamline density, and with the blade radius increasing, the streamline density of pressure surface decreases continuously and it is smaller than that of suction surface, suggesting that pressure surface of the airfoil is subjected to a greater pressure compared with suction surface.
2) At each attack angle, the streamline around airfoil flow field is interrupted at the blade radius of 60m, implying that the cross-flow phenomenon of the fluid exists in the section flow field.
3) In the flow field around the airfoil at each attack angle, there is no vortex or backflow phenomenon in the streamline, so that the blade does not stall, meaning that attack angle slightly affects the blade operation at the rated inflow wind speed.
Fig. 9Flow field distributions around section airfoil at each blade length at 30° to –30° inflow direction
a1) 20 m
a2) 40 m
a3) 60 m
a4) 80 m
b1) 20 m
b2) 40 m
b3) 60 m
b4) 80 m
c1) 20 m
c2) 40 m
c3) 60 m
c4) 80 m
d1) 20 m
d2) 40 m
d3) 60 m
d4) 80 m
e1) 20 m
e2) 40 m
e3) 60 m
e4) 80 m
In terms of pressure distribution, it can be concluded that:
1) In all cases, the pressure at the front edge of the airfoil pressure surface gradually increases along the wingspan direction, and the maximum pressure of flow field around the entire airfoil appears at the front edge.
2) The upper and lower pressure difference of airfoil with blade section close to the blade root is small, and the pressure distribution is relatively uniform.
3) The flow field pressure on the airfoil suction surface decreases gradually with the increase of the wingspan, and it is mainly concentrated between the front edge and the maximum thickness of the airfoil.
4) With the increasing wingspan, the pressure on the suction surface gradually expands.
5) The pressure on the pressure surface gradually increases with the increase of the wingspan, and progressively distributes to all parts of the pressure surface.
Fig. 10Color comparison of flow field pressure distribution around CSAKJ4412-08 section airfoil
6. Power analysis of CSA-KJ airfoil blade
The optimized blade significantly affects the power generation of the wind tur-bine. To verify the designed wind turbine power, the following equation is expressed as [35]:
where denotes blade torque, and represents the number of the wind turbine blades.
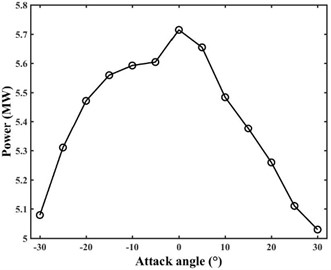
In order to observe the power generation of wind turbines in different inflow directions, under the condition of 12 m/s inflow wind speed, the curve of CSAKJ4412-08 blade power changing with the attack angle is plotted in Fig. 11. Here, the attack angle is defined as the one between inflow wind speed and horizontal plane. Only the situation when the inflow wind speed flows along the horizontal axis of wind turbine is considered. It can be clearly seen from Fig. 11 that the power of the designed 8 MW wind turbine increases first and then decreases with the increase of attack angle, and that the power generated by wind turbine rises rapidly when the attack angle is be-tween –30° and –20°. The wind turbine power increases slowly with the attack angle, which ranges from –20° to 5°. Then, the maximum power of wind turbine is 5.71 MW when the attack angle is 0°. Subsequently, when the attack angle exceeds 0°, the power nearly declines at the same rate till the minimum one reaches 5.03 MW at 30° attack angle. Within the range of –15° to 5° attack angle, the power is all more than 5.5 MW, and the maximum one is 71.38 % of the rated power 8 MW, showing that the maximum power generated by the designed wind turbine is close to the rated value.
Fig. 11Power change of CSAKJ4412-08 wind turbine with attack angle
7. Conclusions
Based on the optimized CSA-KJ4412 airfoil, its aerodynamic characteristics were analyzed, the Wilson method was used to design the 8MW CSAKJ4412-08 high-power wind turbine blade, and the flow field characteristic and the power change of the blade at different attack angles were calculated and analyzed under the rated working condition. The main conclusions are as follows:
1) At different attack angles, the Lift-to-drag ratio of CSA-KJ4412 airfoil is significantly higher than that of NACA4412 airfoil at each relative incoming wind speed, and the difference between the Lift-to-drag ratio of the two airfoils increases with the increase of the relative incoming wind speed.
2) At different attack angles, the pressure on the pressure surface of the CSA-KJ4412 airfoil rapidly increases and then decreases with the increase of chord length, the suction surface pressure of CSA-KJ4412 airfoil varies significantly with increasing attack angle.
3) For the CSAKJ4412-08 wind turbine blade at different attack angles, the fluid around the blade tightly adheres to the blade surface for adhesive flow, and the streamline cannot form vortex or backflow phenomenon, so no stall phenomenon appears.
4) Regardless of attack angle, the pressure on the airfoil pressure surface of CSAKJ4412-08 blade increases with the wingspan, while the one on the suction surface is opposite, which makes the pressure difference between the upper and lower surfaces ascend, thereby improving the blade lift.
5) Within the attack angle of –30° to 30°, the maximum power and the mini-mum one of the established CSAKJ4412-08 blade are 5.71 MW and 5.03 MW respectively, accounting for 71.38 % and 62.75 % of the rated value, respectively generated at the attack angle of 0° and 30°.
6) The power rises rapidly at the attack angle from –30° to –20°, and maintains stably over 5.5 MW at the attack angle from –20° to 10°, and starts to decline rapidly from 5.5 MW at the attack angle over 10°.
References
-
Y. E. Wang, W. P. Ge, D. S. Miao, and D. Wu, “Study on the influence of tip winglets on the aerodynamic characteristics of wind turbine blades,” Renewable Energy, Vol. 40, No. 5, pp. 639–644, 2022, https://doi.org/10.13941/j.cnki.21-1469/tk.2022.05.014
-
L.-A. Zhang, L.-M. Tao, X.-T. Wei, and X.-M. Huang, “Multi-axis fatigue loading system of wind turbine blade and vibration coupling characteristics,” Journal of Vibroengineering, Vol. 19, No. 1, pp. 1–13, Feb. 2017, https://doi.org/10.21595/jve.2016.16879
-
Y. J. Qin, “Analysis of new energy wind power generation technology and its development trend,” Science and Technology Innovation and Application, Vol. 12, No. 19, pp. 162–165, 2022, https://doi.org/10.19981/j.cn23-1581/g3.2022.19.038
-
R. J. Sun, J. Liang, K. W. Wang, and Y. Q. Wang, “Overview of offshore wind power collection system,” Electric Power Construction, Vol. 46, No. 2, pp. 105–15, 2021, https://doi.org/10.12204/j.issn.1000-7229.2021.06.011
-
X. Zhang, M. J. Zhang, G. G. Wang, W. Li, and J. T. Ruan, “Optimization design of blunt trailing edge airfoil with rough blade surface,” (in Chinese), China Mechanical Engineering, Vol. 30, No. 6, pp. 728–734, 2019.
-
D. Wang, C. He, H. Wang, F. Liu, H. Tian, and L. Ma, “Design and experimental optimization of airfoil-triangle sieve for hammer mill,” Inmateh-Agricultural Engineering, Vol. 61, No. 2, pp. 315–322, Aug. 2020, https://doi.org/10.35633/inmateh-61-34
-
Q. Wang, B. Liu, C. Hu, F. Wang, and S. Yang, “Aerodynamic shape optimization of H-VAWT blade airfoils considering a wide range of angles of attack,” International Journal of Low-Carbon Technologies, Vol. 17, pp. 147–159, Feb. 2022, https://doi.org/10.1093/ijlct/ctab092
-
H. C. A. Ümütlü and Z. Kiral, “Airfoil shape optimization using bezier curve and genetic algorithm,” Aviation, Vol. 26, No. 1, pp. 32–40, Mar. 2022, https://doi.org/10.3846/aviation.2022.16471
-
J. Li et al., “Low-Reynolds-number airfoil design optimization using deep-learning-based tailored airfoil modes,” Aerospace Science and Technology, Vol. 121, p. 107309, Feb. 2022, https://doi.org/10.1016/j.ast.2021.107309
-
X. Z. Tang, K. R. Yuan, N. W. Gu, P. C. Li, and R. T. Peng, “An interval quantification-based optimization approach for wind turbine airfoil under uncertainties,” Energy, Vol. 244, p. 12262, 2022, https://doi.org/10.1016/j.energy.20211.2623
-
M. A. Bouhlel, S. He, and J. R. R. A. Martins, “Scalable gradient-enhanced artificial neural networks for airfoil shape design in the subsonic and transonic regimes,” Structural and Multidisciplinary Optimization, Vol. 61, No. 4, pp. 1363–1376, Apr. 2020, https://doi.org/10.1007/s00158-020-02488-5
-
Y. Khalil, L. Tenghiri, F. Abdi, and A. Bentamy, “Improvement of aerodynamic performance of a small wind turbine,” Wind Engineering, Vol. 44, No. 1, pp. 21–32, Feb. 2020, https://doi.org/10.1177/0309524x19849847
-
T. Zhou, H. Cao, M. Zhang, and C. Liao, “Performance simulation of wind turbine with optimal designed trailing-edge serrations,” Energy, Vol. 243, No. 2, p. 122998, Mar. 2022, https://doi.org/10.1016/j.energy.2021.122998
-
C. V. Rodriguez and C. Celis, “Design optimization methodology of small horizontal axis wind turbine blades using a hybrid CFD/BEM/GA approach,” Journal of the Brazilian Society of Mechanical Sciences and Engineering, Vol. 44, No. 6, pp. 28–25, Jun. 2022, https://doi.org/10.1007/s40430-022-03561-4
-
Y. Xu, P. Liu, I. Penesis, G. He, A. Heidarian, and H. Ghassemi, “Energy generation efficiency and strength coupled design and optimization of wind turbine rotor blades,” Journal of Energy Engineering, Vol. 145, No. 2, p. 04019, Apr. 2019, https://doi.org/10.1061/(asce)ey.1943-7897.0000599
-
J. Chen and M.-H. Kim, “Review of recent offshore wind turbine research and optimization methodologies in their design,” Journal of Marine Science and Engineering, Vol. 10, No. 1, p. 28, Dec. 2021, https://doi.org/10.3390/jmse10010028
-
M. Azizi and A. Jahangirian, “Multi‐site aerodynamic optimization of wind turbine blades for maximum annual energy production in East Iran,” Energy Science and Engineering, Vol. 8, No. 6, pp. 2169–2186, Jun. 2020, https://doi.org/10.1002/ese3.656
-
W.-H. Wu and W.-B. Young, “Structural analysis and design of the composite wind turbine blade,” Applied Composite Materials, Vol. 19, No. 3-4, pp. 247–257, Jun. 2012, https://doi.org/10.1007/s10443-011-9193-z
-
N. Buckney, S. Green, A. Pirrera, and P. M. Weaver, “On the structural topology of wind turbine blades,” Wind Energy, Vol. 16, No. 4, pp. 545–560, May 2013, https://doi.org/10.1002/we.1504
-
K. X. Guo, D. Y. Li, and J. D. Huang., “A study of aerodynamic characteristics of back-swept wind turbine blades under extreme operating gusts,” Journal of Guangdong University of Technology, Vol. 37, No. 5, pp. 100–104, 2020, https://doi.org/10.12052/gdutxb.190159
-
C. Zhang, L. Ji, L. Zhou, and Z. Zhang, “Effects of different blended blade tip and winglets on aerodynamic and aeroacoustic performances of diagonal fans,” Aerospace Science and Technology, Vol. 106, p. 106200, Nov. 2020, https://doi.org/10.1016/j.ast.2020.106200
-
Q. Wang, P. Huang, D. Gan, and J. Wang, “Integrated design of aerodynamic performance and structural characteristics for medium thickness wind turbine airfoil,” Applied Sciences, Vol. 9, No. 23, p. 5243, Dec. 2019, https://doi.org/10.3390/app9235243
-
F. Afshari, A. Khanlari, A. Sozen, A. D. Tuncer, I. Ates, and B. Sahin., “CFD analysis and experimental investigation to determine the flow characteristics around NACA 4412 airfoil blades at different wind speeds and blade angles,” Proceedings of the Institution of Mechanical Engineers Part E-Journal of Process Mechanical Engineering, Vol. 8, No. 21, p. 5223, 2022.
-
Q. Mo, J. Yin, L. Chen, W. Liu, L. Jiang, and Z. Liao, “Numerical simulation of aerodynamic performance of off-grid small vertical axis wind turbine,” E3S Web of Conferences, Vol. 53, p. 02004, 2018, https://doi.org/10.1051/e3sconf/20185302004
-
A. Nejat, F. Kowsary, A. Hasanzadeh-Barforoushi, and S. Ebrahimi, “Unsteady pulsating characteristics of the fluid flow through a sudden expansion microvalve,” Microfluidics and Nanofluidics, Vol. 17, No. 4, pp. 623–637, Oct. 2014, https://doi.org/10.1007/s10404-014-1343-9
-
B. Ji, K. Zhong, Q. Xiong, P. Qiu, X. Zhang, and L. Wang, “CFD simulations of aerodynamic characteristics for the three-blade NREL Phase VI wind turbine model,” Energy, Vol. 249, p. 123670, Jun. 2022, https://doi.org/10.1016/j.energy.2022.123670
-
W. Ke, I. Hashem, W. Zhang, and B. Zhu, “Influence of leading-edge tubercles on the aerodynamic performance of a horizontal-axis wind turbine: A numerical study,” Energy, Vol. 239, p. 122186, Jan. 2022, https://doi.org/10.1016/j.energy.2021.122186
-
C. Bai and Z. Wu, “Generalized Kutta-Joukowski theorem for multi-vortex and multi-airfoil flow (a lumped vortex model),” (in Chinese), Chinese Journal of Aeronautics, Vol. 27, No. 1, pp. 34–39, Feb. 2014, https://doi.org/10.1016/j.cja.2013.07.022
-
C. Cheng et al., “Ensemble learning approach based on stacking for unmanned surface vehicle’s dynamics,” Ocean Engineering, Vol. 207, p. 107388, Jul. 2020, https://doi.org/10.1016/j.oceaneng.2020.107388
-
H. Tran-Ngoc, S. Khatir, H. Ho-Khac, G. de Roeck, T. Bui-Tien, and M. Abdel Wahab, “Efficient Artificial neural networks based on a hybrid metaheuristic optimization algorithm for damage detection in laminated composite structures,” Composite Structures, Vol. 262, p. 113339, Apr. 2021, https://doi.org/10.1016/j.compstruct.2020.113339
-
J. Li, Y. Xu, and Z. Wu, “Kutta-Joukowski force expression for viscous flow,” Science China Physics, Mechanics and Astronomy, Vol. 58, No. 2, pp. 1–5, Feb. 2015, https://doi.org/10.1007/s11433-014-5574-2
-
X.-S. Yang, “Cuckoo Search and Firefly Algorithm: Overview and Analysis,” in Computational Intelligence, Vol. 516, Cham: Springer International Publishing, 2014, https://doi.org/10.1007/978-3-319-02141-6_1
-
D. T. Cai, J. S. Xie, and G. L. Zhang, “Research on airfoil optimization design based on multi module collaborative simulation,” Mechanical Research Applied, Vol. 26, No. 4, pp. 49–51, 2013, https://doi.org/10.1016/j.oceaneng.2013.107488
-
J. Zhao, Y. P. Wang, Q. W. Huang, L. P. Lu, and L. Zhu, “Research on blade load of multi wind turbine wind power generation system based on wind shear,” Journal of Solar Energy Engineering-Transactions of The Asme, Vol. 35, No. 7, pp. 1176–1182, 2014.
-
D. M. Hu, Z. X. Wu, K. H. Zhang, and Z. W. Zhang, “Numerical analysis of the influence of different winglets on the aerodynamic performance of wind turbines,” Journal of Operation and Automation in Power Engineering, Vol. 39, No. 6, pp. 486–491, 2019, https://doi.org/10.1016/j.oceaneng.2013.107488
About this article

This work was sponsored by the Program of Foundation of Science and Technology Commission of Shanghai Municipality (22dz1206005, 22dz1204202), National Natural Science Foundation of China (12172228, 11572187), Natural Science Foundation of Shanghai (22ZR1444400), and Shanghai Professional Technical Service Platform for Intelligent Operation and Maintenance of Renewable Energy (22DZ2291800).
The datasets generated during and/or analyzed during the current study are available from the corresponding author on reasonable request.
Yiqing Xu: funding acquisition, methodology, resources, writing-review and editing. Jianping Zhang: conceptualization, funding acquisition, methodology, visualization. Ming Liu: software, visualization, writing-review and editing. Pengju Zhang: methodology, resources, validation. Liquan Wang: software, validation.
The authors declare that they have no conflict of interest.
