Abstract
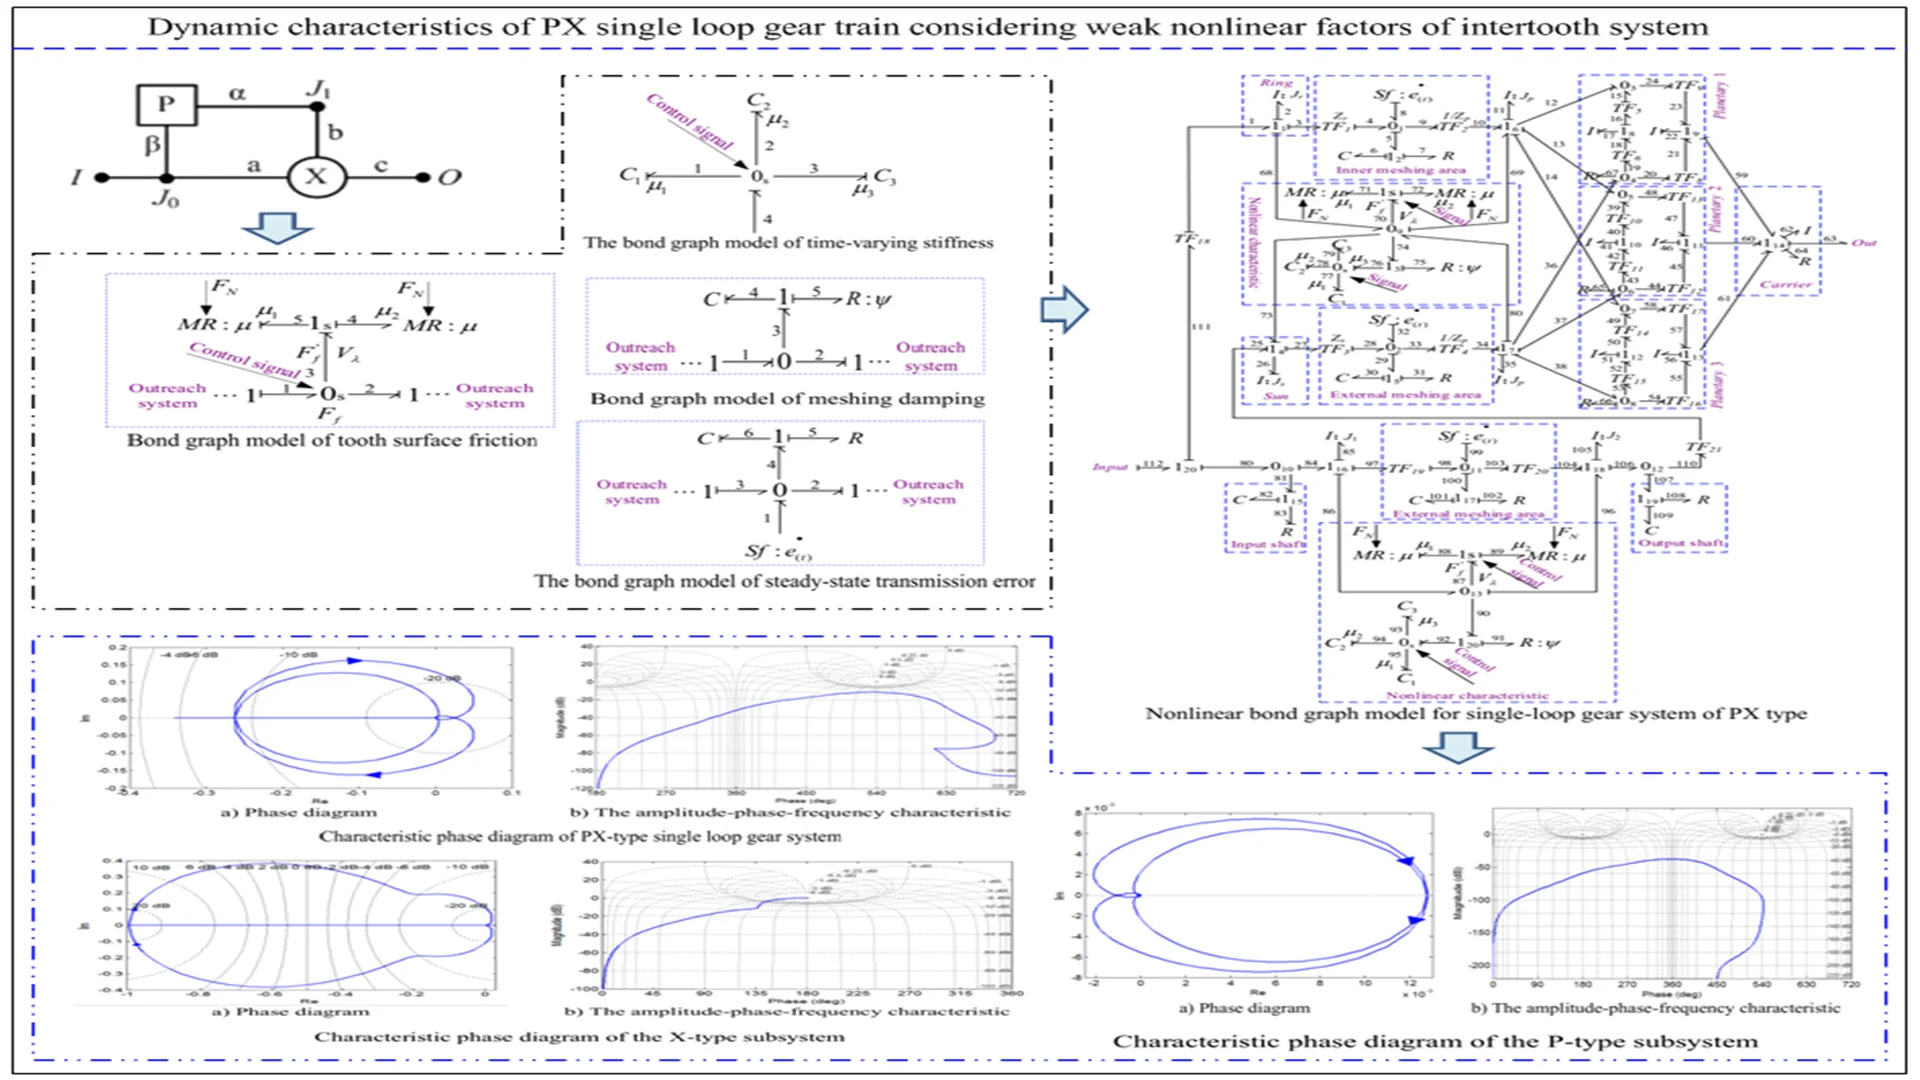
Due to the non-linear factors of the single loop gear system and the inter-tooth system, is sometimes difficult to establish an accurate nonlinear dynamic model, which leads to the large deviation between the dynamic characteristics and the actual situation. According to the structural characteristics and dynamic mechanism of nonlinear factors, the bond graph power junction with switching characteristics is adopted. This method is used to establish the model of the single loop gear system and the inter-tooth system respectively. On this basis, the amplitude-phase-frequency characteristics of PX single loop gear systems are obtained by numerical simulation analysis. Eventually, the dynamic stability of single loop gear system is judged based on this characteristic index. The study shows that the dynamic stability of PX type single loop gear system is unsteady in the nonlinear state. In addition, it is concluded that when the whole single loop gear system is unstable, its system module also has the same unstability.
1. Introduction
Under the rapid development of science and technology, the requirements of mechanical equipment for the transmission system are getting higher and higher, such as multi-power source input and output, the transmission system with power diversion, confluence and other functions [1-3]. A certain gear system can make the structure of the transmission system more complex, such as a single-loop gear system, a double-loop gear system, or a multi-loop gear system. With the increase of loops number, the motion and dynamic characteristics have become extremely complex, which makes it difficult to control the dynamic characteristics of the loop gear system [4, 5]. In addition to the intricate structure of the transmission system, the diversity of transmission forms, such as mechanical, electromagnetic and fluid transmission modes, which leads to the modeling of the dynamic characteristics is particularly complicated. However, the traditional modeling method is extremely difficult to establish mechanical models of various transmission modes, and it cannot guarantee the presentation of real dynamic characteristics among various systems [6-8].
In the transmission system, the gear transmission is the most basic component unit. The nonlinear factors of the inter-tooth system have significant influence on the dynamic characteristics, such as time-varying mesh stiffness, tooth surface sliding friction, meshing damping and steady-state transmission error [9-12]. Considering the influence of the above nonlinear factors, the dynamic characteristics of the system are more similar to the actual transmission one. However, the dynamic modeling and solution of the transmission system has also brought many difficulties owing to the introduction of nonlinear factors. Usually, the spring-mass-damping element method and the lumped-parameter method are used to establish the mathematical model of the inter-tooth system [13, 14]. Because these methods adopt equivalent modeling, the overall influence of nonlinear factors in the system is ignored, so that the calculation results have a certain narrow sense. In these aspects, a lot of achievements have been accumulated. For example, the influence of flexible support added to a large fan tower on the dynamic characteristics of the wind motor gear transmission system. The nonlinear dynamic model including tower stiffness, time-varying meshing stiffness, meshing damping, backlash and other factors has been established using the vibration mechanics. Finally, the vibration characteristics of this system have been achieved through calculation and analysis [15, 16]. Some scholars have used the lumped-parameter method to establish a nonlinear dynamic model of wind motor gear transmission system including time-varying meshing stiffness, composite meshing error and backlash, and obtained the response of nonlinear factors to the system through calculation and analysis. Scholars have considered the nonlinear factors such as tooth-side clearance, time-varying engagement stiffness and comprehensive error of inclined gear, and established a coupled nonlinear dynamic model with three degrees of freedom. Based on the "piece-wise linear" backlash function, the nonlinear dynamic response results under different backlash functions are calculated by numerical method [17, 18]. There are plenty of research results in this field, but these research methods all solve the macroscopic dynamic characteristics of the transmission system, and the authenticity of the inter-tooth system, the dynamic characteristics coupling between multiple energy domains is not deeply involved.
In view of the problems existing in the dynamic research of the complex multi-energy transmission system, the bond graph method can solve them well [19, 20]. The bond graph theory is utilized to study the dynamic performance of systems in various engineering fields. Compared with other mechanical analysis methods, it has several unique features. Bond graph can be a natural development of block diagram. It can not only represent the signal flow direction of components in the system, but also indicate the power flow direction and the causal relationship of control signals. In addition, in the bond graph method, the causative relationship is determined by certain rules. The appearance and shape of the bonding diagram are basically the same for the same engineering system, so that it can display the composition characteristics of the transmission system very intuitively.
2. Structural model of the single loop gear system
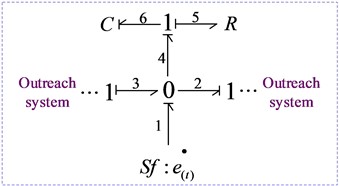
As shown in Table 1, there is one typical structure of single-loop gear transmission system: PX type, which is composed of a group of single-degree-of-freedom fixed shaft gear train and two-degree-of-freedom turnover differential gear train . , refer to mechanical connection points; and are input and output terminals; Other characters represent the drive shaft.
Table 1Structural graph of single loop gear transmission system
Name | Structural drawing | Feature |
PX | 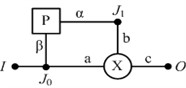 | Input shunt type |
3. Modeling principle of the inter-tooth nonlinear system
3.1. Time-varying mesh stiffness
3.1.1. Single-tooth meshing stiffness
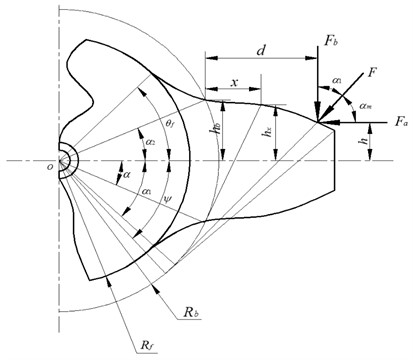
There are four kinds of energy stored in the gear teeth during meshing transmission: Hertz contact energy, radial compression deformation energy, bending potential energy and shear deformation energy. According to the calculation principle of energy method, combined with the force of the gear tooth shown in Figure 1, the calculation relationship of Hertz contact stiffness , radial compression stiffness , bending stiffness and shear stiffness of the gear tooth can be obtained respectively (the number of teeth is less than 41), as shown in Eq. (1). When the number of the gear teeth is greater than 41, remove the non-integral term and change the upper limit from to :
where, is the Poisson ratio; is the elastic modulus; is the tooth width; is the pressure angle; ; ; .
Using the energy method, the Hertz contact stiffness, radial compression stiffness, bending stiffness, shear stiffness and the flexible deformation of the gear tooth are considered. The calculation relationship of the flexible deformation is shown in Eq. (2):
where, is tooth width, is engagement angle, , , , are all represent polynomial coefficient, and satisfy the function relationship of Eq. (3):
where, , the flexible stiffness can be obtained from Eq. (4):
When the driving and driven gears mesh in the single meshing area, according to the stiffness series principle of mechanical system, the comprehensive time-varying meshing stiffness can be calculated, as shown in Eq. (5):
When is 1, it means driving wheel. 2 represents the driven wheel.
Fig. 1Force graph of single tooth engagement
3.1.2. Double-tooth meshing stiffness
Similarly, when the corresponding gear teeth of the driving and driven gears mesh in the double meshing area, they can be calculated according to the parallel stiffness principle. The calculation relationship of the comprehensive time-varying meshing stiffness of the gear teeth mesh is shown in Eq. (6):
where, when is 1, it means the first pair of meshing teeth. When is 2, it indicates the second pair of meshing teeth.
3.1.3. Time-varying meshing stiffness of single and double teeth
According to Eqs. (5) and (6), the comprehensive time-varying meshing stiffness of the gear transmission system is obtained, as shown in Eq. (7):
where, the period of gear teeth from the beginning to completely out of meshing is denoted . is the sequence number of gear teeth. The time when the teeth of the second pair of driving and driven gears enter into mesh is , . The time when the teeth of the third pair of driving and driven gears enter the meshing stage is , . is the gear coincidence, and its value is within the range of (1, 2).
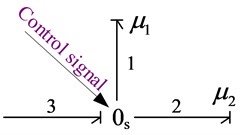
3.1.4. Bond graph model of time-varying meshing stiffness
Due to the nonlinear characteristics of gear tooth meshing stiffness, some signal channels that control nonlinear parameters to participate in system operation can be added to the static bond graph model, namely the switch type bonding graph element. The switch element is the characteristic mode that this system can open or close the information path on a key channel by control signals under specific conditions, so that the system has diverse states at different stages. Switch components, such as clutches in mechanical systems, electrical control switches and various control valves in hydraulic control systems, play a vital role in the precise control of system status. When the working state of these components changes in various systems, the working characteristics of this system will change from one state to another.
3.1.4.1. Modeling principle of switched power junctions (SPJ)
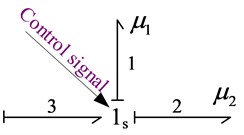
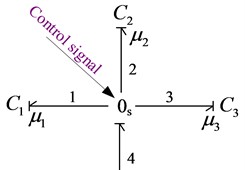
The method of switched power junctions (SPJ) is to add two mutually exclusive potential and flow ports on the basis of elementary 0s-junction and 1s-junction, as shown in Fig. 2. and represent two mutually exclusive Boolean parameters on key 1 and key 2, which control the working status of corresponding switches, such as on or off, as shown in Table 2. The signal flow in which the control parameters and are in the state type is also called the control key.
The control key is the key represented by the double arrow in the bond graph, which is also a power key. However, there is an essential difference between the control key and the other keys in the bond graph. The difference is that the control key controls the power variable of the corresponding key in the bond graph, while the control key itself has the function of the power variable, but the effect is small, so small that it can be ignored. In practical application, such as an ideal ammeter (voltmeter) only indicates the current value (voltage value) in the circuit, without causing the voltage value (current value) in the circuit to drop. In mechanical systems, for example, an ideal tachometer indicates only the value of the angular velocity on the rotating shaft, without consuming the power input from the spindle to the system, etc. These indicate that there is indeed a single signal connection in a local or subsystem of a system, and that the signal does not generate another power variable due to the power flow in the system (that is, the power response phenomenon). Therefore, the control key is indeed a power key in the various ports of the bond graph. However, the power consumption generated by the control key can be neglected when analyzing the system characteristics in general.
Table 2Boolean variable control mode
Component name | The way | Status type | |
Put through / On | Break / Off | ||
Switch 1 | 1 | 0 | |
Switch 2 | |||
It can be seen from Fig. 2(a) that there are two input potential ports and and two output flow ports and on the copotential 0s-junction. If the signal flow on the 0s-junction activates a Boolean switch in the key path, the corresponding variable on the key path takes effect in the system. If key 1 is activated when and , the flow quantity and potential variables on key 1 become effective. At this point, the bond path connected on the co-potential 0s-junction is the bond 1-3, and there is a unique inflow flow quantity and potential variable at the junction. Similarly, It can be seen from Fig. 2(b) that when key 2 is activated at and , flow quantity and potential variable on key 2 become effective. In addition, the bond path connected on the 1s-junction of the co-current junction is the bond 2-3, and there is a unique inflow flow quantity and potential variable at the junction. The calculation relationship between the co-potential 0s-junction and the co-current 1s-junction is shown in Eq. (8) and Eq. (9) respectively:
Fig. 2The bond graph model of power junction
a) 0s-junction
b) 1s-junction
Co-potential junction: 0s-junction:
Co-current junction: 1s-junction:
3.1.5. Bond graph model of time-varying stiffness
It can be seen from Eq. (7) that the time-varying stiffness of gear tooth mesh is a piecewise function. According to the working principle of power junction and the conditions of state control distribution (Table 3), a bond graph model of gear mesh time-varying stiffness can be established, as shown in Fig. 3. , and represent Boolean variables, which control the state of time-varying meshing stiffness system. At any time, only one boolean variable can be 1, and the other two boolean variables must be 0. Among them, the capacitive elements simulating time-varying meshing stiffness are , and respectively. Where, 1 / . And the calculation relationship between each key path is shown in Eq. (10):
Table 3Control state table of time-varying meshing stiffness
Element name | Representation way | Status type | ||
Switch 1 | 1 | 0 | 0 | |
Switch 2 | 0 | 1 | 0 | |
Switch 3 | 0 | 0 | 1 | |
Fig. 3The bond graph model of time-varying stiffness
3.2. Teeth surface sliding friction
3.2.1. Friction mechanism
When studying the friction mechanism of tooth surface, the influence of tooth side clearance and oil film on friction performance is not considered, and the tooth surface friction is regarded as Coulomb friction. In the process of gear transmission, the meshing teeth produce a sliding form of dry friction on the tooth surface. This form of friction has nothing to do with the contact area, but is proportional to the normal positive pressure at the contact surface, and the direction of friction is opposite to the relative sliding direction. When the meshing point of each pair of meshing gear teeth is at the upper and lower sections of the pitch circle, the direction of the sliding velocity of the tooth surface will change at the meshing point of the pitch circle, and the direction of the sliding friction force will also change. In addition, due to the fact that the geometric structure of the gear itself is not very ideal and is affected by the surrounding transmission environment, the position of each pair of gear teeth is different, and the meshing force will also change with the change of the meshing position, which results in the normal positive pressure at the meshing point. The size and direction of the tooth surface friction value will change periodically. According to the Coulomb sliding friction principle, the calculation relationship of basic friction is shown in Eq. (11):
where, is the Coulomb friction force on the tooth surface, is the viscosity friction coefficient, is the positive pressure, is a symbolic function, is the direction control variable of the friction force, as shown in Eq. (12):
where, is the relative sliding speed of the engagement point, as shown in Eq. (13):
where, is the gear pressure angle, is the addendum circle radius of the driving gear, is the addendum circle radius of the driving gear, is the addendum circle radius of the driven gear, is the addendum circle radius of the driven gear, is the rotational speed of the driving gear, and is the rotational speed of the driven gear.
3.2.2. Friction bond graph model of tooth surface
Friction is an energy-consuming system in gear transmission system, which can be simplified as an energy-consuming element to describe. The friction effect of tooth surface is simulated with 0s-junction and SPJ switch; The relationship between the direction of the friction force on the tooth surface and the relative meshing speed is simulated by using 1s-junction and SPJ switch. The friction coefficient is simulated by using the adjustable resistance conversion element (MR). represents control key of parameter signals. In addition, and are two mutually exclusive Boolean variables. Only one variable can be activated in the same time period to control the direction of friction, as shown in Table 4.
Table 4Boolean variable assignment table
function | Boolean variable | |
1 | 1 | 0 |
–1 | 0 | 1 |
Combined with the modeling principle of switch type bond graph, the bond graph model of gear tooth surface friction can be obtained, as shown in Fig. 4.
Namely, the characteristic equation of the gear tooth surface friction system is shown in Eq. (14):
3.3. Engagement damping
The gear tooth meshing damping is approximately calculated by empirical formula, as shown in Eq. (15):
where, is damping ratio, is the average meshing stiffness, is the rotational inertia of the driving wheel, is the rotational inertia of driven wheel, and respectively represent the dividing circle radius of the driving and driven wheels.
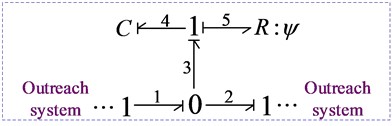
Meshing damping is an energy dissipation system, which is simulated by resistive elements . The bond graph model of gear tooth meshing damping is shown in Fig. 5.
Fig. 4Bond graph model of tooth surface friction
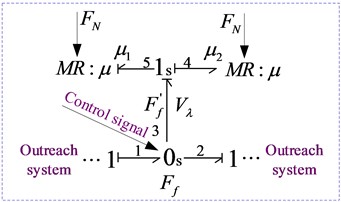
Fig. 5Bond graph model of meshing damping
3.4. Steady-state transmission error
3.4.1. Source of steady-state transmission error
There are many kinds of gear transmission error, mainly including manufacturing errors, installation errors and improper operating conditions, which often lead to different forms of damage to gears. These damage forms will cause vibration or noise in the system during gear operation. It not only worsens the system’s operating environment and reduces the transmission efficiency, but also decreases the service life of transmission components. Since steady-state transmission error generates a periodic excitation source for the gear system, it is described by a harmonic function , shown in Eq. (16):
where, is the mean steady-state transmission error, is the amplitude of steady-state transmission error fluctuation, is the meshing frequency, , and are the rotational speed and teeth number of the driving wheel, respectively, is the initial phase angle.
The derivative form of steady-state transmission error, whose derivative form is shown in Eq. (17):
where, is the fluctuation amplitude, is the meshing frequency, is the initial phase angle.
3.4.2. Bond graph model of steady-state transmission error
The steady-state transmission error of the gear teeth is a displacement excitation, and its derivative form is the rotational speed characteristic of the system. Flow source is adopted for simulation, and its bond graph model is shown in Fig. 6.
Fig. 6The bond graph model of steady-state transmission error
4. Establishment of dynamic model of wheel system nonlinear system
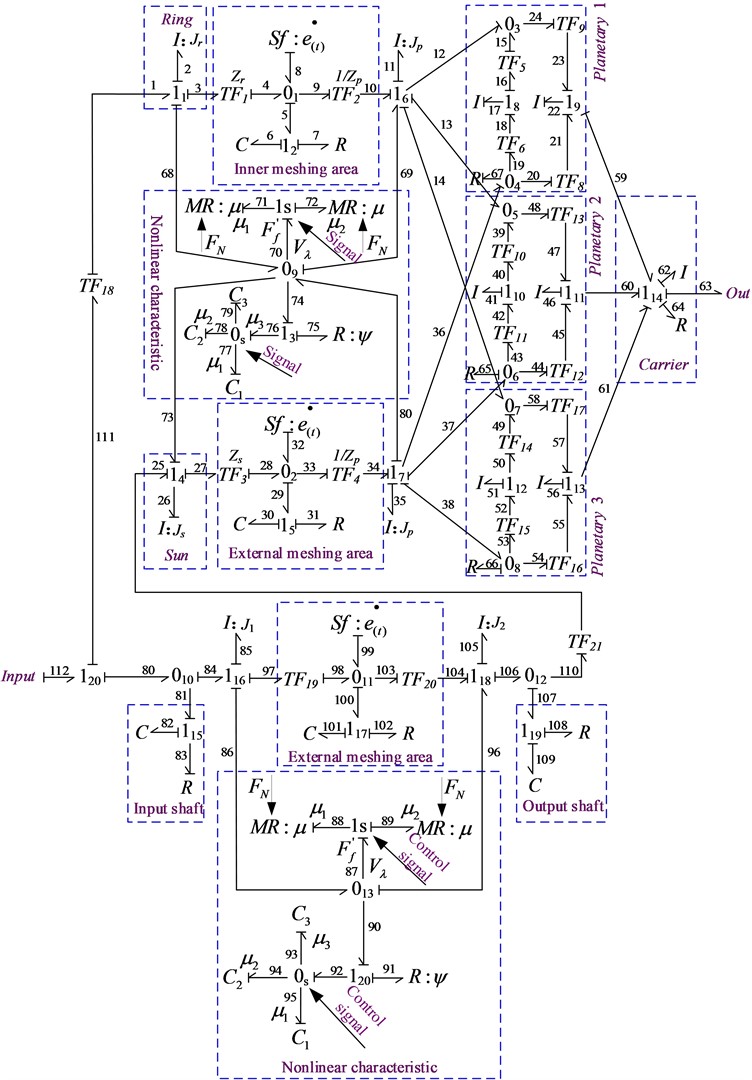
The nonlinear dynamic bond graph model of PX single-loop gear train is shown in Fig. 7.
5. Study on dynamic characteristics of nonlinear single loop gear system
5.1. Dynamic characteristics of the single-loop ring system of PX type
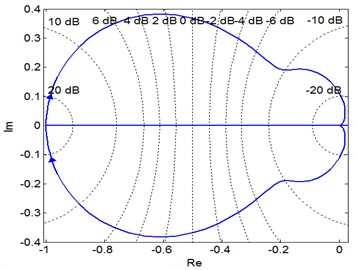
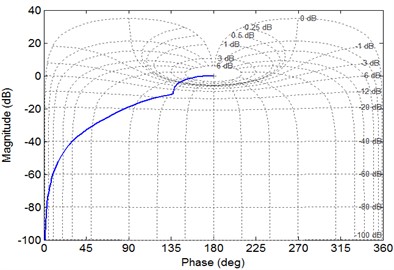
Fig. 8(a) shows the phase trajectory diagram of PX single-loop gear system. The trajectory line circles point (0,0) clockwise, but does not surround point (–1, 0), and passes through the negative real axis from the right side of the point. Therefore, the analysis shows that the stable state of PX single loop gear system is unstable. As shown in Fig. 8(b), the amplitude-phase characteristic diagram of PX single-loop gear system shows that the amplitude margin of this system 11.6 dB > 0 (0.136 rad/s).
5.2. X-type subsystem
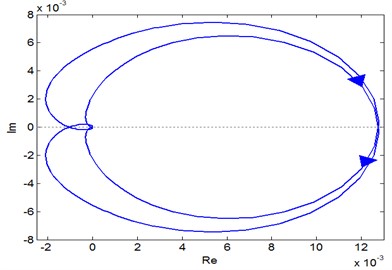
Fig. 9 shows the amplitude-phase characteristic diagram. The subsystem is cutoff from the input end to type X, and the stable state of X-type subsystem inside the single-loop system is studied. The analysis demonstrates that the dynamic characteristics of this subsystem in PX single loop gear system are unstable.
Fig. 7Nonlinear bond graph model for single-loop gear system of PX type
5.3. P-type subsystem
Similarly, Fig. 10(a) shows the amplitude-phase characteristics of the subsystem, which is cut off from the input to the P-type. From Fig. 10(b), it can be concluded that the amplitude margin 59.6 dB > 0 (2.13 rad/s).
Fig. 8Characteristic phase diagram of PX-type single loop gear system
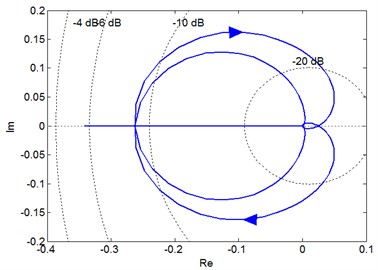
a) Phase diagram
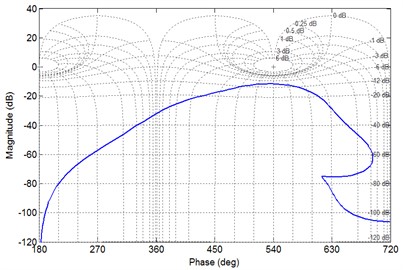
b) The amplitude-phase-frequency characteristic
Fig. 9Characteristic phase diagram of the X-type subsystem
a) Phase diagram
b) The amplitude-phase-frequency characteristic
Fig. 10Characteristic phase diagram of the P-type subsystem
a) Phase diagram
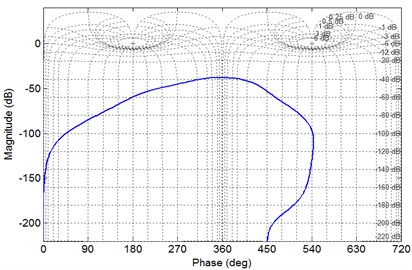
b) The amplitude-phase-frequency characteristic
6. Conclusions
In this research, study on nonlinear dynamic characteristic of single-loop gear system based on bond graph method. Simulation has been conducted to prove the efficiency of this method. The conclusions are listed as follows:
1) Based on the mechanism study of nonlinear factors in the gear meshing system, such as time-varying meshing stiffness, tooth surface friction, gear tooth damping and steady-state transmission error, the bond graph model of these nonlinear factors is obtained.
2) According to the structural characteristics of the single loop gear system, the dynamic characteristics and modeling methods are studied. The nonlinear mathematical models of the PX are established by using the bond graph method. Then, the amplitude-phase-frequency characteristics are obtained respectively to study the stability of the single loop gear system.
3) According to the dynamic characteristics of PX single loop gear system, it is concluded that, when the whole single loop gear system is unstable, its system module also has the same unstability.
References
-
E. L. Esmail, E. Pennestrì, and M. Cirelli, “Power-flow and mechanical efficiency computation in two-degrees-of-freedom planetary gear units: new compact formulas,” Applied Sciences, Vol. 11, No. 13, p. 5991, Jun. 2021, https://doi.org/10.3390/app11135991
-
W. Wang et al., “A multi-objective power flow optimization control strategy for a power split plug-in hybrid electric vehicle using game theory,” Science China Technological Sciences, Vol. 64, No. 12, pp. 2718–2728, Dec. 2021, https://doi.org/10.1007/s11431-020-1770-3
-
X. Zhou, Y. Cui, L. Li, L. Wang, X. Liu, and B. Zhang, “Signal de-noising in gear pitting fault identification by an improved singular value decomposition method,” Forschung im Ingenieurwesen, Vol. 84, No. 2, pp. 79–90, Jun. 2020, https://doi.org/10.1007/s10010-020-00400-7
-
Z. Jahanbin, A. Selk Ghafari, A. Ebrahimi, and A. Meghdari, “Multi-body simulation of a flapping-wing robot using an efficient dynamical model,” Journal of the Brazilian Society of Mechanical Sciences and Engineering, Vol. 38, No. 1, pp. 133–149, Jan. 2016, https://doi.org/10.1007/s40430-015-0350-4
-
Y. S. Hamed, K. M. Albogamy, and M. Sayed, “Nonlinear vibrations control of a contact-mode AFM model via a time-delayed positive position feedback,” Alexandria Engineering Journal, Vol. 60, No. 1, pp. 963–977, Feb. 2021, https://doi.org/10.1016/j.aej.2020.10.024
-
Jedliński, A. Syta, J. Gajewski, and J. Jonak, “Nonlinear analysis of cylindrical gear dynamics under varying tooth breakage,” Measurement, Vol. 190, p. 110721, Feb. 2022, https://doi.org/10.1016/j.measurement.2022.110721
-
S. Liu, A. Hu, Y. Zhang, and L. Xiang, “Nonlinear dynamics analysis of a multistage planetary gear transmission system,” International Journal of Bifurcation and Chaos, Vol. 32, No. 7, Jun. 2022, https://doi.org/10.1142/s0218127422500961
-
Ouyang T. et al., “Effect of structural design parameters on nonlinear dynamic characteristics of the gear transmission,” Proceedings of the Institution of Mechanical Engineers, Part D: Journal of Automobile Engineering, Vol. 236, No. 4, pp. 522–539, 2022.
-
H. Dong, H. Q. Zhang, X. L. Zhao, and L. L. Duan, “Study on dynamic load-sharing characteristics of face gear dual-power split transmission system with backlash, support and spline clearance,” Mechanical Sciences, Vol. 12, No. 1, pp. 573–587, May 2021, https://doi.org/10.5194/ms-12-573-2021
-
W. Zhou, R. Zhu, W. Liu, and Y. Shang, “An improved dynamic transmission error model applied on coupling analysis of gear dynamics and elastohydrodynamic lubrication,” Journal of Tribology, Vol. 144, No. 5, pp. 51601–51610, May 2022, https://doi.org/10.1115/1.4051813
-
XX.-F. Gou, G.-Y. Li, and L.-Y. Zhu, “Dynamic characteristics of a straight bevel gear drive system considering multi-state meshing and time-varying parameters,” Mechanism and Machine Theory, Vol. 171, p. 104779, May 2022, https://doi.org/10.1016/j.mechmachtheory.2022.104779
-
H. Li, S. Chen, J. Tang, Z. Sun, and Y. Hu, “Nonlinear dynamic modeling and analysis of spur gear based on gear compatibility conditions,” Mechanism and Machine Theory, Vol. 171, p. 104767, May 2022, https://doi.org/10.1016/j.mechmachtheory.2022.104767
-
Hou X. et al., “A modified damping model of vector form intrinsic finite element method for high-speed spiral bevel gear dynamic characteristics analysis,” Journal of Strain Analysis for Engineering Design, Vol. 57, No. 2, pp. 144–154, 2022.
-
Y. Nie et al., “Phenomenological vibration models of planetary gearboxes for gear local fault diagnosis,” Mechanism and Machine Theory, Vol. 170, p. 104698, Apr. 2022, https://doi.org/10.1016/j.mechmachtheory.2021.104698
-
H. T. Chen, X. L. Wu, D. T. Qin, J. Yang, and Z. G. Zhou, “Effects of gear manufacturing error on the dynamic characteristics of planetary gear transmission system of wind turbine,” Applied Mechanics and Materials, Vol. 86, pp. 518–522, Aug. 2011, https://doi.org/10.4028/www.scientific.net/amm.86.518
-
C. Dong and Y. Liu, “Experimental study on transmission error and dynamic backlash of elliptic gear transmission system,” Proceedings of the Institution of Mechanical Engineers, Vol. 236, No. 1, pp. 130–139, 2022.
-
Z. Cao et al., “Dynamic simulation and experimental study of electric vehicle motor-gear system based on state space method,” Machines, Vol. 10, No. 7, p. 589, Jul. 2022, https://doi.org/10.3390/machines10070589
-
X. S. Wang, S. J. Wu, J. C. Hu, and J. Chen, “Chaos and bifurcation analysis of gear pair with wear fault,” in International Conference on Material Sciences and Manufacturing Technology, pp. 516–520, 2012.
-
J. Rodríguez-Guillén, R. Salas-Cabrera, and P. M. García-Vite, “Bond Graph as a formal methodology for obtaining a wind turbine drive train model in the per-unit system,” International Journal of Electrical Power and Energy Systems, Vol. 124, p. 106382, Jan. 2021, https://doi.org/10.1016/j.ijepes.2020.106382
-
M. G. Tsegay, P. M. Pathak, A. K. Samantaray, and R. Merzouki, “Bond graph modeling of a spatial multi-section soft bionic robot,” Mechanism and Machine Theory, Vol. 174, p. 104902, Aug. 2022, https://doi.org/10.1016/j.mechmachtheory.2022.104902
About this article

This work was supported by grants from the Introduce High-level Talents to Start Scientific Research Funds by Shaanxi Polytechnic Institute of China (No. BSJ 2021-11) and (No. 2020-9), which were highly appreciated by the authors.
The datasets generated during and/or analyzed during the current study are available from the corresponding author on reasonable request.
Wenting Zhang: writing papers, mechanical modeling, simulation analysis, etc. Jiamin Liu: studied nonlinear dynamics of gear clearance system and worked on thesis translation, etc. Xintao Zhou: writing papers, providing research methods, investigation, validation, and experimental verification, etc. Yahui Cui: formal analysis, and investigation, etc.
The authors declare that they have no conflict of interest.
