Abstract
The bicuspid aortic valve is a congenital abnormality where two leaflets tie together resulting in a valve with bicuspid configuration instead of the normal tricuspid geometry. This study investigates haemodynamics of the diseased bicuspid aortic valve during systole by using numerical simulation. The numerical model has coupled computational fluid dynamics and finite element analysis simulation to analyze fluid-structure interaction phenomena of the bicuspid aortic valve. The valve leaflets geometry has been developed with 12.5 mm height, 0.3 mm leaflet thickness and free edge angle of 40 degree. The valve diameter is 23.5 mm. The model has utilized the tie constraint to simulate the disorder condition of two leaflets fused together. The diseased bicuspid valve produces an obstacle to blood flow and results a decrease of blood flow in whole flow regime which could cause huge energy loss during each heart beat. This might induce high cyclic shear stress distribution and lead to other severe issues to the valve.
1. Introduction
The diseased bicuspid aortic valve (BAV) is caused by the fusion or non-separation of two valvular leaflets. That results the leaflets in bicuspid configuration instead of the normal tricuspid shape during systole. The BAV-related configuration and blood flow phenomena have been investigated by clinical studies and molecular analyses nowadays [1]. However, it is not possible to discriminate the effects of the biomechanical determinants without assistance of numerical techniques [2-9]. The biomechanical aspects would be analyzed using numerical techniques by quantifying the possible abnormal stresses and strains associated with the BAV.
Only several studies have used a computational approach to address the BAV disease. All the previous studies have limitations with the specific assumptions. Robicsek et al. [1] studied the haemodynamics of a highly eccentric BAV by a computational fluid-dynamics (CFD) model. The study assumed that solid tissues are completely rigid. Weinberg and Kaazempur [10] have developed a fluid structure interaction model characterized by the valves haemodynamics. However, the research has assumed the whole valve and sinus model as symmetric structures. This is completely violated with the physiological configuration. In this paper, we have developed a fluid-structure interaction (FSI) analysis model with a quasi-steady foundation. The quasi-steady model can apply to most complicated FSI problems and costs less calculating time with simple programming. In the model, we couple CFD software and finite element analysis (FEA) simulation to investigate the haemodynamics and biomechanics in both the normal and the bicuspid aortic valves.
2. Methodology
We refer the reader to Hsu et al. [11] for a detail description of the developed numerical FSI model. Essentially, this study simulates the FSI phenomena in the aortic valve by totally using commercial software without any complicated programming. The deformed leaflets surfaces in ABAQUS (FEA software) is delivered to FLUENT (CFD software) for fluid dynamics analysis by using Alter Hyper-mesh (reading and recreating deformed leaflets surfaces) and SolidWorks (regenerating fluid working domain according to deformed valve leaflets). The coupling processing corresponds to serial algorithm in which at each step one code is running while another code is waiting for exchanging data. The simulation is simplified with leaflets deformation analysis in ABAQUS which can be operated independently by using pre-known loads (transvalvular pressure) and assuming that the valve suffered only this pressure during systolic phase. The deformed valve leaflets geometries at each step are then exported to FLUENT to perform blood flow analysis. The numerical model shows very promising results that really matched with strong coupling solutions reported in the previous studies [1, 2]. We can therefore conclude that the simulation results are completely reliable. The coupling process currently is manually performed which allows user to control and alter the convergence of each computing step in both FLUENT and ABAQUS. This could be counted as an advantage of the proposed method to some other commercial coupling software packages such as MpCCI since the packages proceeded by assuming that all analyses in both two codes should be converged. The proposed method however needs a huge amount of time to proceed and almost impossible to perform when the step size is very small. This could result in a huge amount of steps. We are currently working on creating an interface to make data exchange between CFD and FEA codes more efficiently.
The bicuspid valve is the diseased aortic valve where two of the aortic valvular leaflets fused together. The model utilizes tie constraint in ABAQUS software to simulate the fusing behavior of two leaflets. The constraint ties two separate leaflets together so that no relative motion between the diseased leaflets. The constraint permits us to tie two leaflets together even if the meshes created on the leaflet surfaces of the region are dissimilar.
3. Results and discussion
3.1. Orifice distortion
The valve leaflets opening and closing characteristics during systolic phase for both the normal and the bicuspid aortic valves are demonstrated in Table 1. For the normal valve, the valve orifice has changed from stellular shape to triangle shape (A1-A2) and triangle shape to circular shape (A2-A3) during opening time and ejection time (0 s-0.08 s). These results are consistent with those of Robicsek et al. [1] and Weinberg and Kaazempur [10]. The closing behaviors of the valve during deceleration time (0.11 s-0.2 s), however, are slightly different with the results of some other researches (e.g., Robicsek et al. [1], Weinberg and Kaazempur [10]) but agree well with the results of DeHart et al. [12]. The valve orifice changes from circular shape to triangle shape (A4-A5) from 0.11 s to 0.18 s and from triangle to smaller triangle before completely closed (A5-A6) from 0.18 s to 0.2 s. It should be noted that the aortic valve geometry developed with the selected parameters is reliable on evaluating the results with those of the previous study. The discussion also indicates that the design parameters can affect biomechanical behaviors of the valve.
To discuss orifice distortion for the BAV, some researches have described a congenital diseased aortic valve with malformed cusps were fused at all three commissures so that the orifice was only a narrow slit between a large posterior cusp and the completely fused small right and left cusps [13]. In our study, three leaflets are assumed to have same dimensions while two diseased leaflets are supposed to tie together. The valve orifice is mainly formed by the opening level of the healthy leaflet because the diseased leaflets are glued and opening level is restricted. At the very beginning of valve opening ( 0.02 s [B1]), the orifice distortion of the bicuspid valve is observed. The limited motion of two malformed leaflets significantly affects opening level of the normal leaflet during acceleration time, 0.02 s to 0.08 s. The valve orifice formed by free edge of the normal leaflet and two malformed leaflets is almost circular shape, especially, during ejection time from 0.08 s to 0.11 s (B3-B4) although much smaller than the orifice of normal valve. The malformed leaflets tend to quickly turn back to close position so that somehow make normal leaflet quickly turn back to close position (B5-B6) during deceleration time from 0.18 s to 0.2 s. Therefore, the valve orifice during this time is also a narrow slit. These results are rather similar to those proposed by Rogers et al. [13].
Table 1Orifice distortion: normal vs. bicuspid valve
Time (sec) | Normal aortic valve | Bicuspid aortic valve | Time (sec) | Normal aortic valve | Bicuspid aortic valve |
0.02 | 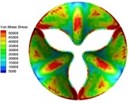 A1 | 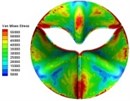 B1 | 0.11 | 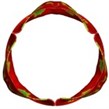 A4 | 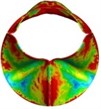 B4 |
0.04 | 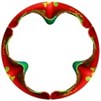 A2 | 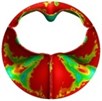 B2 | 0.18 | 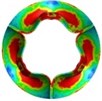 A5 | 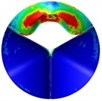 B5 |
0.08 | 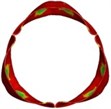 A3 | 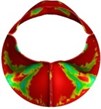 B3 | 0.2 | 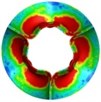 A6 |  B6 |
3.2. Opening vs. closing time
The opening time of the normal aortic valve is measured from the moment when the valve starts to open to the moment when the leaflets stay at fully opened position. On the other hand, the closing time is detected from the end of opening time to the moment when the leaflets are fully closed (Fig. 1). The total time of opening and closing behavior for the normal valve is approximately 0.28 s that also accords with that of theoretical description [13]. It should be noted that an ideal aortic valve often opens quickly and closes slower that ensures a sufficient amount of blood supplied to the circulation during each heart beat. Although the opening and closing time of the normal aortic valve in current simulation is reasonable, it is obvious that selected design parameters of the valve geometry can significantly affect biomechanical responses of the valve.
Fig. 1Opening and closing time: normal vs. bicuspid valve
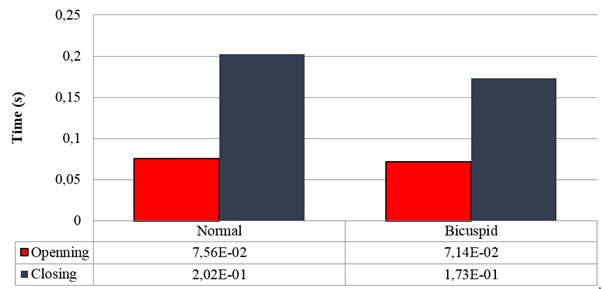
For the BAV, the time is calculated in the similar way. The leaflets of the BAV tend to move more quickly than that of the normal valve during systole as can be seen from Fig. 1. This results in shorter opening as well as closing time. It should be noted that the bicuspid valve could not perform fully opening situation as the normal valve dose due to the fusion of two diseased leaflets although the opening time of 0.0714 s is still acceptable. Two diseased leaflets tend to move faster back to close position during closing phase due to the situation of being fused together. These two fused leaflets affect moving speed of the normal leaflet and make the normal leaflet quicker returns to close position. This effect not only explains high orifice distortion rate of the bicuspid valve during closing phase but also forecasts a sophisticated haemodynamics of blood flow through the valve.
3.3. Haemodynamics
The interaction between the motion of valve leaflets and the blood flow results in a complex three-dimensional flow. The three-dimensional flow associated with deformed valve leaflets of the normal and bicuspid valves at some typical moment during systole, i.e., 0.02 s, 0.04 s, 0.08 s and 0.2 s are demonstrated in Fig. 2 and Fig. 3. The valve starts to open and forms the stellular orifice at 0.02 s for the normal aortic valve (Fig. 2(a)). The blood flow mainly concentrates in the center of the orifice and creates a small jet flow through the valve. Blood flow velocity quickly rises to 0.15 m/s and the blood flow ejects to ascending aorta when the valve orifice forming triangle shape at 0.04 s (Fig. 2(b)). The valve is fully opened and the blood flow ejection occurs at 0.08 sec (Fig. 2(c)). It should be noted that the aortic valve already starts to close while the ejection continues even though the aortic pressure exceeding ventricular pressure at this moment.
The valve is rapidly closing, resulting in a decrease of blood flow on the whole aorta domain during remaining time of the systolic phase. This study has selected the design parameters of the aortic valve as the leaflet height 12.5 mm, the leaflet thickness 0.3 mm, and the free edge angle 40 degree as mentioned above. This configuration leads to the alteration of the valve orifice at 0.2 sec, which results in small triangle shape instead of stellular shape, and therefore generates a smoother jet flow at the center (Fig. 2(d)).
Fig. 23D complex flow of normal aortic valve
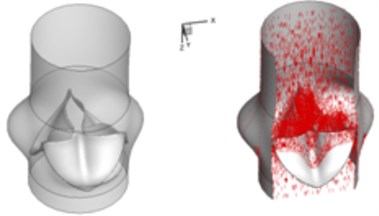
a) 0.02 s
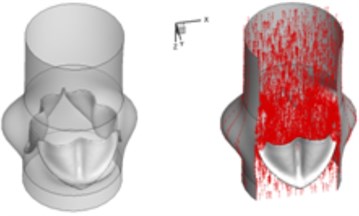
b) 0.04 s
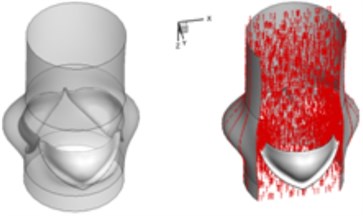
c) 0.08 s
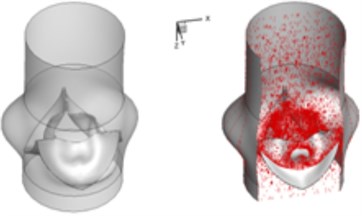
d) 0.2 s
Compared to the normal valve, two fused leaflets for the BAV produce a great obstacle to the flow field resulting in a high decrease of blood flow during systole. The results in Fig. 3 highlight these phenomena. It should be noted that the BAV disease could lead to severe problems similar to a stenotic valve as can been seen from current simulation. Patients with diseased bicuspid aortic valve could become tired more easily than those with normal valvular function and have difficulty to maintain stamina due to poor heart valve performance. In order to supply an enough mount of blood to the circulation system, the heart suffers more stress to pump blood through the diseased valve.
Fig. 33D complex flow of bicuspid aortic valve
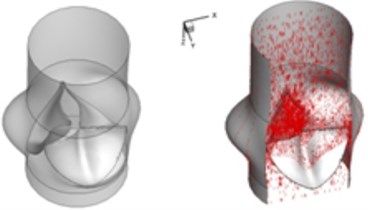
a) 0.02 s
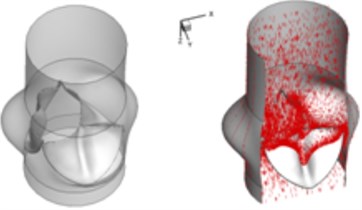
b) 0.04 s
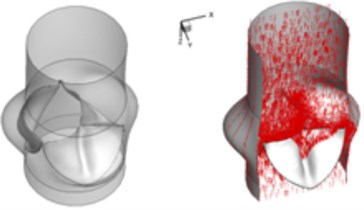
c) 0.08 s
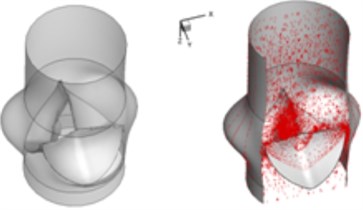
d) 0.2 s
Table 2 performs velocity vector and pressure distribution on a plane that crossed through the middle of the valve in order to give an insight of the flow field of the normal and bicuspid valves.
Table 2Velocity and pressure distribution: normal vs. bicuspid valve
Time (sec) | Normal valve | Bicuspid valve | Time (sec) | Normal valve | Bicuspid valve |
0.02 | 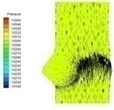 I-1 | 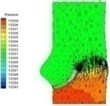 II-1 | 0.08 | 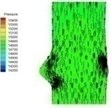 I-4 | 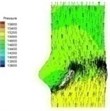 II-4 |
0.04 | 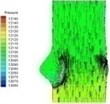 I-2 | 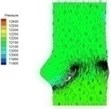 II-2 | 0.11 | 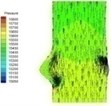 I-5 | 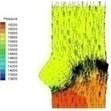 II-5 |
0.06 | 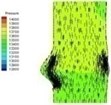 I-3 | 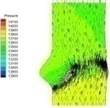 II-3 | 0.2 | 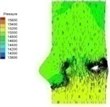 I-6 | 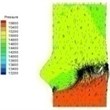 II-6 |
The blood flow through the valve is small leading to small pressure difference between ventricular and aortic sides of the normal valve at the beginning of systolic phase (I-1). The pressure difference between two sides of the valve increases when the flow velocity increases and the valve further opens (I-2). The high pressure area successively moves from ventricular side to the aortic side of the valve as can be observed in Table 2 at about 0.06 s (I-3).
There is almost no pressure drop across the valve that reflects uniform pressure distribution on both sides of the valve when the valve is at fully opening position (I-4). The valve starts closing phase leading to increase of pressure difference (I-5) after the intense ejection at 0.08 s. The valve orifice is small triangle shape and the vortices appear at the sinus cavity at the end of systole, i.e. about 0.2 s. Those vortices are considered as the mechanism which assists the leaflet to close. It can be seen that the pressure drop is insignificant at the end stage of systole.
Haemodynamics of the BAV is much more complicated in contrast to that of the normal valve. The decrease of blood flow on whole aortic domain could be observed more clearly. Once the valve starts to open (II-1), the high pressure difference could be found. The pressure difference increases when the valve further opens (II-2). When the valve is reaching the ejection moment (II-3), the pressure difference tends to reduce. Pressure drop could be still observed (II-4), however, at about 0.08 s when the valve is at fully opening position. The high pressure difference between two sides of the valve is formed due to very small orifice during deceleration time. The vortices could be found at the sinus cavity behind the diseased leaflets. These vortices generate pushing forces to the leaflets effecting a quicker movement of the leaflets back to the close position.
3.4. Shear stress distribution
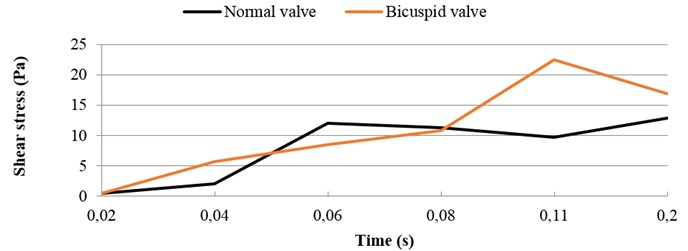
It should be noted that the valve orifice variation of the BAV has induced different shear stress distribution. A comparison of the highest shear stress at systolic phase between the normal valve and the BAV is demonstrated in Fig. 4. The high shear stress distributes on the endothelial linings for the normal valve where jet impingement with high blood velocity takes place. During ejection period from 0.06 sec to 0.11 sec, the high shear stress takes place when blood flow at high velocity. On the other hand, during the deceleration period from 0.11 sec to 0.2 sec the high shear stress appears when the jet impingement takes place. The highest shear stress is around 13 N/m2 for the normal valve at 0.2 sec. During ejection period from 0.06 sec to 0.08 sec, the shear stress on the leaflets for the BAV is smaller than that on the normal valve. During deceleration period from 0.11 sec to 0.2 sec, the higher shear stress happens on the BAV. At 0.11 sec, the highest shear stress is around 22.5 N/m2 for the BAV.
Fig. 4Highest shear stress during systole: normal vs. bicuspid valve
3.5. Effective orifice area
The effective orifice area (EOA) can be computed by the mathematical formula as below [14]:
where is the root-mean-square (rms) flow rate during the forward flow through the valve and ∆p is the mean pressure drop across the open valve. The parameter C represents a constant that is determined based on the discharge coefficient for the aortic valve. The larger EOA of a valve, the smaller energy loss in flow across the valve.
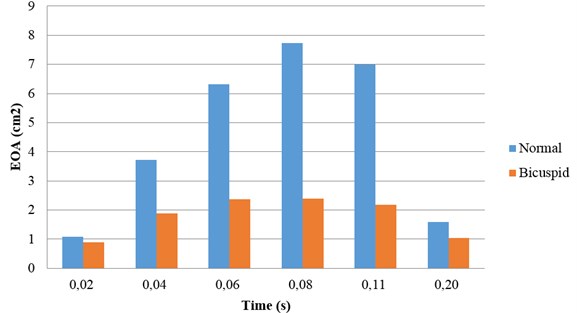
The variation tendency of EOA during systole is similar for both the normal valve and the BAV (Fig. 5). The EOA is increasing during flow acceleration period and decreasing during flow deceleration period. The diseased bicuspid aortic valve owns a smaller EOA compared with that of the normal valve. The difference of EOA between the normal valve and the diseased bicuspid valve can be observed in whole systolic phase. The smaller EOA of the diseased bicuspid valve indicates that the energy loss of flow across the diseased valve is higher.
Fig. 5Effective orifice area: normal vs. bicuspid valve
4. Conclusions
A quasi-steady based numerical model is developed to investigate the biomechanics and haemodynamics of the normal and the diseased bicuspid valves. We choose the geometry model of Robicsek et al. [1] to configure the aortic valve. However, the valve leaflet model is developed with the height of 12.5 mm, the free edge angle of 40 degree, the thickness of 0.3 mm and the valve diameter of 23.5 mm. Meanwhile, the tie constraint is applied to simulate the fusion condition between two diseased leaflets of the BAV. The analysis results are consistent with those of previous studies and highlight simulation reliability of the numerical model. These results provide valuable reference data for studies related to the bio-prosthetic, tissue-engineering or polymeric valves which attempt to imitate the geometry of the natural aortic valve.
The numerical simulation of the BAV provides an insight of haemodynamics and biomechanics of aortic valve disorder. This is difficult to achieve by experimental or clinical methods. The diseased bicuspid valve produces a great obstacle to the blood and induces a decrease of blood in circulation which may lead high energy loss. Meanwhile, the blood flow also induces a high shear stress on the valve leaflets. It could induce a high possibility of valve calcified later in life and lead to severe problems to the valve.
References
-
Robicsek F., Thubrikar M. J., Cook J. W., Fowler B. The congenitally bicuspid aortic valve: how does it function? Why does it fail? The Annals of Thoracic Surgery, Vol. 77, 2004, p. 177-185.
-
Arcidiacono G., Corvi A., Severi T. Functional analysis of bioprosthetic heart valves. Journal of Biomechanics, Vol. 38, 2005, p. 1483-1490.
-
Hsu C. H. Blood flow analysis of polyurethane heart valves at peak systole. Biomedical Engineering – Applications, Basis and Communications, Vol. 18, 2006, p. 13-18.
-
Griffith B. E., Hornung R. D., McQueen D. M., Peskin C. S. An adaptive, formally second order accurate version of the immersed boundary method. Journal of Computational Physics, Vol. 223, Issue 1, 2007, p. 10-49.
-
Morsi Y., Yang W., Wong C., Das S. Transient fluid-structure coupling for simulation of a trileaflet heart valve using weak coupling. Journal of Artificial Organs, Vol. 10, 2007, p. 96-103.
-
DeHart J., Peters G. W. M., Schreurs P. J. G., Baaijens F. P. T. A three-dimensional computational analysis of fluid-structure interaction in the aortic valve. Journal of Biomechanics, Vol. 36, 2003, p. 103-112.
-
Vierendeels J., Dumont K., Verdonck P. R. A partitioned strongly coupled fluid-structure interaction method to model heart valve dynamics. Journal of Computational and Applied Mathematics, Vol. 215, 2008, p. 602-609.
-
Chandran K. B., Yoganathan A. P., Rittgers S. E. Biofluid Mechanics – The Human Circulation. Taylor and Francis Group, 2007.
-
Waite L., Fine J. Applied Biofluid Mechanics. McGraw Hill, 2007.
-
Weinberg E. J., Kaazempur M. R. A multiscale computational comparison of the bicuspid and tricuspid aortic valves in relation to calcific aortic stenosis. Journal of Biomechanics, Vol. 41, 2008, p. 3482-3487.
-
Hsu C. H., Shih W. C., Vu H. H. A fluid-structure coupling model for haemodynamics simulation of normal aortic valve. Journal of Vibroengineering, Vol. 17, Issue 3, 2014, p. 1518-1525.
-
DeHart J., Peters G. W. M., Schreurs P. J. G., Baaijens F. P. T. Collagen fibers reduce stresses and stabilize motion of aortic valve leaflets during systole. Journal of Biomechanics, Vol. 37, 2004, p. 303-311.
-
Rogers W. M., Harrison J. S., Blanchard S. Contour spectral phonocardiography in the assessment of aortic valve disease. Annals of the New York Academy of Sciences, Vol. 147, 1969, p. 690-721.
-
Chandran K. B. Heart Valve Prostheses. Encyclopedia of Medical Devices and Instrumentation. John Wiley and Sons, 2006.
