Abstract
In recent years, Horizontal Directional Drilling has been the first choice in trenchless engineering of pipeline crossing for its strong environmental adaptability, high efficiency and low cost. In order to reduce the resistance force and avoid pipeline damage in construction, the angle formed by the pipeline axis and hole axis should be lessened when the pipeline is lifted to a height. However, the stress status of the pipeline is very complex during the lifting process. Hence the research of pipeline lifting process is great importance for pipeline safety. In this paper, a finite element model is established to uncover the stress variety law of pipeline during lifting process. And then its reliability was verified by the experimental method. At last, the results of engineering experiment show that the finite element model which is credible can be used to reveal the stress variety law of the pipeline during the lifting process.
1. Introduction
In the past 10 years, Horizontal directional drilling (HDD) has been popularly used to install steel and plastic underground pipelines in natural gas, electrical power and communication industries [1-7]. In the oil and gas pipeline engineering, the construction process of HDD usually includes three steps: pilot-hole drilling, reamer drilling and pipeline pullback [8-21].
In the pullback step, pipeline will deform and scrape easily if it is forcefully pulled into the hole at a large angle that is formed by the pipeline axis and the hole axis. Therefore, in order to prevent pipeline damage in engineering, the angle must be decreased to reduce the resistance force and internal stress of pipeline during the lifting process. However, the pipeline deformation increases rapidly with increasing construction depth and lifting height of pipeline. Furthermore, the stress status of pipeline will become complicated during the lifting process. So it is necessary to study the stress variety law of pipeline which is related to the damage of pipeline. In recent years, some existing analytical methods had been invented by scientists and engineers. The related detail information of it was reported by Baumert and Allouche [22-24].
This paper has analyzed the pullback step by finite element method, and gets reasonable results which were validated by tests.
2. The theoretical analysis model
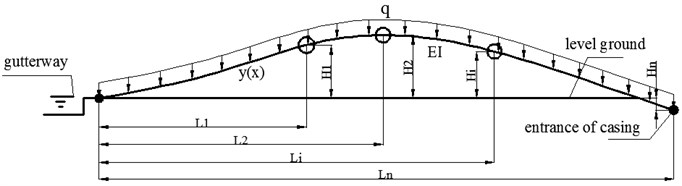
A straight pipeline lays on the ground, which will produce a deflection after the lifting force is applied to it. Compared with the length of pipeline part which is lifted, the lifting height and the variation of the angle are very small in practical project. Therefore, the deflection of pipeline can be calculated by the linear theory of small deflection. The lifting process is a moving boundary problem in the pullback step, so the polynomial interpolation function can be used to build multi-point lifting model of the pipeline. To determine the place of the moving boundary, the large deformation geometric nonlinear problem of pipeline can be transformed into piecewise linear problem by the displacement modified methods which includes load concentration modification, horizontal spacing modification, and iterative calculation [25]. After pipeline lifting model was established, we can use it to calculate the stress and deformation of the pipeline under certain lifting height [26-28].
2.1. Mechanical models
The mechanical model is shown in Fig. 1, it is seen that vertical force (1, 2,..., ) and uniform weight q are applied to the pipeline, the vertical and horizontal displacements of each point are marked as (1, 2,..., ) and (1, 2,..., ) separately. Segment the pipeline according to its ending points and lifting points, and then the bending deformation of each pipe segment is rather small [29, 30].
Fig. 1Mechanical model of pipeline
Based on the small deflection beam theory, the relationship among the physical parameters are as follows:
Corner:
Bending moment:
Shear force:
Uniform load:
2.2. Interpolation function
We select piecewise linear interpolation function as the approximate calculation equation, and then the differential equations for bending deformation of the pipeline are as follows:
(1) The lifting segment :
Solve the Eq. (5) and then get its solution:
(2) If the interpolation function value of section is known, the interpolation function of section can be gotten:
In these equations, , , , are undetermined coefficients, is the horizontal coordinate value of point which is the boundary point of interpolation functions and , and is the weight increment of segment compared with segment . Meanwhile, the mechanical analysis of section is shown in Fig. 2. Its calculation formula is as follows:
Fig. 2The mechanical analysis of section i+1 pipeline
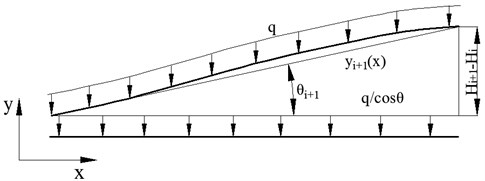
Where is the angle which is formed by the horizontal line and an inclined line which determined by points and , so it is with .
2.3. The boundary conditions
According to the mechanics of materials, the deflection angle is 0, corner is 0, and bending moment is 0 at the ending point of the pipeline. Then the following equation can be gotten, . So the following equations can be established at the boundary points:
Solve these equations, then we can get that , , , (2, 3,…, ).
Now, Eq. (6) and Eq. (7) can be simplified as follows:
After the simplification, there are still some undetermined coefficients in the interpolation equations. These coefficients can be solved according to the lifting height of each points and the pipeline ending point . Meanwhile, an unknown parameter , which is the distance between the pipeline ending point and the first hanging point, determines the location of the first interpolation function which can be calculated by the additional conditions. Because the pipeline is connected by universal joints at the ending point, the bending moment is 0, and the additional condition is:
2.4. The theory calculation
(1) Interpolation function of the first segment.
According to the lifting height of the first lifting point, we can get the value of parameter :
The interpolation functions of first section is:
(2) Interpolation function of any segment.
According to the lifting height of other lifting points, we can get the value of parameter :
Interpolation functions of any segment is:
We can get the angle and moment value of the ending point by using Eq. (16), and the distance can be determined according to additional conditions:
After having calculated the deflection curve of the pipeline, we can get the rotating angle, bending moment and shear force equation of each segment base on the linear beam theory:
(3) The calculation of maximum bending moment.
After having gotten the interpolation function of each section, we can get the maximum bending moment.
(4) The calculation of the maximum stress.
After getting the maximum bending moment, we use the following formula to calculate the maximum stress:
where is the section modulus of bending, ; is the moment of inertia, ; is maximum deflection.
(5) The calculation of the angle at the pipeline ending point.
Using the deflection equation of the last section and boundary conditions at the ending point, we can get the corresponding angle:
3. The finite element model
The focus of this simulation is the angle between the pipeline axis and casing pipe axis, and the mechanical properties of the pipeline during lifting process. In order to reduce the complication of calculation and improve the calculating efficiency, it is necessary to establish simplified model according to the importance.
3.1. Physical model
(1) Casing pipe.
The casing pipe, which is embedded into soil, can be supposed to be completely stable state. So it can be simplified as a rigid body model for its high rigidity. As showed in Fig. 3, its model meshed by R3D4 element.
Fig. 3The finite element model of casing pipe
(2) Pipeline.
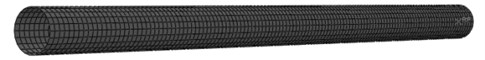
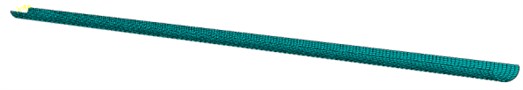
The common specification of pipeline in engineering is Ø711×20.6. And we establish a 120 meters length pipeline model according to the engineering. The pipeline is a thin wall component whose thickness is smaller than the diameter and length (generally less than 1/10). As shown in Fig. 4, the finite element model can be meshed by S4R element.
Fig. 4The finite element model of pipeline

(3) Gondola model.
The physical gondola is shown in Fig. 5, which is supported by rigid pulley. As shown in Fig. 6, its model meshed by R3D4 element, which can be simplified as a rigid body for its little deformation in engineering.
(4) Pipe rack group.
When establishing the finite element model, we take the sending pipe rack group as a whole body which is a discrete rigid body and can apply a constant sliding friction force to the pipeline. Then it is meshed by using the R3D4 four-node rigid three-dimensional bilinear quadrilateral grid. The mesh model is showed in Fig. 7.
Fig. 5The picture of gondola
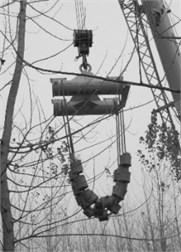
Fig. 6The finite element model of hanging basket
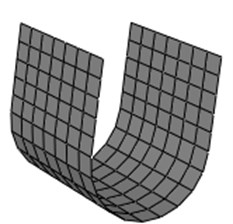
Fig. 7The finite element model of pipe rack
(5) Reamer.
Because the reamer is not the focus of the whole calculation, it is regarded as a rigid body and meshed by C3D8R eight-node linear hexahedral grid. The meshed model is shown in Fig. 8.
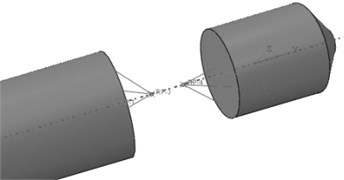
(6) Connection string and the universal hinge.
A connection string and a U-shaped hinge ring, which are intermediate connecting parts, connect the pipeline and the reamer. The connection string, which connects the reamer and U-shaped hinge ring, can be simplified as a rigid connection for its small deformation in working. The U-shaped hinge ring, which connects the string and pipeline and can rotate around the hinge point, can be replaced by a multi-body connection. The model of simplified connection is shown in Fig. 9.
Fig. 8The finite element model of reamer
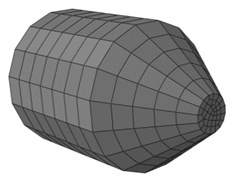
Fig. 9The finite element model of simplified connection
(7) Pipeline hoisting operation.
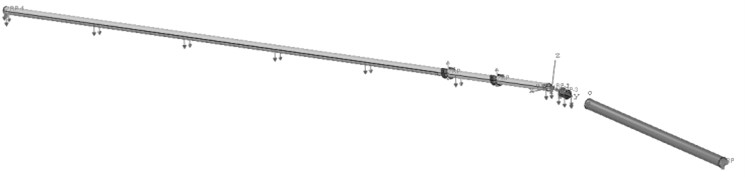
Before solving, we make the following settings: the U-shaped hinge ring is set to be a U-join hinge connection between the pipeline and connecting string; the connecting string is set to be a beam connection; and the connection parts are set to be coupling connection. The movement and force can be transferred by coupling connection. Then we couple the gondola and the working point RP which is laid on caterpillar. During the analysis of the lifting operations, lifting parameters can be changed via a coupling point. The model is showed in Fig. 10.
Fig. 10The finite element model of piping lifting
(8) Material property.
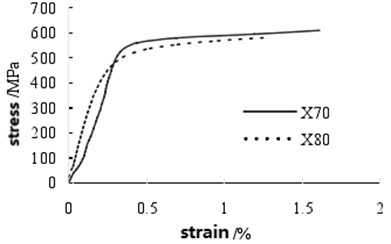
The calculation of pipeline stress is the priorities of this research. In this project, the pipeline material which can be defined in the software is X70. Its material parameters are obtained from the tested tensile data of Wang Linfeng [31], which include that yield strength is 569 MPa, elastic modulus is 195 GPa and the stress-strain curve of the material that is shown in Fig. 11.
3.2. Loads and boundary conditions
Loads and boundary conditions are set in accordance with the analysis steps:
(1) Initial step.
In initial step, casing pipe, sending pipe rack group, gondola and the ending point of reamer are completely fixed. The contacts among the pipe, gondola and the sending pip tack group are regarded as normal rigid contacts and the friction coefficients are 0.1. The ending point of the pipeline and the reamer is connected with U-shaped hinge. The reamer couples with the front-end motion reference point.
Fig. 11The stress-strain curve of X70 steel
(2) Step 1.
A gravity load is applied to the pipeline.
(3) Step 2.
Displacement constraint is applied to the reamer along the axis of the casing pipe.
(4) Step-3, Step-4.
Displacement constraint of the lifting height is applied to the gondola step-by-step. Considering there will be a little gondola deflection in the lifting process, we should release the rotational freedom of the gondola at the corresponding point to make sure that they are in a free state. The finished model, which has been applied on the loads and boundary conditions, is shown in Fig. 12.
Fig. 12The load and boundary conditions setting of finite element model
With the completion of the above settings, the model is completely established. The control parameters are mainly horizontal position and lifting height of the gondola in pipeline lifting operations.
4. Test and discussions
A series of tests had been done to verify the correctness of the calculation model in this paper. Firstly, the pipeline stress would be measured by these tests and simulation. Then the results of tests and simulation would be compared to verify the correctness of the model.
4.1. The method design of lifting operation
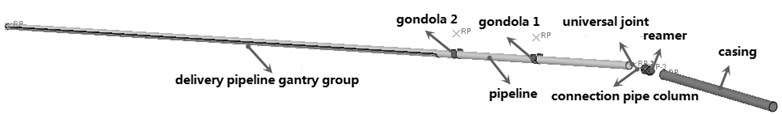
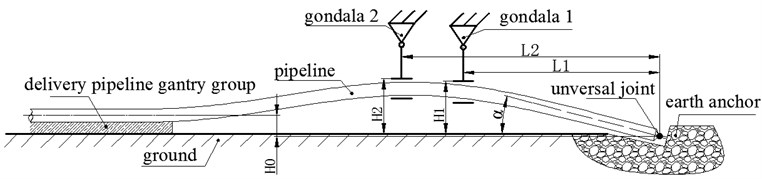
The lifting process can be simplified to facilitate the comparison between the tests and the simulation in the construction. The initial state of the test was established as Fig. 13, and then a flat horizontal plane instead of delivery pipeline gantry group was used to support the pipeline. To simulate the difference height between the entry points of the casing and the delivery pipeline gantry group in the actual construction, and to avoid the damage of the pipeline, we had excavated a test pit near the head point of the pipeline. The completely fastened earth anchor at the exact place in the test pit was set to replace the drill pipe, reamers and the column that connects the U-shaped hinge ring and string. All of them have been dragged in the casing with a fixed constraint. Then, we connect the pipeline with the completely fixed earth anchor through the U-shaped hinge ring. Meanwhile, the horizontal position of the gondola and the lifting height should be controlled. The diagram of the simplified initial step is shown in Fig. 13. The last, we calculate the lifting operations model and record the corresponding pipeline stress values of each steps at different location.
Fig. 13The diagram of simplified initial state
4.2. The setting of the test instruments and the test site
(1) Selection of the test pipeline.
The seamless steel tubes were selected as the test pipeline to save test costs. Its specifications is Ø219×3.2, material is 20Cr, yield strength is no less than 540 MPa, elastic modulus is about 195 GPa and density is about 7.8 t/m3.
(2) Gondola.
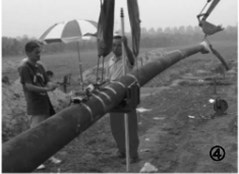
The test gondolas were designed as shown in Fig. 14, which were based on real engineering in the pipeline pullback process, and its diameter is equal to the test pipeline diameter. The gondola was linked up with the crane machine through steel wires. Its size is 250 mm×200 mm×180 mm. It is suspended by the crane machine, and used to lift the pipeline.
(3) The coupling of earth anchor and U-shaped hinge ring.
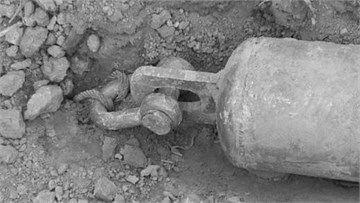
The two ∅219×3.2 pipelines were tied together, and buried in the depth of 5 meter in soil. And then connect them with the U-shaped hinge ring which had been welded on the pipeline end by a short steel wire. The structure is shown in Fig. 15.
(4) Laying caterpillar.
To save test costs, excavators were used to operate the vertical lifting operations of gondola in the test.
(5) Test pits settings.
The excavator was used to excavate a test pit at the head of the pipeline. The test pit could make the difference height between the entry point of the pipe casing and the sending pipe rack group, which couldn’t hinder the pipeline lifting and the deformation process. Meanwhile, a work pit was excavated to make the gondola easily to enter the working position.
Fig. 14The picture of hanging basket
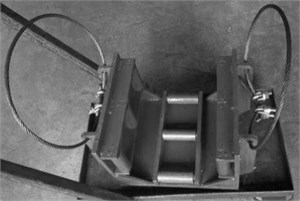
Fig. 15The picture of the connection between pipeline and hinge ring
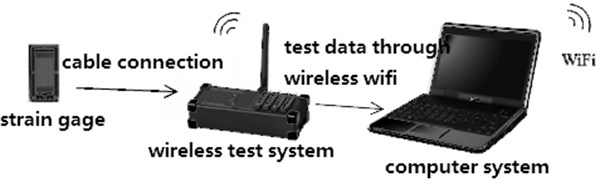
(6) Strain-Stress test system.
In this test, the DH5908G wireless dynamic strain measurement and analysis system has been used to detect the change of pipe stress during the lifting operations. Its system structure is shown in Fig. 16.
Fig. 16The diagram of strain-stress of test system
4.3. Method of the data measurement
(1) Stress testing.
In this test, resistance strain – stress (electrical measuring method) test method is used.
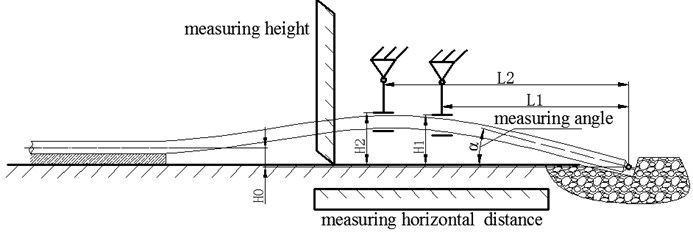
(2) The detection of gondola lifting height and the horizontal position.
As shown in Fig. 17, we select an altitude datum and a horizontal reference to detect the lifting height and horizontal position of the pipeline separately.
Fig. 17The detection of lifting height and horizontal position of pipeline
4.4. Test content
To study the impact of one gondola and two gondolas on the stress of the pipeline respectively, we have done two tests and the results are listed in Table 1.
Table 1The results of pipeline lifting tests
Test content | |||
Test of single hanging basket | Test of two hanging basket | ||
Test group | The location of hanging basket (m) | Test group | The location of hanging basket , (m) |
1 | 14 | 1 | 14, 22 |
2 | 20 | 2 | 20, 32 |
4.5. Comparison of the simulation data and the test date
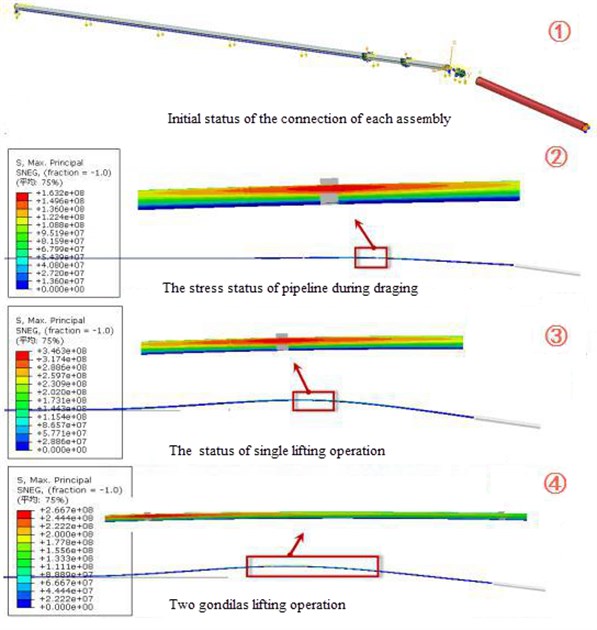
There are two comparisons between simulation date and test date, one is using only one gondola and the other is using two. The stress nephogram of pipeline can be abstained by simulation in lifting process which is shown in Fig. 18, and the mainly experimental process of pipeline lifting is shown in Fig. 19. It is obtained that they have good consistency by comparing the two pictures.
(1) Comparison with single gondola between simulation and experiment:
1) 14 m.
As shown in Fig. 20, the change trend of the simulation date is in agreement with the experimental date, and they increase with the increase of lifting height. And every point of the simulation data is a bit bigger than the experimental data. When the lifting height is about 0.9 m, the maximum stress on the rear of pipeline is 433 MPa which is close to required stress.
Fig. 18The stress nephogram of pipeline in lifting process
As shown in Table 2, the absolute value of error band of simulation and test is 14.5 MPa-38.4 MPa, and the corresponding relative error band is 4.5 %-18.1 %. The average error is 10 %. Thus the simulation data is high credibility, which can truly reflect the change characteristics of pipeline during the lifting operation.
Fig. 19The picture of pipeline lifting process
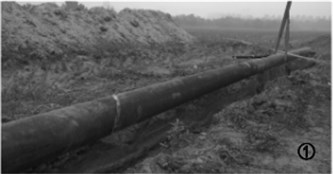
a) Before lifting operation
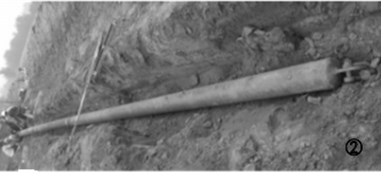
b) Prepare lifting operation
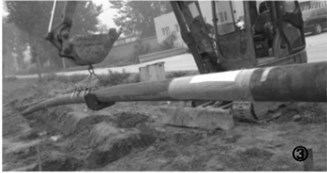
c) Single gondola lifting operation
d) Double gondolas lifting operation
Table 2The error comparison of maximum stress with single gondola between testing data and simulation data when L1= 14 m
Hoisting height (m) | The absolute error value (MPa) | The relative error value (%) | ||||
The location of data collection (m) | ||||||
13.8 | 14 | 14.2 | 13.8 | 14 | 14.2 | |
0.30 | 34.4 | 34.9 | 39.4 | 17.5 | 18.1 | 15.8 |
0.40 | 30.1 | 27.1 | 31.5 | 13.2 | 12.1 | 11.7 |
0.50 | 31.6 | 23.8 | 14.5 | 12.6 | 9.7 | 4.7 |
0.60 | 27.51 | 25.3 | 14.9 | 10.1 | 9.4 | 4.5 |
0.70 | 27.9 | 28.8 | 24.9 | 9.6 | 10.1 | 7 |
0.80 | 30.1 | 28.4 | 18.8 | 9.7 | 9.3 | 4.9 |
0.90 | 20.3 | 24.1 | 24.3 | 5.9 | 7.2 | 5.9 |
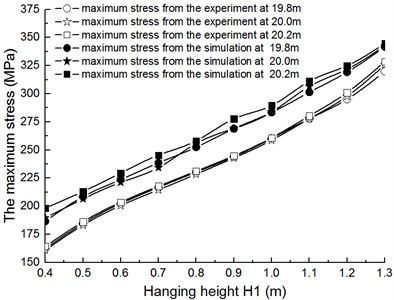
2) 20 m.
As can be seen in Fig. 21, the maximum stress on the pipeline is smaller when 14 m.
As can be seen from Table 3, when is 20 m, the absolute value of the error band of simulation date is 17.1-34.1 MPa, and the corresponding relative error band is 4.9 %-20.8 %. The average value of relative error is 11 %.
Table 3The error comparison of maximum stress with single gondola between testing data and simulation data when L1= 20 m
Hoisting height (m) | The absolute error value (MPa) | The relative error value (%) | ||||
The location of data collection (m) | ||||||
13.8 | 14 | 14.2 | 13.8 | 14 | 14.2 | |
0.40 | 24.2 | 28.8 | 34.1 | 14.9 | 17.9 | 20.8 |
0.50 | 23.8 | 23.3 | 26.9 | 12.9 | 12.7 | 14.4 |
0.60 | 21.3 | 20.6 | 25.8 | 10.5 | 10.3 | 12.7 |
0.70 | 21.9 | 19.7 | 27.6 | 10.1 | 9.2 | 12.7 |
0.80 | 22.1 | 27.3 | 26.9 | 9.5 | 11.9 | 11.6 |
0.90 | 24.9 | 26.2 | 32.8 | 10.2 | 10.8 | 13.4 |
1 | 23.1 | 25.1 | 28.7 | 8.9 | 9.7 | 11 |
1.1 | 23.5 | 28.7 | 30.8 | 8.5 | 10.3 | 10.9 |
1.2 | 24.1 | 24.1 | 23.8 | 8.2 | 8.1 | 7.9 |
1.3 | 21.8 | 17.1 | 16.2 | 6.8 | 5.2 | 4.9 |
Fig. 20The comparison of maximum stress with single gondola between testing data and simulation data when L1= 14 m
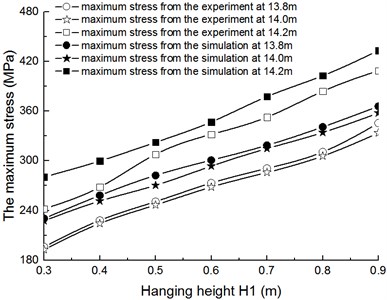
Fig. 21The comparison of maximum stress with single gondola between testing data and simulation data when L1= 20 m
(2) Comparison with two gondolas between simulation and experiment.
To save the cost and time, we just need to continue to test after the single gondola test at every point, and then record the variation of results.
1) 14 m, 22 m.
It can be seen in Fig. 22 that the pipeline stress at the point where is 22 m is gradually increasing with the increment of . However, the pipeline stress at the point where is 14 m will be gradually descending with the increment of .
Table 4The error comparison of maximum stress with two gondolas between testing data and simulation data when L1= 14 m, L2= 22 m
Hoisting height (m) | The error of the measurement point | |||||
The absolute error value (MPa) | The relative error value (%) | |||||
The location of data collection (m) | ||||||
13.8 | 14 | 14.2 | 13.8 | 14 | 14.2 | |
0.9 / 1 | 28.3 | 31 | 36.5 | 37.4 | 11.4 | 10.9 |
0.9 / 1.1 | 30.7 | 32.6 | 36.8 | 38.2 | 14.5 | 13.4 |
0.9 / 1.2 | 29 | 33.8 | 36.7 | 35.3 | 16.1 | 16.6 |
0.9 / 1.3 | 24.4 | 35.6 | 36.5 | 38.4 | 15.7 | 22.5 |
It can be seen in Table 4 that when is 14 m and is 22 m, the absolute value of the error band of simulation date is 24.4-38.4 MPa, and the corresponding relative error band is 11.4 %-24.4 %. The average error is 17.3 %.
2) 20 m, 32 m.
It is shown in Fig. 23 that the stress distribution trend of testing group on the pipeline is similar with that of the simulation group when 14 m and 22 m. Absolutely, the maximum stress of testing group is smaller than the stress of simulation group.
It can be seen from Table 5 that the absolute value of the error band of simulation date is 18.2-34.6 MPa, and the corresponding relative error band is 11.6 %-25.2 %. The average error is 18.6 %.
(3) Nonlinear dynamics analysis of pipeline lifting.
To obtain the change law of the pipeline stress with the lifting time, it is studied that pipeline lifting nonlinear dynamics analysis in this paper by using validated calculation model. There are two stress extraction points of the simulation model which are consistent with the position of the gondolas. Their numbers are 1715 and 1787. This calculation model assumes the lifting velocity is constant. As shown in Fig. 24, the pipeline stress increases with the first gondola is lifted, but it recedes considerably when the second gondola is lifted. Fig. 24(a) shows that the optimum point is (77.4, 234.3), which means the maximum stress of pipeline is 234.3 MPa. Meanwhile, the corresponding lifting height: 0.9 m, 1.13 m. Fig. 24(b) shows that the optimum point is (77.4, 263.5), and the corresponding lifting height: 1.3 m, 1.51 m.
Fig. 22The comparison of maximum stress with two gondolas between testing data and simulation data when L1= 14 m, L2= 22 m
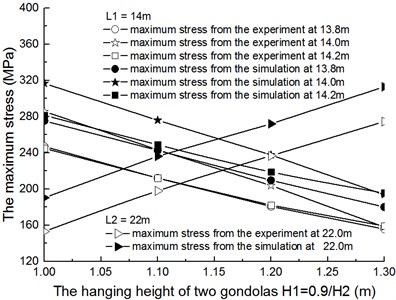
Fig. 23The comparison of maximum stress with two gondolas between testing data and simulation data when L1= 20 m, L2= 32 m
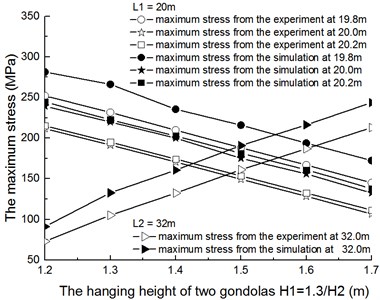
Table 5The error comparison of maximum stress with two gondolas between testing data and simulation data when L1= 20 m, L2= 32 m
Hoisting height (m) | The error of the measurement point | |||||||
The absolute error value (MPa) | The relative error value (%) | |||||||
The location of data collection (m) | ||||||||
19.8 | 20 | 20.2 | 32 | 19.8 | 20 | 20.2 | 32 | |
1.3 / 1.2 | 29.3 | 27.6 | 29.6 | 18.2 | 11.6 | 13 | 13.8 | 24.9 |
1.3 / 1.3 | 34.6 | 28.3 | 27.6 | 27.6 | 14.9 | 14.8 | 14.1 | 25.2 |
1.3 / 1.4 | 25.7 | 29.4 | 28.3 | 28.3 | 17.2 | 17.2 | 16.2 | 21.3 |
1.3 / 1.5 | 27.8 | 25.9 | 27.9 | 29.8 | 17.3 | 17.3 | 18.2 | 18.5 |
1.3 / 16 | 26.9 | 27.5 | 28.4 | 29.4 | 21.4 | 21.4 | 21.4 | 15.7 |
1.3 / 1.7 | 27.4 | 25.9 | 26.3 | 30.8 | 24.3 | 23.6 | 23.6 | 14.5 |
Fig. 24The stress of pipeline with lifting time
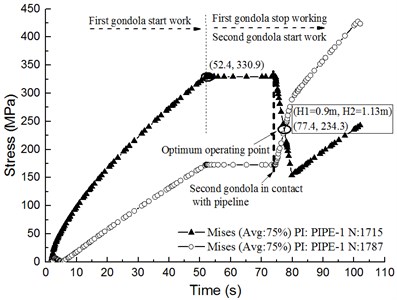
a) 14 m, 22 m
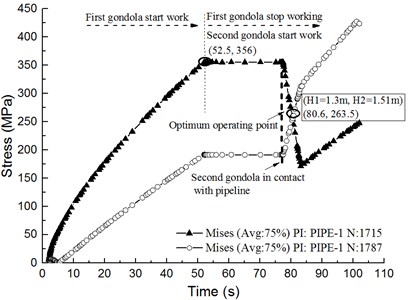
b) 20 m, 32 m
5. Conclusions
We have established a finite element calculating model by theoretical analysis of the lifting process and have obtained the following conclusions:
(1) The analysis shows that the simulation results have good consistency with test results. Thus, the finite element model is credible, and can reflect the variety law of the pipeline stress during the lifting operation.
(2) The stress of the pipeline increases with the increase of hanging height, while it will gradually descend with the increment of horizontal lifting distance. In order to keep the pipeline angle in a certain range, the hanging height will increase due to the increase of the horizontal lifting distance, which may cause the pipeline stress increase. Consequently, the pipeline stress will be lower during the lifting process if the horizontal lifting distance is good.
(3) Compared with one gondola, construction using two gondolas can reduce the stress concentration. Thus, multi-gondola construction method is more suitable for the lifting project of large penetration angle and large diameter pipeline.
(4) Every horizontal lifting distance has a corresponding set of optimal hanging heights to ensure the angle is 0 degree and the pipeline stress is lower. By analyzing the nonlinear dynamics model of the lifting process, it is gained that the lifting heights: 0.9 m, 1.13 m when the horizontal lifting distance: 14 m, 22 m; the lifting heights: 1.3 m, 1.51 m when the horizontal lifting distance: 20 m, 32 m.
References
-
Ghokale S., Hamm R., Sterling R. A comprehensive survey on the state of horizontal directional drilling in North America provides an inside look at this increasingly growing industry. Direct Drilling, Vol. 7, 1999, p. 20-23.
-
Khan S., Bennett D., McCrary S., Iseley T. Mini-Horizontal Directional Drilling: State-of-the-Art Review. Trenchless Technology Center at Louisiana Tech University, Ruston, Louisiana, 1994.
-
Kirby M. J., Kramer S. R. Design guidelines and procedures for guided horizontal drilling, Part II. No-Dig Engineering, 1996, p. 13-15.
-
Technical Note: Horizontal Directional Drilling (Guided Boring) with PLEXCO Pipe. Chevron Chemical Co., LLC, 1999.
-
Conroy P. J., Latorre C. A., Wakeley L. D. Installation of Fiber Optic Cables under Flood-Protection Structures Using Horizontal Directional Drilling Techniques. Geotechnical and Structures Laboratory, US Army Corps of Engineers, ERDC/GSL TR-02-8, 2002.
-
Latorre C. A., Wakeley L. D., Conroy P. J. Guidelines for Installation of Utilities Beneath Corps of Engineers Levees Using Horizontal Directional Drilling. Geotechnical and Structures Laboratory, US Army Corps of Engineers, 2002.
-
Wang X., Sterling R. L. Stability analysis of a borehole wall during horizontal directional drilling. Tunneling and Underground Space Technology, Vol. 22, 2007, p. 620-632.
-
Shen Ping, Wu Yunlin Construction technology of crushed clay layer through the large diameter pipeline horizontal directional drilling. Science and Technology Information, 2013, p. 51-52.
-
Yang C. J., Zhu W. D., Zhang W. H., Zhu X. H., Ren G. X. Determination of pipe pullback loads in horizontal directional drilling using an advanced computational dynamic model. Journal of Engineering Mechanics, Vol. 140, Issue 8, 2014, p. 1759-1774.
-
Polak Maria Anna, Duyvestyn Glenn, Knighta Mark Testal strain analysis for polyethylene pipes installed by horizontal directional drilling. Tunneling and Underground Space Technology, Vol. 19, 2004, p. 205-216.
-
Chehab A. G., Moore I. D. Analysis for long-term response of pipes installed using horizontal directional drilling. Journal of Geotechnical and Geoenvironmental Engineering, Vol. 138, Issue 4, 2012, p. 432-440.
-
Liu Bin, Chen Lin The construction methods and technical measures across the Karun River directional drilling. China Petroleum and Chemical Standard and Quality, 2012, (in Chinese).
-
He Chenguang The exploration of reactive power compensation technique for 10kV distribution line. Friend of Science Amateurs, Vol. 11, 2012, p. 31-32, (in Chinese).
-
Chui Dongming Horizontal Directional Drilling Reamer Design Method and New Product Design. Chengdu University of Technology, Chengdu, 2011, (in Chinese).
-
An JinLong Technology Research of Oil and Gas Pipeline Through the Drilling of Horizontal Directional. Huazhong University of Science and Technology, Wu Han, 2004, (in Chinese).
-
Xie Yanqiu Research of Static and Dynamic Characters of the Mechanical System of Horizontal Directional Driller. Southeast University, Nanjing, 2009, (in Chinese).
-
Jiang Wei Research on Tracking Guide Instrument System of Horizontal Directional Drilling. Southeast University, Nanjing, 2009, (in Chinese).
-
He Yong Analysis of Sand Through the Horizontal Directional Drilling Technology. Urban Construction Theory Research (Electronic Version), 2013, (in Chinese).
-
Xu Tao Research on MWD Surveying Method and Locating Technique of Horizontal Direction Drilling. National University of Defense Technology, Changsha, 2006, (in Chinese).
-
Ariaratnam S. T., Lueke J. S. Post construction evaluation of the annular space region in horizontal directional drilling. Proceedings of NASTT No-Dig 2002 Conference, Montreal, Quebec, North American Society for Trenchless Technology, Arlington, VA, 2002.
-
Liu Changzhi Research on the inspection and analysis technology of pipeline anticorrosion layer. China Petroleum and Chemical Standard and Quality, Vol. 12, 2013, p. 14-14, (in Chinese).
-
Huey D. P., Hair J. D., McLeod K. B. Installation loading and stress analysis involved with pipelines installed in horizontal directional drilling. No-Dig, New Orleans, USA, 1996, p. 37-60.
-
Baumert M. E. Allouche E. N. Installation loads on pipelines installed using HDD. CSCE Conference, London, Ontario, 2000.
-
Polak Maria Anna, Lasheen Afdal Mechanical modelling for pipes in horizontal directional drilling. Tunneling and Underground Space Technology, Vol. 16, Issue 16, 2001, p. 47-55.
-
Cui Yue Analysis of the Mechanics and Program Designing for Lifting Pipes in the Extreme Shallow Water. Tianjin University, Tianjin, 2007, (in Chinese).
-
Chen Yuji To determine the natural frequency of square plates with the reciprocal theorem of work. Mechanics and Engineering, Vol. 25, Issue 1, 2003, p. 26-28, (in Chinese).
-
Xing Jingzhong, Liu Chuntu, Zeng Xiaohua Analysis of multi-point lifting of pipelines based on the interpolation function. Mechanics and Engineering, Vol. 25, Issue 1, 2003, p. 28-30, (in Chinese).
-
Qiao Fajin Development for the Strength Analysis Program of Submarine Pipeline Lifting. Tianjin University, Tianjin, 2010, (in Chinese).
-
Li Jingfeng Force Analysis and Application of Lifting Pipeline in Engineering. North China Petroleum Design, 1995, p. 1-4, (in Chinese).
-
Qin Shilun Mechanics of Materials. Sichuan University Press, 2011, (in Chinese).
-
Wang Linfeng The Study on Effect of Plastic Deformation on Strength Character Index of Pipeline Steel. Yanshan University, Qinhuangdao, 2011, (in Chinese).
About this article

The authors gratefully acknowledge financial support from China Petroleum and Natural Gas Group Co., Ltd. “Twelfth Five Year” Scientific and Technological Projects (2011B-3303) and Post-Graduate Innovation Fund of Southwest Petroleum University (CX2014BY01).
Biwei Fu designed and performed the experiments, analyzed the data, wrote the paper, drew the figures and curves, checked the language, experimental and theoretical analysis results in the manuscript. Zhijiu Ai conceived and designed the experiments and checked experimental results. Xu Liu performed the experiments, checked the language and theoretical analysis results. Shuang Wang drew the figures and curves, checked theoretical analysis results. Hao Qin and Chen Rui checked the language.
