Abstract
The random friction distribution is an objective phenomenon and always leads to great uncertainty in seismic responses of damper-friction isolation systems. As to optimize the seismic performance, this paper artificially made the friction distribution on a contact surface to be concave. When the damper-friction isolation system was subjected to different ground motions, more regular responses, due to the concave friction distribution, were obtained comparing with the responses of the random friction distribution. The concave friction distribution is always conducive to reducing the structural relative displacement and insignificantly increasing the structural acceleration. An optimization design example of an isolation building was carried out. And the results showed that as for a structure only being sensitive to acceleration or force, significant concave friction distribution and little damping constant would be the best design combination. It resulted in a much less acceleration and an acceptable relative displacement on the structure.
1. Introduction
In an effort to improve the isolation performance, researchers around the world have proposed a new type isolation mechanism, which is called friction-based isolation method. Harvey and Gavin built a mathematical model for a double rolling isolation system (RIS), and carried out an experimental validation in 2014 [1]. The effects of the initial conditions, the mass of the isolated object, and the amplitude of the disturbance on the system’s performance were assessed. And then, a simplified model presented in their paper [2] was applied to RISs with any potential energy function. This model was amenable to both lightly- and heavily-damped RISs. It was also validated through the successful prediction of peak responses for a wide range of disturbance frequencies and intensities. Ismail and Casas investigated the near-fault (NF) seismic performance of a novel isolation system referred to as the roll-n-cage (RNC) isolator in 2014 [3-4]. By considering the cable-stayed Bill Emerson Memorial Bridge in Missouri as an isolation structure, the results showed that the RNC isolator was a convenient isolation system in protecting cable-stayed bridges against NF earthquakes. Wang, Hwang, et al, studied the sloped multi-roller isolation devices for seismic protection of equipments and facilities, and obtained an excellent in-plane seismic isolation performance in 2014 [5]. Jangid and Londhe analytically studied seismic response of a multistory building supported by elliptical rolling rods in 1998 [6], and the results indicate that the rolling-based isolation mechanism is quite effective in reducing the seismic demand of the system, such as base displacement. In 2000, Jangid investigated the stochastic response of flexible multistory shear type buildings isolated by rolling rods with a re-centering device under earthquake excitations, and the numerical results indicate that the rolling rod has potential to reduce the stochastic response of the structure [7]. In 2010, Ou et al. and Lee et al. numerically studied the seismic response of highway bridges which were installed with a rolling isolation device [8-9]. This isolation device with zero post-yield stiffness has self-centering and energy dissipation capability which is contributed by friction force. Parametric studies on these bridge structures suggest an improvement of the calculation method proposed in AASHTO Specifications. In 2007, Guerreiro et al. experimentally investigated the seismic performance of light structures supported by a rolling-ball isolation device and subsequently conducted numerical modeling of this system, and the experimental results and the numerical analysis uniformly show a reduced acceleration demand imposed on the isolated structures [10]. In 2011, Kurita et al. developed a new spherical shape friction bearing device which is able to reduce the peak acceleration of the isolated system by about 50-90% [11]. In 2012, Monfared et al. investigated the seismic performance of 5-story structures with and without base isolators, and the results indicate that the effectiveness of a base-isolated system is dependent on the characteristics of the input excitations as well as the properties of the isolation devices and the superstructure [12].
Although the friction-based device avoids seismic damages caused in structure, the induced displacement is usually large and difficult to control. In this regard, the spring device needs to be incorporated to the pure-friction isolation system in order to reduce the relative and residual displacement. However, once the stiffness of the spring device is mismanaged and the actual earthquake differs from the design earthquake, the isolation structure generates obvious vibration periods. And thus the seismic damage still appears in the isolation structure and even sympathetic vibration may happen [13-14]. Therefore, it is quite a question whether the restoring device can be replaced with other devices or not. Although general dampers can effectively reduce the structural relative displacement without producing any natural vibration period, how to combine the damper and the friction device to obtain an optimized isolation performance needs further investigation. And the previous researches and applications assumed the friction coefficient as a fixed value to simplify the calculation process, i.e. the distribution of friction coefficient on the whole contact surface was absolutely uniform, which was opposite to the reality [15]. In 2015, Wei’s research showed that there was different variability for the friction coefficient on the contact surface according to its current construction level [16]. The uneven distribution of friction coefficient leaded to great uncertainty in the structural seismic responses [17].
Based on all of the researches above, one of the urgent problems is how to use the uneven friction distribution to improve the isolation performance. This paper artificially interferes the friction distribution to be concave, i.e. the friction coefficient is the smallest in the center of the seismic isolation device and gradually increases along the around path. A damper is added to a contact surface with this concave friction distribution to form a damper-friction isolation system. The object of this paper is to utilize a numerical analysis to analyze the impact of the concave friction distribution on the seismic performance of the damper-friction isolation system under different ground motions. By using the obtained regular rules, an optimization design example of an isolation building is carried out, and optimal parameters are identified.
2. Calculation process
2.1. Structure model
A damper-friction isolation system is shown in Fig. 1. The contact surface with friction action isolates the horizontal earthquake besides supporting the structure. Simultaneously, the friction action dissipates the earthquake energy and transmits the friction force to the main structure. For the concave friction distribution, the friction coefficient is the smallest in the center of the isolation device, which is assumed to be 0.005. It gradually increases when the relative displacement between the structure and the ground becomes larger, and the increment ratios are assumed to be 0, 0.005, 0.010, 0.015, 0.020, 0.025 and 0.030, respectively, in this paper.
The damper impedes the excessive relative velocity, dissipates the earthquake energy and reduces the structural relative displacement. Meanwhile, the damper transmits the damping force to the main structure as well. In this paper, the damping constants adopt 100, 200, 300, 400 and 500 kN·s/m, respectively.
As demonstrated in the related studies [16], the isolated structure can be built as a rigid body since the stiffness of the isolation device is far less than that of the structure. So in this paper, the superstructure is temporarily simplified to a rigid body, and its mass is set to be 300 t.
2.2. Earthquake input
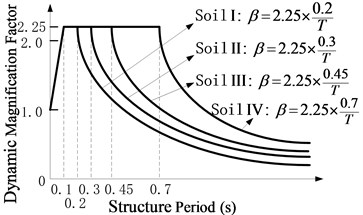
As shown in Fig. 2, for each elastic response spectrum for the soil profile I, II, III, and IV in Chinese criteria (JTJ 004-89) [18], one accelerogram is generated by Simqke procedure to be the ground motion input of the structural model [19].
Fig. 1A damper-friction isolation system
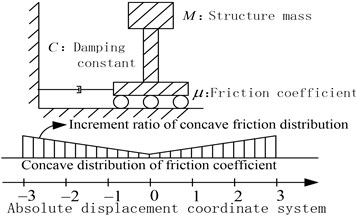
Fig. 2Earthquake input
2.3. Calculation cases
35 cases are obtained by combining 5 damping constants and 7 concave distribution cases of friction coefficient. As for each case, each accelerogram in Section 2.2 is input as the ground motion input, whose peak ground accelerations (PGA) are adjusted to be 0.2, 0.4, 0.6 and 0.8 g, respectively. Thus, 560 cases are generated for the further calculation.
The author himself compiled a computer program to calculate the isolation system [16]. A great many of seismic responses are obtained for 560 calculation cases above. The following sections discuss those results, but only classical and common results are discussed in detailed manner due to space limitations while other results are considered but not listed.
3. Structural maximum relative displacement
3.1. The effect of the friction coefficient
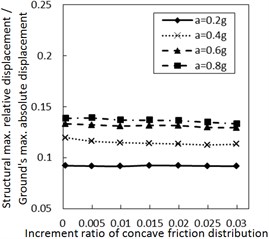
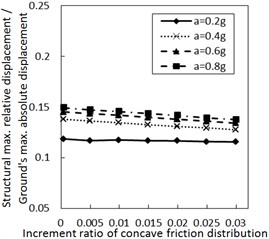
Fig. 3 shows the effect of the increment ratio of concave friction distribution on the structural maximum relative displacement. Generally, as the increment ratio of concave friction distribution increases, the structural maximum relative displacement gradually decreases. This decreasing trend is more significant when PGA is larger and the damping constant is less. As the site type of soil profile is larger, the decreasing trend gradually fluctuates. For the soil profile IV with a relatively small damping constant, this fluctuation is significant as the increment ratio of concave friction distribution increases to a certain value. However, as the damping constant increases to a certain value for the same calculation case, the fluctuation disappears.
As for the cases of the concave friction distribution in Fig. 1, when , the friction force promotes the structure a forward acceleration component . There are two possible cases:
1) If the moving structure is on the left of its origin position, it means that the friction coefficient on the contact surface is increasing, and the increment of the structural acceleration is conducive to reducing the structural relative displacement.
2) If the moving structure is on the right of its origin position, it means that the friction coefficient on the contact surface is decreasing, and the reduction of the structural acceleration is also conducive to reducing the structural relative displacement.
There are similar rules in the case of .
Therefore, the concave friction distribution is always conducive to reducing the structural relative displacement. A larger increment ratio of concave friction distribution implies a smaller structural maximum relative displacement, and the results in Fig. 3 are reasonable.
As the increment ratio of concave friction distribution is relatively large, the periodic components appear for the isolation system since the isolation layer is not easy to slide. In this case, as the site type of soil profile increases to a certain value, the long-period components of the corresponding seismic waves will take up more proportion. The above two factors lead to a local resonance phenomenon and a sudden increment of the structural relative displacement. However, with the further sliding of the isolation layer, this local resonance phenomenon rapidly disappears, and the structural maximum relative displacement is still a limited value.
Fig. 3Effect of the increment ratio of concave friction distribution on the structural maximum relative displacement
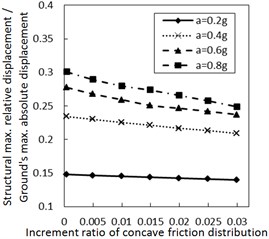
a) Soil profile I with the damping constant 100 kN·s/m
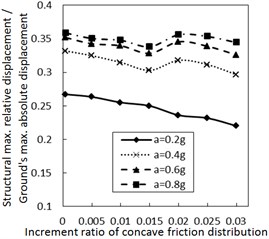
b) Soil profile IV with the damping constant 100 kN·s/m
c) Soil profile I with the damping constant 500 kN·s/m
d) Soil profile IV with the damping constant 500 kN·s/m
3.2. The effect of the damping constant
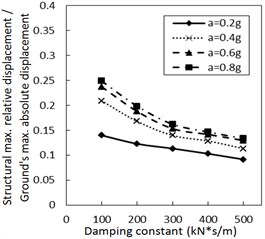
As the damper limits the structural relative velocity, it is able to reduce the structural relative displacement. This theory is validated by Fig. 4. In Fig. 4, as the damping constant increases, the structural maximum relative displacement gradually decreases. This decreasing trend is more significant when PGA and the site type of soil profile are larger, especially for calculation cases with the less increment ratio of concave friction distribution.
3.3. The effect of different ground motions
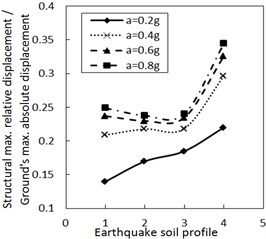
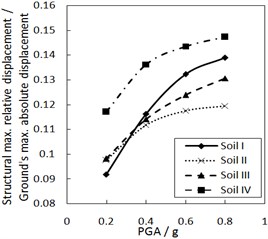
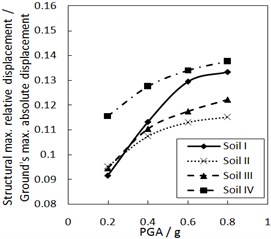
Fig. 5 shows the effect of the site type of soil profile on the structural maximum relative displacement. Generally, as the site type of soil profile is larger, the structural maximum relative displacement firstly decreases and then increases. This variation trend is more significant when PGA is larger, especially for calculation cases with the larger damping constant and the larger increment ratio of concave friction distribution.
Fig. 4Effect of the damping constant on the structural maximum relative displacement
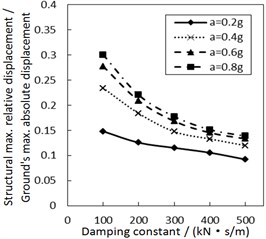
a) Soil profile I with the increment ratio 0 of concave friction distribution
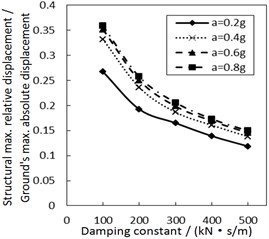
b) Soil profile IV with the increment ratio 0 of concave friction distribution
c) Soil profile I with the increment ratio 0.03 of concave friction distribution
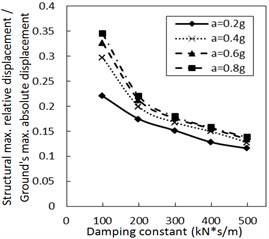
d) Soil profile IV with the increment ratio 0.03 of concave friction distribution
Fig. 5Effect of the soil profile on the structural maximum relative displacement
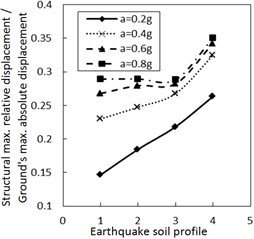
a) The increment ratio of concave friction distribution is 0.005 and the damping constant is 100 kN·s/m
b) The increment ratio of concave friction distribution is 0.03 and the damping constant is 100 kN·s/m
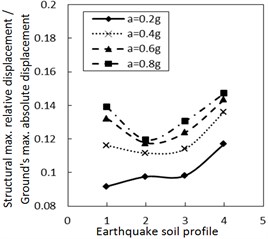
c) The increment ratio of concave friction distribution is 0.005 and the damping constant is 500 kN·s/m
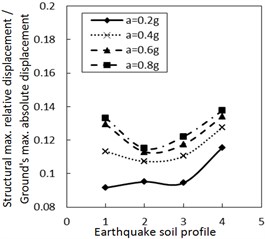
d) The increment ratio of concave friction distribution is 0.03 and the damping constant is 500 kN·s/m
As for the same PGA, a larger site type of soil profile means a larger absolute displacement of the ground motion while the structural acceleration is a limited value. Therefore, a larger site type of soil profile means a larger structural maximum relative displacement. Because both the concave friction distribution and the damper are conducive to reducing the structural relative displacement, the increment of the site type of soil profile will not significantly increase the structural relative displacement. Especially when the increment ratio of the concave friction distribution, the damping constant and the PGA are all large, as the site type of soil profile increases, the absolute displacement of the ground motion grows faster than the relative displacement of the structure. In this occasion, the ratio of the structural maximum relative displacement to the absolute displacement of the ground motion decreases.
However, as the site type of soil profile increases to a certain value, a local resonance phenomenon exists, which results in a sudden increment of the structural relative displacement as shown in Fig. 5. This phenomenon is weakened by increasing the damping constant.
Fig. 6Effect of the PGA on the structural maximum relative displacement
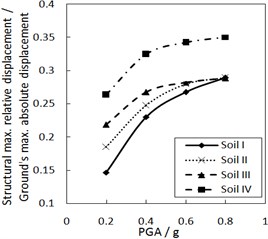
a) The increment ratio of concave friction distribution is 0.005 and the damping constant is 100kN·s/m
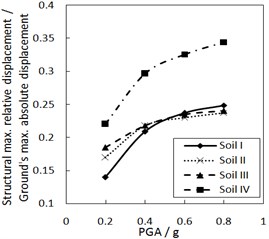
b) The increment ratio of concave friction distribution is 0.03 and the damping constant is 100 kN·s/m
c) The increment ratio of concave friction distribution is 0.005 and the damping constant is 500 kN·s/m
d) The increment ratio of concave friction distribution is 0.03 and the damping constant is 500 kN·s/m
Fig. 6 shows the effect of PGA on the structural maximum relative displacement. As PGA increases, the structural maximum relative displacement gradually increases. However, the growth rate is less when PGA is larger, especially for calculation cases with the larger increment ratio of concave friction distribution.
As for the same site type of soil profile, a larger PGA means a larger absolute displacement of the ground motion, while the structural acceleration is a limited value. And thus, a larger PGA means a larger structural maximum relative displacement. Because the concave friction distribution is conducive to reducing the structural relative displacement, the increment of PGA will not significantly increase the structural relative displacement forever.
4. Structural maximum acceleration
4.1. The effect of the friction coefficient
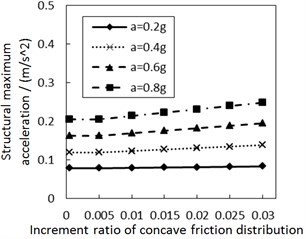
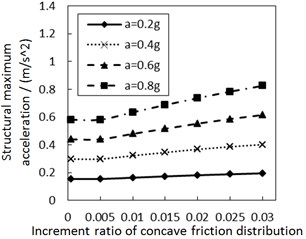
Fig. 7 shows the influence of the increment ratio of concave friction distribution on the structural maximum acceleration. As the increment ratio of concave friction distribution increases, the structural maximum acceleration gradually increases. This increasing trend is more significant when PGA and the site type of soil profile are larger, especially for calculation cases with the less damping constant. However, this increasing trend is not very obvious for almost all of the calculation cases.
Fig. 7Effect of the increment ratio of concave friction distribution on the structural maximum acceleration
a) Soil profile I with the damping constant 100 kN·s/m
b) Soil profile IV with the damping constant 100 kN·s/m
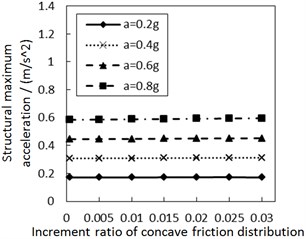
c) Soil profile I with the damping constant 500 kN·s/m
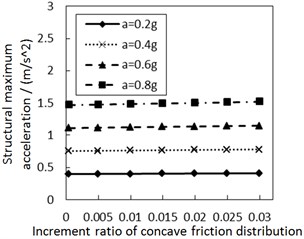
d) Soil profile IV with the damping constant 500 kN·s/m
In theory, since the structure is built as a rigid body, the value of the structural maximum acceleration is related to that of the structural maximum external force acting on the structure. As for the isolation system in Fig. 1, the external force is the combination force of the damping force and the friction force, where the damping force is a variable related to the structural relative velocity and the friction force is . A larger earthquake triggers a larger structural relative velocity and a larger damping force. Hence, a new acceleration value generated by the damping force is added for all structural maximum accelerations on the basis of the acceleration caused by the friction force.
As for the concave distribution of friction coefficient, due to the fact that the friction coefficient is changeable at any position of the contact surface, the value of the structural maximum acceleration depends on the structural maximum relative displacement. When PGA and the site type of soil profile are larger, especially for calculation cases with a less damping constant, the induced larger structural maximum relative displacement means that the structure moves further away from the origin position. Therefore, the friction coefficient at the corresponding position is larger, and the structural maximum acceleration is larger, too. Under other unchangeable conditions, a larger increment ratio of concave friction distribution means a larger friction coefficient at the corresponding position after the relative movement, so the structural maximum acceleration is subsequently larger.
However, the discussion in Section 3.1 indicates that the concave friction distribution is always conducive to reducing the structural relative displacement. And thus the increasing trend of the structural maximum acceleration in Fig. 7 is not very obvious.
Under the same condition, a larger damping constant means that the acceleration generated by the damping force makes up a larger proportion of all accelerations. At this moment, the variability of concave friction distribution has a less impact on the structural maximum acceleration.
Fig. 8Effect of the damping constant on the structural maximum acceleration
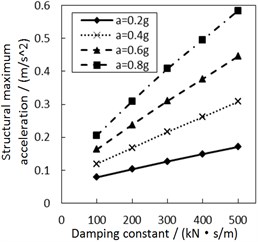
a) Soil profile I with the increment ratio 0 of concave friction distribution
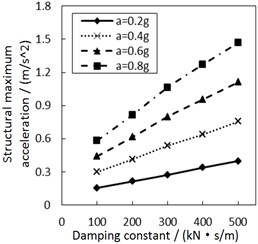
b) Soil profile IV with the increment ratio 0 of concave friction distribution
c) Soil profile I with the increment ratio 0.03 of concave friction distribution
d) Soil profile IV with the increment ratio 0.03 of concave friction distribution
4.2. The effect of the damping constant
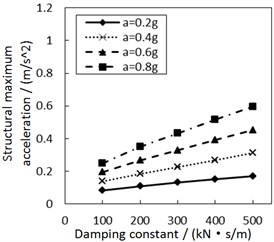
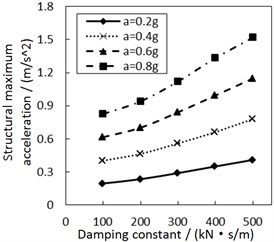
Fig. 8 shows the effect of the damping constant on the structural maximum acceleration. As the damping constant increases, the structural maximum acceleration gradually increases. This increasing trend is more significant when PGA and the site type of soil profile are larger, especially for calculation cases with the less increment ratio of concave friction distribution.
In theory, with regard to the general isolation structures, e.g. lead rubber bearing, as the structural period is close to the seismic predominant period, increasing the damping constant of the isolation layer reduces the structural acceleration. However, as the structural period is much larger than the seismic predominant period, increasing the damping constant of isolation layer promotes a larger structural acceleration. The damper-friction isolation system doesn’t have a fixed structural period, so it is approximately considered that the structural period is much larger than the seismic predominant period. And just as logically illustrated in Fig. 8, increasing the damping constant of the isolation layer eventually increases the structural acceleration. Besides, a larger increment ratio of concave friction distribution means a larger acceleration generated by the friction force. At this moment, the variability of the damping constant has a less impact on the structural maximum acceleration.
4.3. The effect of different ground motions
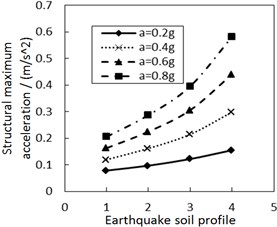
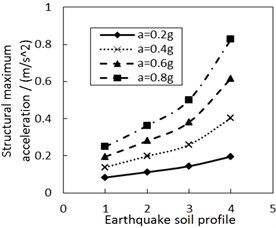
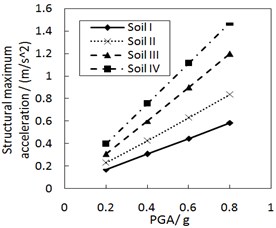
Fig. 9 shows the effect of the site type of soil profile on the structural maximum acceleration. As the site type of soil profile increases, the structural maximum acceleration gradually increases. This increasing trend is more significant when PGA is larger, especially for calculation cases with the less damping constant and the larger increment ratio of concave friction distribution.
Fig. 10 shows the effect of PGA on the structural maximum acceleration. The structural maximum acceleration gradually increases with PGA. This increasing trend is more significant when the site type of soil profile is larger, especially for calculation cases with the larger increment ratio of concave friction distribution.
When other parameters are unchanged, a larger site type of soil profile or PGA means a larger structural relative displacement and a larger friction coefficient at the corresponding position. And thus the acceleration generated by the friction force is subsequently larger. Likewise, a larger site type of soil profile or PGA also means a larger structural relative velocity and a larger acceleration generated by the damping force. Eventually, the structural maximum acceleration is subsequently larger.
Fig. 9Effect of the site type of soil profile on the structural maximum acceleration
a) The increment ratio of concave friction distribution is 0.005 and the damping constant is 100 kN·s/m
b) The increment ratio of concave friction distribution is 0.03 and the damping constant is 100kN·s/m
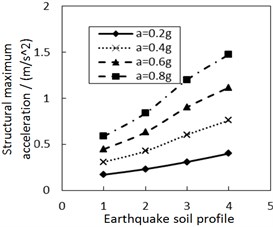
c) The increment ratio of concave friction distribution is 0.005 and the damping constant is 500 kN·s/m
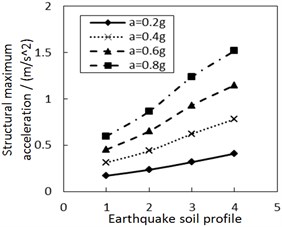
d) The increment ratio of concave friction distribution is 0.03 and the damping constant is 500 kN·s/m
5. Optimal parameters identification for a particular application
5.1. Structure introduction
There is a building structure with mass of about 300 t containing precious equipments and museum pieces of art which are sensitive to ground motion. The design project of the main structure is shown in Fig. 11. As the building has to be built in a severe earthquake zone with soil profile III as shown in Fig. 2, it is designed with the very strong foundation, columns and beams to resist the future earthquake. However, even the small acceleration of 0.7 m/s2 on the sensitive articles in the building will slightly damage them. And thus the government provides a design principle that less than 30 % probability of exceeding 0.5 m/s2 on the structure even under the earthquake with PGA of 0.8 g is acceptable, and the considerably large relative displacement is allowed since it doesn’t directly damage the structure.
Fig. 10Effect of the PGA on the structural maximum acceleration
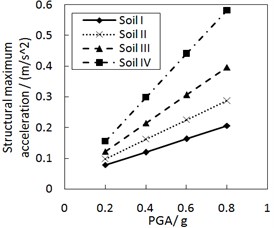
a) The increment ratio of concave friction distribution is 0.005 and the damping constant is 100 kN·s/m
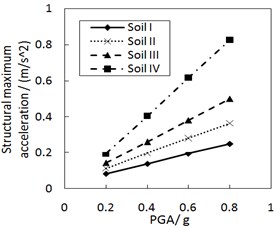
b) The increment ratio of concave friction distribution is 0.03 and the damping constant is 100 kN·s/m
c) The increment ratio of concave friction distribution is 0.005 and the damping constant is 500 kN·s/m
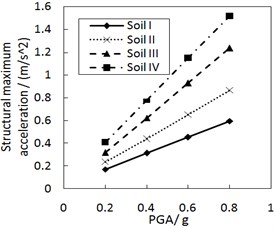
d) The increment ratio of concave friction distribution is 0.03 and the damping constant is 500 kN·s/m
Therefore, a damper-friction isolation project with concave friction distribution similar to that in Fig. 1 is designed for the building structure. Based on the foregoing analysis, the friction coefficient in the center of the concave friction distribution is 0.005. The according optimal increment ratio can adopt 0.03 to decrease the structural relative displacement, and it will not significantly increase the structural acceleration. The damping constants can adopt 100, 200, 300, 400 and 500 kN·s/m, respectively, to decrease the structural relative displacement, however, it will increase the structural acceleration response. And thus an optimal value of the damping constant needs to be identified. Moreover, a similar and contrastive isolation scheme with the uniform distribution of rolling friction coefficient is also designed for the structure.
For the structure model, the lateral stiffness of the isolation device is much less than that of the structure. In this regard, the isolated structure is assumed as a rigid body in the following analysis. In this study, it is assumed to have a mass of 300 t, which is the typical value for the two-storey building structure.
5.2. Earthquake input
In the building site, the earthquake will be large and very uncertain. Based on the related seismic safety assessment report, however, the probability of PGA exceeding 1g is very small and can be ignored.
Fig. 11A building structure
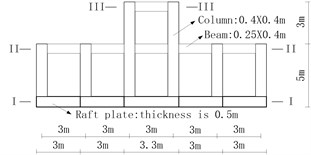
a) Elevation view

b) Section III-III
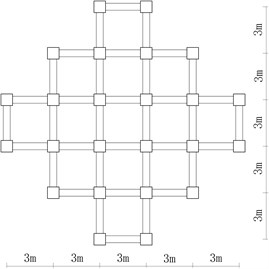
c) Section II-II
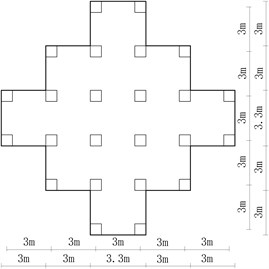
d) Section I-I
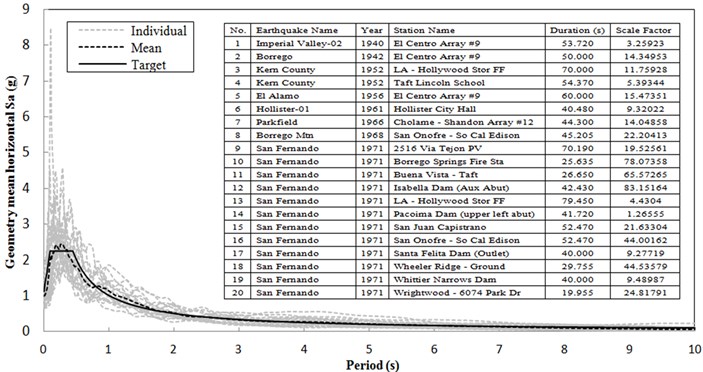
The elastic response spectrum for the soil profile III in Chinese criteria (JTJ 004-89) as shown in Fig. 2 is selected for the target spectrum, because the related seismic safety assessment report shows that the relatively soft soil with shear wave velocity between 140 and 250 m/s is very thick for the building site. Twenty pairs of ground motion recordings were selected from the Pacific Earthquake Engineering Research Center database (PEER, 2015), as listed in Fig. 12, and scaled to be consistent with the target spectrum. From Fig. 12, their mean spectrum is almost the same with the target one. And then the scaled ground motion recordings are continuously scaled to meet the target spectrum with PGA from 0.01 g to 1 g with an increment of 0.01 g, and these recordings are input into the isolation structure to be the ground motion.
Fig. 12Target spectrum, mean spectrum and individual earthquake spectra
5.3. Calculation process and results
To assess the seismic vulnerability of these structural systems, the performance-based assessment framework established by the PEER is used. The framework divides the performance assessment into four analysis phases, including seismic hazard analysis, response analysis, damage analysis, and loss analysis. The outcome of each analysis is then integrated using a total probability theorem. As Section 5.1 provides the information that the probability of PGA exceeding 1g is too small to be ignored, less than 30 % probability of exceeding 0.5 m/s2 on the structure even under the earthquake with PGA of 0.8 g is acceptable, and the considerably large relative displacement is allowed, this framework can be simplified to only include the response analysis and the damage analysis to assess the structural performance.
With ground motion records selected in Fig. 12, incremental dynamic analysis (IDA) of nonlinear dynamic response analyse is used to quantify the statistical distribution of the structural response at different levels of earthquake shaking intensities which have been described in Section 5.2. A lot of results are obtained, however, only classical and common results are discussed in detailed manner due to space limitations while other results are considered but not listed.
Under the earthquakes with PGA of 0.8 g, the seismic responses of the structure including the concave friction cases and the uniform friction cases are shown in Fig. 13. In terms of the same parameters of the isolation structure, different ground motion waves result in different values as shown in Fig. 13, which means there is a discrete probability distribution for the seismic responses of the structure. As a whole, if the damping constant increases, the structural maximum acceleration increases, and the ratio of the structural maximum relative displacement to the absolute displacement of the ground motion decreases. When the same damping constant and earthquake are concerned, the structural maximum acceleration in Fig. 13(a) corresponding to the concave friction cases is a little larger than that of the uniform friction cases, however, the displacement ratio in Fig. 13(b) corresponding to the concave friction cases is much less than that of the uniform friction cases. Therefore, the concave friction cases are better than the uniform friction cases.
Fig. 13The seismic responses of the structure subjected to the earthquakes with PGA of 0.8 g
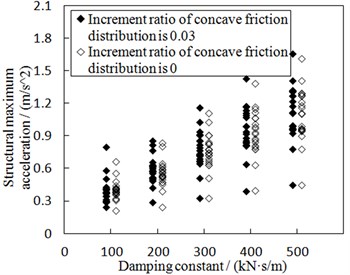
a) Structural maximum acceleration
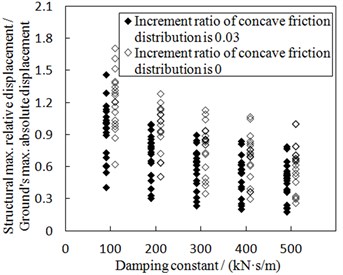
b) Structural maximum relative displacement
A sufficient number of damage states (DS) are defined in Fig. 14 for each performance group to describe the range of damage for the structure at different levels of structural response. Noted that DS in Fig. 14(b) just reflects the design principle provided by the government, and other DS in Fig. 14 are complements to the design principle. These damage states are typically defined using fragility curves. The horizontal axis of the fragility curve represents PGA that affects the performance group and the vertical axis represents the probability that the performance group will exceed each of the damage states.
Fig. 14 shows that probability of exceeding the same DS is different as the damping constant changes by keeping the same increment ratio of the concave friction distribution. As for the condition that the damping constant is 100 kN·s/m, if PGA is 0.8 g, the structural maximum acceleration has approximately 40 %, 22 %, 12 %, and 7 % chance that the structure is beyond damage states 1, 2, 3, and 4, respectively. From Fig. 14(b), the government design principle that less than 30 % probability of exceeding 0.5 m/s2 on the structure under the earthquake with PGA of 0.8 g is satisfied. In Fig. 14(b), if the damping constant increases from 100 kN·s/m, probability of exceeding 0.5 m/s2 on the structure under the earthquake with PGA of 0.8 g increases and break the government design principle, however, the probability of exceedance for the ratio of the structural maximum relative displacement to the ground’s maximum absolute displacement decreases.
Fig. 14Fragility function for the structure with the increment ratio 0.03 of the concave friction distribution
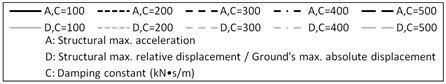
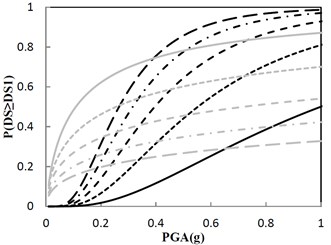
a) Damage state 1 (DS1): 0.4 m/s2, 0.6
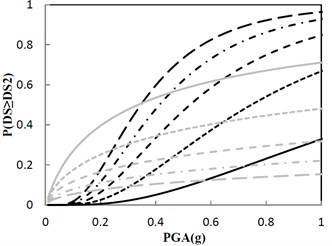
b) Damage state 2 (DS2): 0.5 m/s2, 0.8
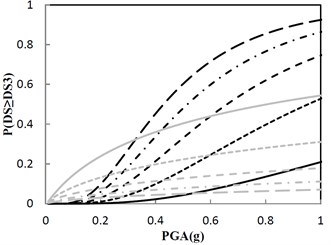
c) Damage state 3 (DS3): 0.6 m/s2, 1.0
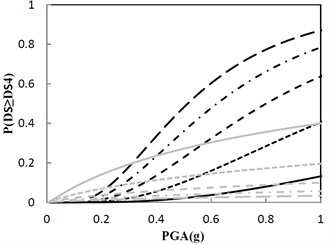
d) Damage state 4 (DS4): 0.7 m/s2, 1.2
In summary, the optimal parameters identified are that the damping constant adopts 100 kN·s/m, and the increment ratio of the concave friction distribution adopts 0.03. Noted that an enough moving space must be designed for the damper-friction structure system, and thus the damage state will not be sensitive to the large relative displacement. Furthermore, based on Fig. 13, if the uniform friction cases are adopted, the government design principle that less than 30 % probability of exceeding 0.5 m/s2 on the structure under the earthquake with PGA of 0.8 g is also satisfied. In this case, however, a much larger moving space than that of the concave friction cases must be designed for the isolation structure, which implies a greater economic investment for the building.
6. Conclusions
By taking a damper-friction isolation system as the study object, this paper analyzes the impact of the concave friction distribution on the structural isolation performance under different ground motions. Based on the obtained regular rules, optimal parameters are identified for an example of isolation building. The main conclusions are summarized as follows:
1) After reasonable combination with the damper, the concave distribution of friction coefficient is conducive to reducing the structural maximum relative displacement. Although it increases the structural maximum acceleration at the same moment, the increasing trend is not obvious. Increasing the damping constant effectively decreases the structural relative displacement, however, it considerably increases the structural acceleration.
2) In terms of optimized damper-friction isolation system with the best design combination of concave friction distribution and the damper, the uncertain prediction of the site type of soil profile and PGA will not lead to the sudden increment of the structural seismic responses.
3) As for a structure system only being sensitive to acceleration or force, significant concave friction distribution and little damping constant would be the best design combination. It results in a much less acceleration and an acceptable relative displacement on the structure.
References
-
Harvey P. S., Gavin H. P. Double rolling isolation systems: a mathematical model and experimental validation. International Journal of Non-Linear Mechanics, Vol. 61, Issue 1, 2014, p. 80-92.
-
Harvey P. S., Zehil G. P., Gavin H. P. Experimental validation of a simplified model for rolling isolation systems. Earthquake Engineering and Structural Dynamics, Vol. 43, Issue 7, 2014, p. 1067-1088.
-
Ismail M., Rodellar J., Pozo F. An isolation device for near-fault ground motions. Structural Control and Health Monitoring, Vol. 21, Issue 3, 2014, p. 249-268.
-
Ismail M., Casas J. R. Novel isolation device for protection of cable-stayed bridges against near-fault earthquakes. Journal of Bridge Engineering, Vol. 19, Issue 8, 2014, p. 50-65.
-
Wang S. J., Hwang J. S., Chang K. C., Shiau C. Y., Lin W. C., Tsai M. S., Hong J. X., Yang Y. H. Sloped multi-roller isolation devices for seismic protection of equipment and facilities. Earthquake Engineering and Structural Dynamics, Vol. 43, Issue 10, 2014, p. 1443-1461.
-
Jangid R. S., Londhe Y. B. Effectiveness of elliptical rolling rods for base isolation. Journal of Structural Engineering, Vol. 124, Issue 4, 1998, p. 469-472.
-
Jangid R. S. Stochastic seismic response of structures isolated by rolling rods. Engineering Structures, Vol. 22, Issue 8, 2000, p. 937-946.
-
Ou Y. C., Song J. W., Lee G. C. A parametric study of seismic behavior of roller seismic isolation bearings for highway bridges. Earthquake Engineering and Structure Dynamics, Vol. 39, Issue 5, 2010, p. 541-559.
-
Lee G. C., Ou Y. C., Niu T. C., Song J. W., Liang Z. Characterization of a roller seismic isolation bearing with supplemental energy dissipation for highway bridges. Journal of Structural Engineering, Vol. 136, Issue 5, 2010, p. 502-510.
-
Guerreiro L., Azevedo J., Muhr A. H. Seismic tests and numerical modeling of a rolling-ball isolation system. Journal of Earthquake Engineering, Vol. 11, Issue 1, 2007, p. 49-66.
-
Kurita K., Aoki S., Nakanishi Y., Tominaga K., Kanazawa M. Fundamental characteristics of reduction system for seismic response using friction force. Journal of Civil Engineering and Architecture, Vol. 5, Issue 11, 2011, p. 1042-1047.
-
Nanda R. P., Agarwal P., Shrikhande M. Base isolation system suitable for masonry buildings. Asian Journal of Civil Engineering (Building and Housing), Vol. 13, Issue 2, 2012, p. 195-202.
-
Wei B., Dai G. L., Wen Y., Xia Y. Seismic performance of an isolation system of rolling friction with spring. Journal of Central South University, Vol. 21, Issue 4, 2014, p. 1518-1525.
-
Wei B., Xia Y., Liu W. A. Lateral vibration analysis of continuous bridges utilizing equal displacement rule. Latin American Journal of Solids and Structures, Vol. 11, Issue 1, 2014, p. 75-91.
-
Wang Y. J., Wei Q. C., Shi J., Long X. Y. Resonance characteristics of two-span continuous beam under moving high speed trains. Latin American Journal of Solids and Structures, Vol. 7, Issue 2, 2010, p. 185-199.
-
Wei B., Yang T. H., Jiang L. Z. Influence of friction variability on isolation performance of a rolling-damper isolation system. Journal of Vibroengineering, Vol. 17, Issue 2, 2015, p. 792-801.
-
Wei B., Wang P., Yang T. H., Dai G. L., Jiang L. Z., Wen Y. Effects of friction variability on isolation performance of rolling-spring systems. Journal of Central South University, Vol. 23, Issue 1, 2016, p. 233-239.
-
JTJ004-89 Specifications of Earthquake Resistant Design for Highway Engineering. Standard of the Ministry of Communications of P. R. China, China Communications Press, Beijing, 1989, (in Chinese).
-
Fahjan Y., Ozdemir Z. Scaling of earthquake accelerograms for non-linear dynamic analysis to match the earthquake design spectra. The 14th World Conference on Earthquake Engineering, Chinese Society for Earthquake Engineering, 2008.
About this article

This research is jointly supported by the National Natural Science Foundation of China under Grant No. 51308549, 51378504 and 51478475, the Natural Science Foundations of Hunan Province under Grant No. 2015JJ3159, and the Innovation-driven Plan in Central South University under Grant No. 2015CX006. The above financial support is greatly appreciated.
In this paper, Biao Wei reviewed the investigation history of the friction-based isolation methods, and analyzed the structural seismic responses of different damper-friction isolation systems under different ground motions. Peng Wang drew all of the figures. Bin Yan carried out the optimization design example of an isolation building, and was the corresponding author due to his continuing research on the similar isolation systems. Lizhong Jiang analyzed and checked the computer program and the results. Xuhui He provided the earthquake input, and modified the paper including English language.
