Abstract
Modern condition monitoring systems (CMS) collect and process enormous amount of data in order to provide the earliest and most dependable information of fault development within any of the machine components and their operation combined. According to numerous studies one of the most fault susceptible mechanical elements in rotating machinery are rolling element bearings. Although reliable techniques for their diagnostics are already proposed, the new investigation is needed. According to authors experience in many industrial applications the operators are obligated to simultaneously track hundreds of diagnostic estimates, such as signals energy, its peakedness or narrowband characteristics for localized faults. As mentioned, for a vibration-based CMS of single wind turbine there are nearly 150 of them. Therefore, the authors employ a fuzzy logic approach for integration of bearing diagnostic features. A new estimate that carry most relevant information about bearing condition is discussed. The reasoning is presented on simulated data that mimics real rotating machine.
1. Introduction
Rolling element bearings (REB) are one of the most commonly used kinematic elements and are used nowadays in almost every industrial branch there is. Unfortunately, in the same time, according to the study mentioned in [1], they are also most susceptible to fault occurrence – about 80 % of total failures in industry are caused by these elements. This resulted in increased interest of scientists and boosted the research for recognition of fault development to detect the damage at the early stage and therefore prevent from possible breakdowns and limit the costs of repair.
So far, there were numerous methods developed for fault detection in REB, as in the early 80 s [2-3] when the phenomenon of this type of damage propagation was formulated and the initial methods for its detection were proposed. Since then, many signal processing techniques were developed like bi- and trispecrum [4-5], empirical mode decomposition [6], composite hypothesis test [7], probability distribution analysis [8] or wavelet transform [9-10]. The latter one was lately investigated by [11] and introduced the wavelet-based variance analysis and the novelty detection. The supported vector machine (SVM) method was studied in [12] and provided statistical classification of different vibration signals to particular fault categories. In [13] the author provided exhaustive summary of bearing diagnostics principals. Interesting work was performed in [14], were authors presented the generalization of the spectral correlation density called modulation intensity distribution (MID), used for detection of modulations in vibration signal. On the other hand, REB maintenance can be performed not only based on the vibration signal – in [15] it was shown that employing neural network and the temperature measurement can also provide recognition of damage at the early stage.
Many of the aforementioned methods are simultaneously implemented in state-of-the-art condition monitoring systems (CMS) as described e.g. in [16-18]. As mentioned in [19], such systems become very complex, and the end user often is faced by the great amount of information to analyze. This is because in CMS the diagnostic process is brought to the comparative study, when particular features or symptoms are tracked for short or long-time change [20]. It was counted in [19], that for a typical wind turbine, the number of diagnostic features that are required for proper monitoring of the entire mechanical system is close to 150. To follow this example, for the entire wind park this number goes into thousands. Based on the authors’ industrial experience, this may lead to overwhelming, confusion and in consequence, to improper justification of machine’s condition. Therefore, the authors propose to integrate diagnostic features related to REB to a single value and thus simplify the decision making process. For this purpose the fuzzy logic reasoning is proposed. It is derived from the fact, that the information about a fault can be understood as a continuum – from the initial state to the damage state. The middle part constitutes the time of operation when the state is unknown and under investigation – it is always somewhere between the extremes [21], therefore it is suggested to treat it as a fuzzy set.
The fuzzy logic was previously employed in condition monitoring of rotating machinery, such as gas turbines [22] or pumps [23], in manufacturing [24-25] or for induction motors [26]. An interesting approach was presented in [27], where the author investigated the frequency spectra for damage detection of REB. In this approach, the membership of the individual spectrum is calculated as an average from memberships of all spectral points from a range of 1-128 Hz. Unfortunately, for a typical CMS equipped with vibration sensors with frequency range up to 40 kHz, such approach would be difficult to implement and quite inaccurate due to the presence of random non-Gaussian noise and equipment imperfections. Therefore the authors propose the method based on Mamdani-type fuzzy interference engine [28] including fuzzification and defuzzification input-output modules.
The article is organized as follows. After the introductory part, the calculation of vibration-based features for bearings diagnostic is described. Then, the fuzzy logic reasoning is presented along with the set of rules established for integration of features. Next, the authors present the exemplary use of the proposed technique using the simulated data. Finally, the results are discussed and the paper is concluded.
2. Rolling element bearings fault development
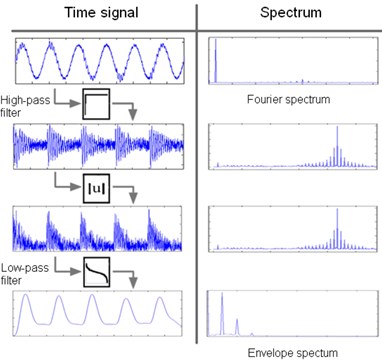
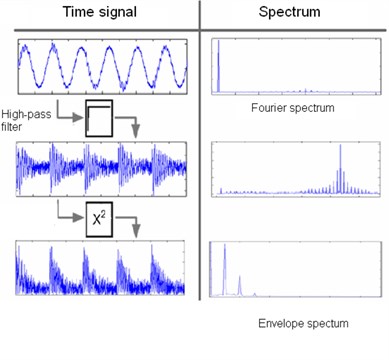
Although there were many signal processing techniques proposed to the REB diagnostics, the authors of this article would like to focus on the one that is widely used in commercial vibration-based CMS, i.e. on tracking of the characteristic frequencies in the envelope spectrum during bearings’ operation. The diagnostic process requires few preliminary steps, namely acquisition and validation of vibration signal, and finally feature extraction [29-30]. The latter one requires the reminder that the faults in REB cause the periodical excitation of elements’ resonance frequencies. This manifests in vibration signal as modulations [3]. In order to monitor the impulses, the envelope spectrum needs to obtained. In Fig. 1, one may find the two exemplary algorithms for this purpose: via filtration (Fig. 1(a)) and via signal squaring (Fig. 1(b)). First method uses a high-pass filter and further the low-pass filter applied to the absolute value of the obtained signal. Second approach relies on squaring the signal directly after high-pass filtration. Finally, the spectrum of the modified signal is obtained. Another example of signal processing technique is the Hilbert transform, also widely implemented in CMS.
It needs to be pointed out that for the correct envelope spectra calculation, the unwanted frequencies excited by to meshing and shafts need to be cut off first by high-pass filtering [31]. For most cases of rotating machinery, such as wind turbines or mining excavators, the cut-off frequency is in the range of few kHz. To effectively perform the monitoring, the knowledge of the exact type of applied bearing is required. This knowledge is especially important to correctly set the number of performed analysis and to set the appropriate frequency ranges. The increase in the energy of a given frequency component (for the same speed value) is used as an indicator of corresponding element failure.
Furthermore, another important issue in monitoring of rotating machinery is the variability of the rotational speed. In case of wind turbines, most of machines operate under changing conditions and with variable speed. Due to the fact that frequency components depends linearly on the rotational speed, elements operating with changing speed generate signals of changing frequency. Because of this relation obtained spectrum become fuzzy and more difficult to interpret. To avoid this phenomenon, the spectra should be monitored in the so-called order domain. In this technique, the signal needs to be resampled to get the constant number of samples per reference signal (e.g. fast shaft revolution) instead of constant number per unit of time. A spectrum obtained in this manner is called an order spectrum [32].
Fig. 1Procedure of envelope spectrum calculation: a) filtration, b) signal squaring
a)
b)
In the order spectrum one may find the characteristic frequencies that inform of the failure presence. They may be provided by the bearing’s producer, or calculated from the following equations:
where – shaft speed, – number of rolling elements, – the angle of the load from the radial plane, – ball diameter, – pitch diameter (distance between opposing balls in a bearing) means. The abbreviations on the left side of the equations in the frequency lower indices represent as follows:
- BPFO – ball-pass frequency of outer race,
- BPFI – ball-pass frequency of inner race,
- FTF – fundamental train frequency (cage speed),
- BSF (RSF) – ball (roller) spin frequency.
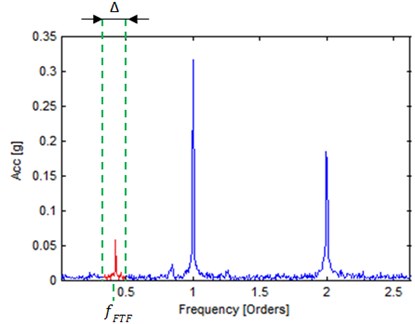
As noticed in [33], the Eqs. (1)-(4) do not take into account additional slip between the shaft and the bearing, especially under load and after wear, so therefore the characteristic frequencies might oscillate under the calculated value. This can be overcome by selection of a bandwidth , that helps recognize the characteristic frequency as is usually assumed empirically based on the personnel’s experience. Therefore, the amplitude value at the characteristic frequency is obtained from the band, as presented in red in Fig. 2 and calculated from Eq. (5). As the example, the authors use the FTF, but this formula can be used to the remaining frequencies:
Fig. 2Amplitude estimation of characteristic frequency in band (marked in red)
3. Fuzzy-logic reasoning for rolling element bearings
3.1. General description
Fuzzy logic provides a way of reducing and explaining of complex, multivariable systems [34] This can be done firstly be normalizing of systems parameters according to the membership function of a different shape, but with similar interpretation of the boundaries values. The simplest example of a membership function is right outside fuzzy set, as presented in Fig. 3 and calculated as:
Fig. 3Right outside fuzzy set for FTF
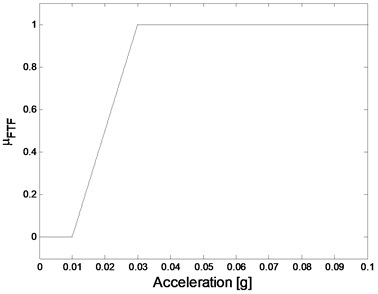
The FTF represents amplitude of an exemplary REB diagnostic feature, – lower reference (control) limit for FTF, might be obtained e.g. using method described in [35] by calculating 95th percentile of the cumulative distribution function of the feature in the referential period, however from the practical point of view) this approach is not optimal and value of LCL should be equal to zero; – upper reference (control) limit for FTF, could be calculated using a dB spans, as described in [36].
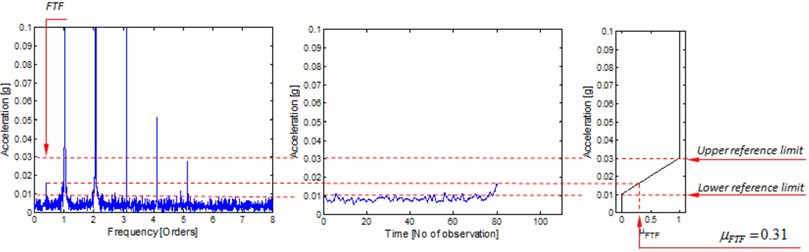
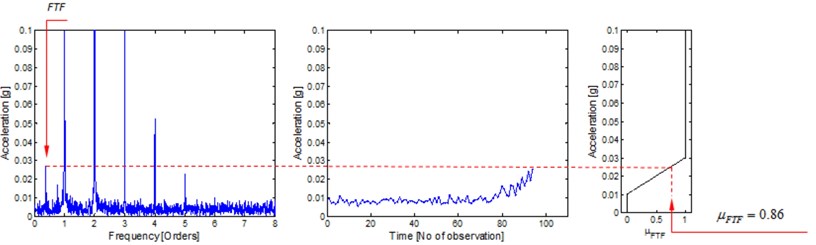
The presented membership function might be help with classifying of bearings condition based on some feature – ideal state, i.e. no frequency component, gives value close to 0, while approaching the control limit approximates value to 1. Similar reasoning is presented in Fig. 4 for two cases: lower and higher value of characteristic frequency (Fig. 4(a) and Fig. 4(b), respectively). In each case, on the envelope spectrum (left plots) the FTF is sought according to Eq. (5) and plotted on trend (middle plots) at the timestamp related to the particular observation, i.e. 80th for lower case and 95th for higher case. Then this value can be confronted with the membership function (right plots), which could describe the process of bearings degradation.
As presented, value of the membership function increases in normalized domain from 0.31 to 0.86. In this sensethe bearing’s cage condition could be classified as 0.86 in 0-1 range, where unity stands for cage with fault. This can even be more intuitive – one may state that it belongs to the damage class in 86 %
Fig. 4Increase of the characteristic frequency on the envelope spectrum with the corresponding trend plots and membership functions at two stages of a fault: a) initial, b) developed
a)
b)
3.2. Fuzzy diagnostics decision model
Fuzzy logic approach is applied in order to automatize detection of bearing malfunctions and defects [37]. Top-level aggregation of vibrational measures and indicators obtained from condition-based monitoring system facilitates and simplifies diagnostics in case of large number of simultaneously monitored installations. A proposed faults detection process involves a hierarchically-orientated fuzzy model where the three condition monitoring levels are available, namely:
a) top-level overall faulty condition indicator,
b) fault classification, isolation and localization indicators,
c) basic condition symptom measures and indicators.
The measures are fundamental estimates of physical quantities (e.g. conditioned and demodulated acceleration signals) while indicators are developed in advanced data processing based on the measures. Measures and indicators allow early warning notification in case of exceeded limits including fuzziness of decision-making process similar to a conventional operator-based decision-making process. The condition monitoring levels represent gradually increasing fault symptoms aggregation starting from basic measures and end-up with a single-value top-level overall faulty condition indicator. The top-level indicator is feasible to characterize overall condition of a wind turbine. Thus an operator follows only these indicators in an automatic mode while analyzing vibration processes from many wind farms. In case of malfunctioned or faulty operation indication the analysis is switched to manual investigation mode using mid-level and basic measures and indicators.
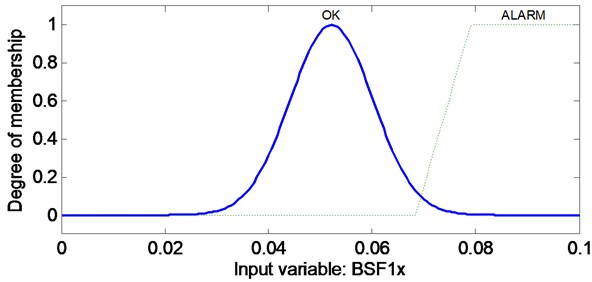
The applied fuzzy model was developed using a Mamdani-type fuzzy inference engine including fuzzification and defuzzification input-output modules. Fuzzy inference process formulates the mapping from the input (basic measures and indicators) to the output (top-level indicator) using fuzzy rules. The gauss and trapezoidal membership functions are used to process the frequency spectra at the model input. Fuzzy membership parameters are initially adjusted based on data trends statistical distributions. BPFO, BPFI, FTF, and BSF (RSF) trends represented by their harmonics are approximated using the normal distribution, respectively by mean and standard deviation metrics. A couple of gauss membership functions are used to cover the normal operating range for a particular trend and its harmonics (Fig. 5). The sigmoidal membership functions are used to cover a faulty operation range, i.e. ALARM function.
Fig. 5Example of fuzzy membership function used to cover normal and faulty operation of a rolling-element bearing regarding BSF1x component
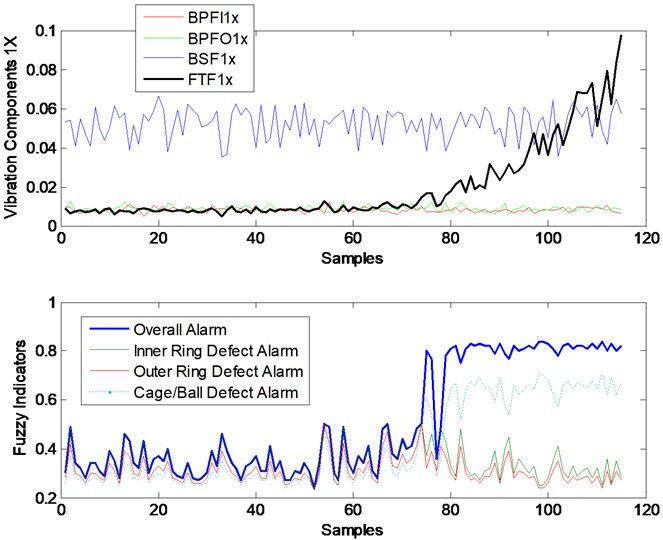
As an example, a fuzzy inference process was demonstrated for a case of malfunctioned operation of rolling elements of a bearing. The mid-layer includes indicators of Inner Ring, Outer Ring, and Rolling Element Defects related to BPFI1, BPFI1, and FTF measures respectively. The top-level OverallAlarm indicator increases if trend values meet the following fuzzy sets mapping:
If (BPFI1x is OK) and (BPFO1x is OK) and …
… (BSF1x is OK) and (FTF1x is ALARM) then …
… (OverallAlarm is ALARM) and (RollingElementDefect is ALARM).
On the other hand, the top-level OverallAlarm indicator remains steady if trend values meet the following fuzzy sets mapping:
If (BPFI1x is OK) and (BPFO1x is OK) and …
… (BSF1x is OK) and (FTF1x is OK) then …
… (OverallAlarm is OK) and (InnerRingDefect is OK) and…
… (OuterRingDefect is OK) and (RollingElementDefect is OK).
The inference mid-level fault classification indicator increases if trend values meet the following fuzzy sets mapping:
If (BPFI1x is OK) and (BPFO1x is OK) and …
… (BSF1x is ALARM) and (FTF1x is OK) then …
… (OverallAlarm is ALARM) and (InnerRingDefect is OK) and …
… (OuterRingDefect is OK) and (RollingElementDefect is ALARM).
The model output, namely the top-level and mid-level fuzzy indicators, is graphically presented in Fig. 6.
The time scale represents samples acquired periodically. They are related to development of cage/ball defect observed based on FTF1x component frequency trend. The fuzzy model generates four fuzzy alarm indicators where Overall and Cage/Ball Defect alarm indicators were activated with belief estimates higher than 0.6.
Fig. 6Trends of fuzzy alarm indicators
4. Conclusions
Fuzzy logic provides a convenient method to aggregate a large number of numerous uncertain and inaccurate diagnostic symptoms in a hierarchical alarm indicator system. With application of fuzzy logic, the decision-making process is more efficient and automated regarding large installations of wind turbines, i.e. wind farms. Based on knowledge acquisition via expert knowledge (collected as fuzzy conditional statements), simulation-based observations; process trends and fault statistics, a fuzzy logic diagnostic model was developed as a fuzzy symptoms-faults mapping and implemented within the heuristic knowledge base. This paper shows a simplified approach to demonstrate the method. The further work will focus on aggregated self-adjustable wind turbine diagnostic indicators which provide the early-warning shut-down alarms, while defect location, severity and type will be deduced from the collected and coded fuzzy statements. A self-adjustment fuzzy logic approach will be developed in order to increase diagnostic efficiency of different types of wind turbines.
References
-
Tabaszewski M. Optimization of a nearest neighbors classifier for diagnosis of condition of rolling bearings. Diagnostyka, Vol. 15, Issue 1, 2014, p. 37-42.
-
Chaturvedi G. K., Thomas D. W. Bearing fault detection using adaptive noise cancelling. Journal of Sound and Vibration, Vol. 104, 1982, p. 280-289.
-
McFadden P. D., Smith J. D. Vibration monitoring of rolling element bearings by the high-frequency resonance technique – a review. Tribology International, Vol. 17, Issue 1, 1984, p. 3-10.
-
Yang D. M., Stronach A. F., Macconnell P., Penman J. Third-order spectral techniques for the diagnosis of motor bearing condition using artificial neural networks. Mechanical Systems and Signal Processing, Vol. 16, 2002, p. 391-411.
-
McCormick A. C., Nandi A. K. Bispectral and trispectral features for machine condition diagnosis. IEE Proceedings – Vision, Image and Signal Processing, Vol. 146, 1999, p. 229-234.
-
Dybała J., Zimroz R., Rolling bearing diagnosing method based on empirical mode decomposition of machine vibration signal. Applied Acoustics, Vol. 77, 2014, p. 195-203.
-
Ma J., Li C. J. Detection of localized defects in rolling element bearings via composite hypothesis test. Mechanical Systems and Signal Processing, Vol. 9, 1995, p. 63-75.
-
Żak G., Obuchowski J., Wyłomańska A., Zimroz R. Application of arma modelling and alpha-stable distribution for local damage detection in bearings. Diagnostyka, Vol. 15, Issue 3, 2014, p. 3-10.
-
Luo G. Y., Osypiw D., Irle M. On-line vibration analysis with fast continuous wavelet algorithm for condition monitoring of bearings. Journal of Vibration and Control, Vol. 9, 2003, p. 931-947.
-
Rubini R., Meneghetti U. Application of the envelope and wavelet transform analyses for the diagnosis of incipient faults in ball bearings. Mechanical Systems and Signal Processing, Vol. 15, 2001, p. 287-302.
-
Ziaja A., Antoniadou I., Barszcz T., Staszewski W. J., Worden K. Fault detection in rolling element bearings using wavelet-based variance analysis and novelty detection. Journal of Vibration and Control, Doi: 10.1177/1077546314532859, 2014.
-
Sun Q., Chen P., Zhang D., Xi F. Pattern recognition for automatic machinery fault diagnosis. Journal of Vibration and Acoustics, Vol. 126, 2004, p. 307-316.
-
Randall R. B. Vibration-based Condition Monitoring. Industrial, Aerospace and Automotive Application. A John Wiley and Sons, Ltd., 2011.
-
Urbanek J., Barszcz T., Antoni J. Integrated modulation intensity distribution as a practical tool for condition monitoring. Applied Acoustics, Vol. 77, 2014, p. 184-194.
-
Zhang Zh., Wang K. Wind turbine fault detection based on SCADA data analysis using ANN. Advance in Manufacturing, Vol. 2, Issue 1, 2014, p. 70-78.
-
Barszcz T., Jabłoński A., Strączkiewicz M. New generation of condition monitoring systems for non-stationary machinery – proposal of the architecture. 10th International Conference on Condition Monitoring and Machinery Failure Prevention Technologies, Krakow, Poland, 2013.
-
Astolfi D., Castellani F., Terzi L. Fault prevention and diagnosis through SCADA temperature data analysis of an onshore wind farm. Diagnostyka, Vol. 15, Issue 2, 2014, p. 71-78.
-
Yang W., Court R., Jiang J. Wind turbine condition monitoring by the approach of SCADA data analysis. Renewable Energy, Vol. 53, 2013, p. 365-376.
-
Barszcz T., Strączkiewicz M. Novel intuitive hierarchical structures for condition monitoring system of wind turbines. Diagnostyka, Vol. 14, Issue 3, 2013, p. 53-60.
-
Strączkiewicz M., Wiciak P., Jabłoński A., Barszcz T. Machinery in highly changing operations: on designation of operational states. 12th International Conference on Condition Monitoring and Machinery Failure Prevention Technologies, Oxford, UK, 2015.
-
Rao R. V. Advanced Modeling and Optimization of Manufacturing Processes: International Research and Development. Springer Verlag, London, 2011, p. 10.
-
Gayme D., Menon S., Ball C., Mukavetz D., Nwadiogby E. Fault diagnosis in gas turbine engines using fuzzy logic. IEEE International Conference on Systems, Man and Cybernetics, Vol. 4, 2003, p. 3756-3762.
-
Wang J., Hu H. Vibration-based fault diagnosis of pump using fuzzy technique. Measurement, Vol. 39, 2006, p. 176-185.
-
Jeffries M., Lai E., Plantenberg D. H., Hull J. B. A fuzzy approach to the condition monitoring of a packaging plant. Journal of Materials Processing Technology, Vol. 109, Issues 1-2, 2001, p. 83-89.
-
Azadegan A., Porobic L., Ghazinoory S., Samouei P., Kheirkhan A. S. Fuzzy logic in manufacturing: a review of literature and a specialized application. International Journal of Production Economics, Vol. 132, Issue 2, 2011, p. 258-270.
-
Rodriguez P. V. J., Arkkio A. Detection of stator winding fault in induction motor using fuzzy logic. Applied Soft Computing, Vol. 8, Issue 2, 2008, p. 1112-1120.
-
Mechefske C. K. Objective machinery fault diagnosis using fuzzy logic. Mechanical Systems and Signal Processing, Vol. 12, Issue 6, 1998, p. 855-862.
-
Mamdani E. H., Assilian S. An experiment in linguistic synthesis with a fuzzy logic controller. International Journal of Man-Machine Studies, Vol. 7, Issue 1, 1975, p. 1-13.
-
Strączkiewicz M., Barszcz T. Detection and classification of alarm threshold violations in condition monitoring systems working in highly varying operational conditions. 11th International Conference on Damage Assessment of Structures, Ghent, Belgium, 2015.
-
Jabłoński A., Barszcz T. Validation of vibration measurements for heavy duty machinery diagnostics. Mechanical Systems and Signal Processing, Vol. 38, Issue 1, 2013, p. 248-263.
-
Barszcz T., Jabłoński A. A novel method for the optimal band selection for vibration signal demodulation and comparison with the Kurtogram. Mechanical Systems and Signal Processing, Vol. 20, 2011, p. 308-331.
-
Barszcz T. Selection of diagnostic algorithms for wind turbines. Proceedings of 4th International Congress on Technical Diagnostics, Olsztyn, Poland, 2008.
-
Ganeriwala S. N. Review of techniques for bearings and gearbox diagnostics. 28th International Modal Analysis Conference (IMAC), Jacksonville, FL, USA, 2010.
-
Cox E., O’Hagan M., Taber R. The Fuzzy Systems Handbook – A Practitioner’s Guide to Building, Using, and Maintaining Fuzzy Systems (2nd Edition). Elsevier Science and Technology Books, New York, 1998.
-
Jabłoński A., Barszcz T., Bielecka M., Breuhaus P. Modeling of probability distribution functions for automatic threshold calculation in condition monitoring systems. Measurement, 2013, Vol. 46, p. 727-738.
-
Cempel C. Simple condition forecasting techniques in vibroacoustical diagnostics. Mechanical Systems and Signal Processing, Vol. 1, Issue 1, 1987, p. 75-82.
-
Czop P., Miękina L. Non-contact model-based diagnostics of electrical motor involving uncertainty and imprecision of model parameters. Computer Assisted Mechanics and Engineering Sciences, Vol. 12, 2005, p. 123-132.
About this article

