Abstract
Vibration signal of reciprocating compressor gas valve represents nonlinear, non-stationary and multiple impulse characteristics. To extract the features of the signal, an integration approach based on local mean decomposition (LMD) method and autoregressive-generalized autoregressive conditional heteroscedasticity (AR-GARCH) model is proposed. First, the property of LMD is investigated in the paper, which indicates that LMD method not only can effectively alleviate non-stationary feature and restrain the end effect of non-stationary signal, but also can accurately improve the resolution of time-frequency analysis. Then, the first five PF components of gas valve signal are modeled by AR(1)-GARCH(1, 1) model as the feature vectors without any prior knowledge about the fault mechanism. Finally, the BP neural networks are applied to diagnose the faults of reciprocating compressor gas valve based on the feature vectors above. The results indicate that high diagnosis accuracy can be obtained by integrating LMD method and AR-GARCH model. So the approach proposed in the paper provides an effective measure to extract the fault feature of reciprocating compressor gas valve.
1. Introduction
The gas valve is an essential component of reciprocating compressor. Approximately 60 % of reciprocating compressor failures was caused by the gas valve, so gas valve fault detection and diagnosis is an important industrial maintenance task. Fault feature extraction from gas valve signals is the key process for fault diagnosis of reciprocating compressor gas valve.
The vibration signals generated by reciprocating compressor gas valve include a multiple impulse source characteristic, and it is typical nonlinear and non-stationary. Conventional signal processing techniques including time-domain statistical analysis, frequency-domain spectral analysis and modeling methods have been widely used in fault diagnosis of rotating machinery [2, 3]. Among them, the modeling method is very convenient, because it does not require any prior knowledge about fault mechanism, and the characteristics of machinery can be reflected by the parameters of the model. Furthermore, the time expense for parameter computing is very low and suitable for real-time recognition and classification [4]. Among the models, the autoregressive (AR) model is the most popular linear model for stationary signal, and model parameters are very sensitive to the condition variation [5]. However, when the AR model is applied to non-stationary signal, the iterative operation may be not convergent and the autoregressive parameters are difficult to be estimated. Although the literature [6] proposes an approach based on empirical mode decomposition (EMD) and AR model to transform the non-stationary signal into stationary signal, the effect will be not evident for the volatile signal, especially the signal with time-varying variation. On the other hand, the time-dependent autoregressive and moving average(ARMA) model can be applied to non-stationary signals, but the more computation time is needed. Furthermore, only the linear frequency and amplitude modulated signals can be effectively analyzed by ARMA model [7]. In practice, the gas valve signal demonstrates both variability clustering and heavy tail behavior, and the signal is of non-stationary with time varying variance [8]. At present, the time varying variance of the non-stationary signal can be estimated using a complex GARCH model with Gaussian innovations. The GARCH model was first introduced by Bollerslev [9] as an extension of the ARCH model developed by Engle [10] in economic data modeling. For a few decades, many researchers have tried to expand the model in several fields, and AR-GARCH is one of the extensions [11]. In this paper, more specifically, an AR(1)-GARCH(1, 1) model is adopted to extract the feature of gas valve signal. Since the signal represents a strong non-stationary characteristic and is often corrupted by noise, the analysis results will be imperfect if the AR(1)-GARCH(1, 1) model is directly applied to the gas valve signal. So the non-stationary problem should be firstly alleviated before establishing the model.
To process the non-stationary signal, time-frequency analysis techniques, such as short time Fourier transform(SFTF) [12], Wigner-Ville transform (WVT) [13], wavelet transform (WT) [14] and empirical mode decomposition(EMD) [15], have been well accepted and widely used. However, all the techniques also present some own limitations. To obtain good frequency resolution in the case of the STFT, a long sliding window is needed, but bad localization in time is caused, and vice versa. So the window length has to be chosen based on the prior knowledge of signal [16]. Although WVT has good resolution in both time and frequency, its cross-terms cause some false information for multi-component signal [17]. Compared with STFT and WVT, WT is much better in providing local features of multi-scale time-frequency analysis, which enables wavelet analysis distinguish the abrupt components of vibration signal. However, WT still has some inevitable deficiencies. Firstly, energy leakage will occur when using wavelet transform to process signals due to the fact that wavelet transform is essentially an adjustable windowed Fourier transform. Secondly, the appropriate base function needs to be selected in advance. Moreover, once the decomposition scales are determined, the result of wavelet decomposition would be the signal under a certain frequency band. Therefore, wavelet transform is not a self-adaptive signal processing approach in nature [18]. EMD is a self-adaptive signal processing method that could decompose a non-stationary signal into a number of intrinsic mode functions (IMFs). By Hilbert transform, the corresponding frequency and energy distribution of signals can be obtained from IMFs [19]. Since EMD method was developed, it has demonstrated the superiority of feature extraction for non-stationary signal in many applications [20]. However, many deficiencies still exist in the EMD technique, such as the end effects [21], mode mixing [22], the IMF criterion [23] and the envelope line [24]. In addition, the existence of some unknown and unexplainable instantaneous frequency components of investigated signals is still highly controversial.
Recently, a novel self-adaptive time-frequency analysis method, known as the local mean decomposition (LMD) technique, was proposed by Jonathan S. Smith as an extension of the EMD technique to process EEG perception data [25]. The LMD can decompose a multi-component signal into a set of product functions (PFs), each of which is the product of an amplitude envelope (AM) signal and a frequency modulated (FM) signal. Furthermore, the corresponding complete time-frequency distribution could be obtained by assembling the instantaneous amplitude and instantaneous frequency of all PF components. The gas valve signal of reciprocating compressor represents AM-FM feature, which is more obvious when fault occurs [26]. So it is possible to apply LMD to the fault feature extraction of reciprocating compressor gas valve.
In the paper, the vibration signals of four gas valve states, a normal valve, a gap valve, a fractured valve and a bad spring valve, are firstly decomposed using the LMD method into a set of PFs and a residual term . Then the AR (1)-GARCH(1, 1) model of each PF can be established, whose parameters reflect the real features of the investigated signal and can be taken as the feature vectors. Finally, the BP neural network is applied to diagnose the faults from the reciprocating compressor gas valves based on the extracted features vectors above. The results indicate that high diagnosis accuracy can be obtained by integrating LMD method and AR-GARCH model. So the approach proposed in the paper provides an effective measure to extract the fault feature of reciprocating compressor gas valve.
2. Local mean decomposition method
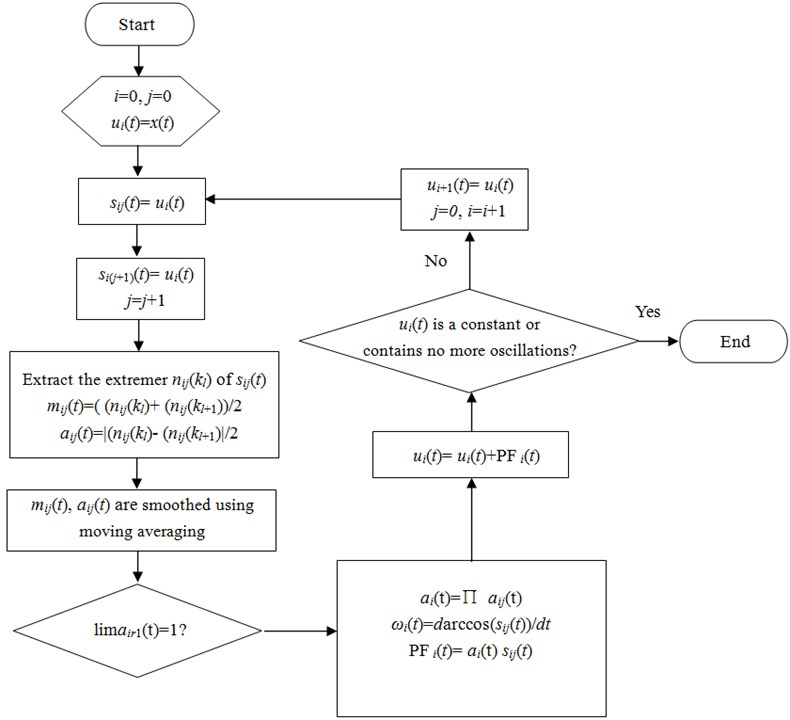
For a given signal , the LMD algorithm can be briefly described as follow Fig. 1 [27, 28].
Fig. 1The diagram LMD algorithm
In order to verify the merit of LMD approach on nonlinear trend analysis of non-stationary signal, the wavelet method and EMD method are used for comparison investigation.
Consider an original nonstationary signal given below:
where 0-2 s, and sample frequency is 1000 Hz. Add a nonlinear trend term to , and then the investiaged signal is obtained as follows, and each simulated signal is given in Fig. 2:
According to the Eqs. (1)-(3), the investigated signal including four components: one AM-FM signal, two harmonic signal and one trend signal is a typical nonlinear and non-stationary signal. Apply the wavelet method, EMD method and LMD method to the feature extraction of , and the analysis results are respectively shown from Fig. 3 to Fig. 5.
Fig. 2The simulated signal xt, dt and yt
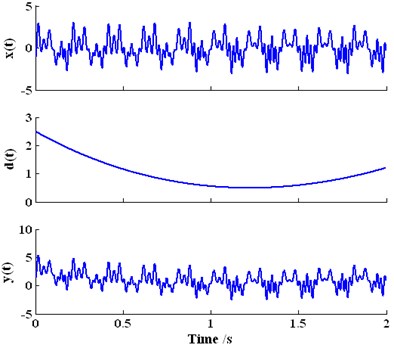
Fig. 3The decomposition result of the investigated signal yt based on wavelet
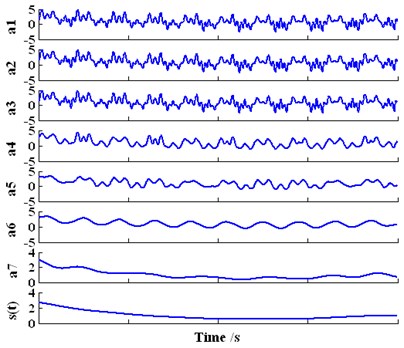
Fig. 4The decomposition result of the investigated signal yt based on EMD
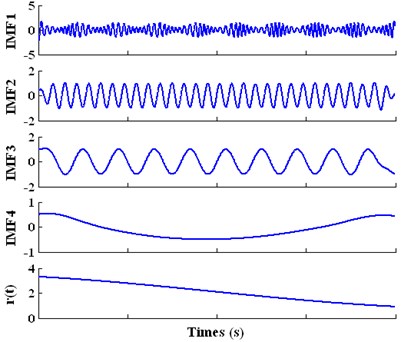
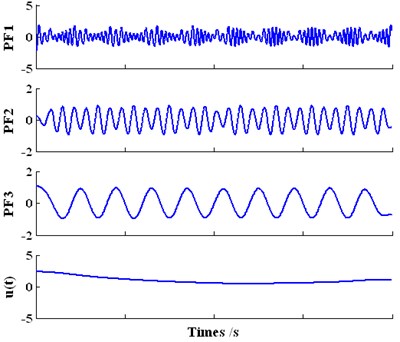
Fig. 5The decomposition result of the investigated signal yt based on LMD
In Fig. 3, the signal is decomposed into seven high frequency components - and one low frequency component by the db10 wavelet. demonstrates the feature of the trend signal contained in . However, the features of AM-FM signal and harmonic signal contained in cannot be extracted from - effectively. Each component is corresponding to the different scalar resolution of the signal from high to low, and it is not a intrinsic mode with physical significance. In addtion, the special choices of the wavelet and scaling function are difficult, and require more prior knowledge about the investigated signal. Moreover, the decomposition process of wavelet is not self-adaptive, so the precise trend term cannot be easily obtained.
Fig. 4 shows that the investigated signal is decomposed into four intrinsic mode functions IMF1-IMF4 and one residual term by EMD method. The features of one AM-FM signal and two harmonic signal contained in can be effectively extracted from IMF1-IMF3 respectively. However, the feature of residual term cannot match the trend signal contained in , and the feature of IMF4 cannot represent any physical significance. According to the prior knowledge as we known about , the joint of IMF4 and should be the trend term of . Although the decomposition proceeds in terms of the intrinsic information of the signal and the amount of the decomposed IMFs is usually finite, the useful information or really trend term is uncertain without prior knowledge.
In the case of LMD analysis result for the investigated signal , it clearly reflects the four features of : PF1 represents the AM-FM signal, PF2-PF3 respectively represent the two harmonic signal and is corresponding to the trend signal. Therefore, compared with wavelet and EMD, the decomposition components of LMD are more physically meaningful and the convergence rate of LMD is faster. In addition, the analysis precision of LMD is also better. To verify the accuracy, the trend terms are respectively provided based on theory value , wavelet, EMD and LMD in Fig. 6.
Fig. 6The trend analysis of yt based on theory value dt, wavelet, EMD and LMD
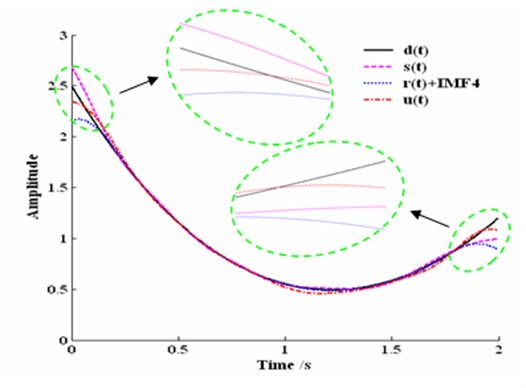
Fig. 6 indicates that all the methods based on wavelet, EMD and LMD can extract the trend feature from non-stationary and nonlinear signal, and the trend features are much close to the theory trend feature. However, by observing the details of each trend curve, it is found that the end effect of trend curve is the smallest and the end effect of trend curve IMF4 is the most obvious. So it indicates that LMD method can effectively restrain the end effect of non-stationary signal, and the real characteristics of the original signals can be reflected efficiently.
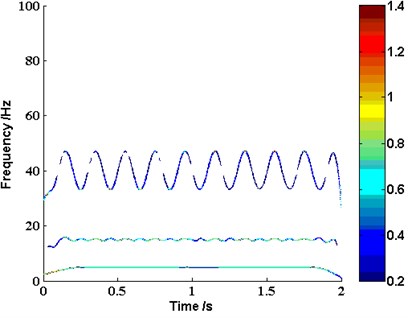
Besides the multi-component decomposition and nonlinear trend analysis, the time-frequency analysis is another important application for wavelet, EMD and LMD. The wavelet coefficients provide a measure of the similitude between the parent wavelet and the signal at scale. The squared magnitude of the coefficients can be presented via the scaleogram as energy content in frequency and time. So the scale, frequency and energy of wavelet can be used to draw an information cell in the time-frequency plane. The IMFs decomposed by EMD have well-behaved Hilbert transform and conform to a narrowband condition. EMD and Hilbert spectrum analysis constitute Hilbert-Huang transform (HHT), which was first proposed by Huang for the time-frequency analysis of nonstationary signals [20]. So the instantaneous frequency (IF) and instantaneous amplitude (IA) can be obtained by HHT. LMD method can decompose amplitude and frequency modulated signals into a small set of product functions, each of which is the product of an envelope signal and a frequency modulated signal from which a time-varying instantaneous amplitude and instantaneous frequency can be derived. The instantaneous frequency and envelope values can then be plotted together in the form of a demodulated signal time-frequency representation [29]. Fig. 7-Fig. 9 display the time-frequency distribution of the signal based on wavelet, EMD and LMD respectively.
From Fig. 7 to Fig. 9, it indicates that all the time-frequency analysis method based on wavelet, EMD and LMD can effectively extract the original frequency feature contained in , such as the modulated frequency components 45 Hz and 35 Hz, the harmonic frequency components 15 Hz and 5 Hz . However, the frequency resolution of wavelet is too bad, and the two end effects of EMD are much serious. Compared with wavelet and EMD, the time-frequency analysis based on LMD can be more accurate in resolution capabilities and closer to the truth of original signal.
Fig. 7The time-frequency distribution of the investigated signal yt based on wavelet
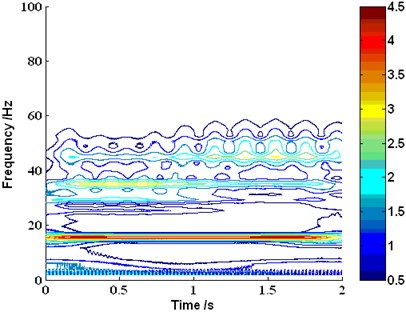
Fig. 8The time-frequency distribution of the investigated signal yt based on EMD
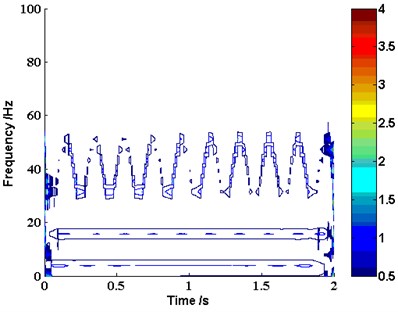
Fig. 9The time-frequency distribution of the investigated signal yt based on LMD
3. Feature extraction based on LMD and AR-GARCH model
It is assumed that an arbitrary non-stationary signal has been decomposed into s and a residual term via LMD. To alleviate the non-stationarity of and reduce the complexity of computing, the main features of can be extracted by estimating the parameters of AR(1)-GARCH(1, 1) model corresponding to each . For a given component , the model is defined as follows [15]:
where is the time index, and , in Eq. (4) are the parameters of the AR(1) part respectively. in Eq. (5) is zero-mean independent identically distributed Gaussian random variables with unity variance. , and in Eq. (6) are the parameters of the GARCH(1, 1) model, and , is the conditional variance of the signal.
Since the parameters , , , and can reflect the inherent characteristics of vibration signal, they can be chosen as the feature vectors to identify the state of reciprocating compressor gas valve. In order to test the feasibility and accuracy of the proposed approach, take the original signal defined by Eq. (3) for an example. Fig. 10 displays LMD trend curve and its corresponding curve fitted by AR-GARCH. It presents a good match of the LMD trend and AR-GARCH trend which can accurately model the nonlinear and non-stationary signal in time domain.
Fig. 10Trend analysis based on theory value dt, wavelet, EMD and LMD
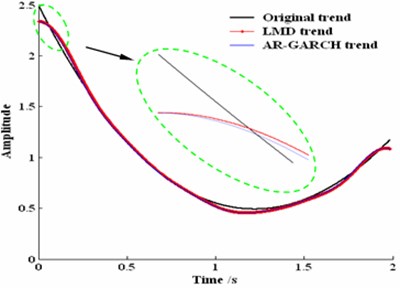
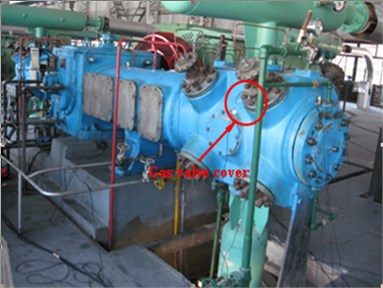
Fig. 11The disposition of experimental equipment for gas valve
4. Application to the fault diagnosis of reciprocating compressor gas valve
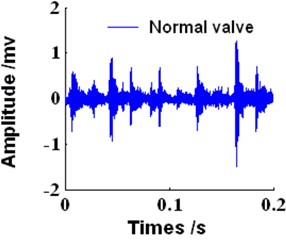
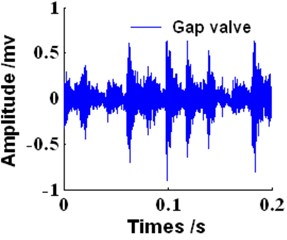
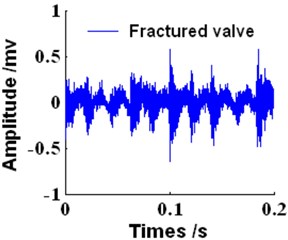
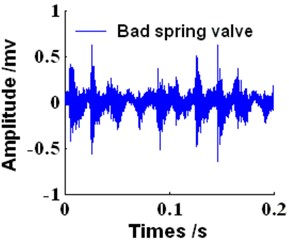
In this study, experiments were carried out on four different types of reciprocating compressor gas valves including a normal valve, a gap valve, a fractured valve and a valve with a bad spring. Vibration signals were collected by vibration acceleration transducers fixed on the gas valve cover. The sample frequency used was 50000 Hz and 10000 samples were taken. Fig. 11 displays the disposition of experimental equipment. The vibration time waveforms for the four gas valve states are shown in Fig. 12.
Applying LMD method to each gas valve signal, the decomposition result in four gas valve states can be obtained. As shown in Fig. 13, the main information is included in the first five PF components which represent the high-frequency bands of the gas valve signal. Thus the AR(1)-GARCH(1, 1) model feature vectors can be calculated with the first five PF components. The corresponding fitting curve of AR(1)-GARCH(1, 1) model is displayed in Fig. 14.
Fig. 14 represents a good match between the first five PF components of normal gas valve signal and the fitting of AR-GARCH. So the feature vectors produced by the joint model parameters can indicate the main characteristics of gas valve signal. Moreover, the part vectors of the first five PF components in the four gas valve states are listed in Table 1 in which (1, 2, 3, 4 denotes the normal valve, gap valve, fractured valve and bad spring valve. 1, 2, 3, 4, 5 denotes the first five PF components respectively) denotes the feature vector of the th PF component under the th gas valve state.
Table 1 shows the model parameters and are zero for each component in four gas valve states. So the feature vectors can be simplified to [, , ]. In order to verify the effectiveness of the novel feature extraction approach based on LMD and AR-GARCH, the BP neural network is applied to diagnose the faults of reciprocating compressor gas valve. A total of 100 samples are taken for each gas valve state with 80 samples selected as the learning data for training and the other 20 samples for testing data used to diagnose the state of gas valves. The desirable output is a vector [1, 0, 0, 0] for the neural network for the purpose of training and learning when the samples of normal valve state is input. The desirable output are the vectors [0, 1, 0, 0], [0, 0, 1, 0] and [0, 0, 0, 1] which correspond to the samples of gap valve, fractured valve and bad spring valve. The input layer node number of neural network is 15, while its output layer node number is 4. BP neural network adopts a hidden layer with 8 nodes. The diagnosis results are given in Table 1. From the diagnosis accuracy of the model feature vectors, it shows that the accuracy of integrated first five components in normal state is 87.50 %, while the accuracies of other diagnosis are 91.25 %, 88.75 % and 93.75 % respectively. It is testified that the high diagnosis accuracy can be obtained based on the approach proposed in this paper.
Fig. 12The time waveforms of gas valve in the four states
a)
b)
c)
d)
Fig. 13The decomposition result of the normal gas valve based on LMD
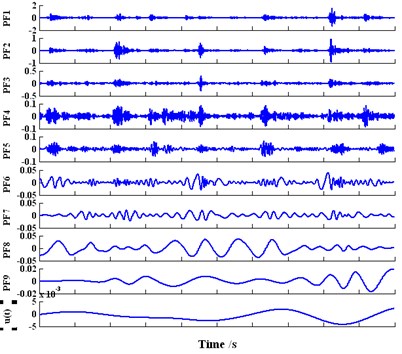
Fig. 14The fitting curves of the first five PF components based on AR-GARCH model
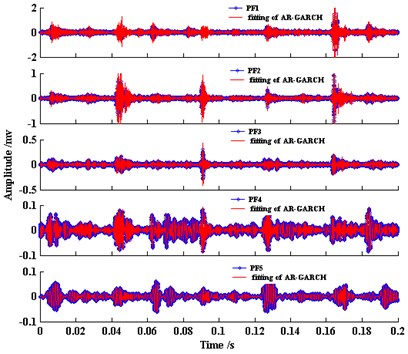
Table 1Fault diagnosis results obtained with the model feature vectors:
Gas valve state | Feature vectors | Estimates | Output | Accuracy (%) | ||||
Normal | 0 | 0.5553 | 0 | 0.2757 | 0.7243 | [0.9459 0.0012 0.0064 0.002] | 87.50 | |
0 | 0.8280 | 0 | 0.3375 | 0.6625 | ||||
0 | 0.9589 | 0 | 0.7118 | 0.2882 | ||||
0 | 0.9808 | 0 | 0.8251 | 0.1749 | ||||
0 | 0.9947 | 0 | 0.7574 | 0.2426 | ||||
Gap | 0 | 0.6259 | 0 | 0.2844 | 0.7156 | [0.0167 0.9896 0.0001 0.0001] | 91.25 | |
0 | 0.8775 | 0 | 0.3764 | 0.6236 | ||||
0 | 0.9742 | 0 | 0.6836 | 0.3164 | ||||
0 | 0.9922 | 0 | 0.7743 | 0.2257 | ||||
0 | 0.9957 | 0 | 0.7438 | 0.2562 | ||||
Fractured | 0 | 0.6230 | 0 | 0.2859 | 0.7141 | [0.1096 0.0220 0.8533 0.0004] | 88.75 | |
0 | 0.8749 | 0 | 0.4144 | 0.5856 | ||||
0 | 0.9673 | 0 | 0.7629 | 0.2371 | ||||
0 | 0.9890 | 0 | 0.8116 | 0.1884 | ||||
0 | 1.0000 | 0 | 0.9957 | 0.0033 | ||||
Bad spring | 0 | 0.7026 | 0 | 0.2932 | 0.7068 | [0.0001 0.0011 0.0854 0.9947] | 93.75 | |
0 | 0.9006 | 0 | 0.4753 | 0.5247 | ||||
0 | 0.9756 | 0 | 0.7141 | 0.2859 | ||||
0 | 0.9944 | 0 | 0.7704 | 0.2296 | ||||
0 | 1.0000 | 0 | 0.7853 | 0.2147 | ||||
5. Conclusions
In the paper, an integration approach based on LMD and AR-GARCH is proposed for the fault diagnosis of reciprocating compressor gas valve. AR-GARCH model can effectively extract the feature of non-stationary vibration signal without any prior knowledge about fault mechanism of gas valve vibration signals. However, the gas valve signal presents a strong non-stationary characteristic and often corrupted by noise, so before AR-GARCH model is established, the non-stationary of gas valve signal should be alleviated firstly. LMD method can effectively decompose a non-stationary signal into a set of physically meaningful PFs and a trend term. Compared with wavelet and EMD, LMD method not only can effectively alleviate the non-stationary feature and restrain the end effect of non-stationary signal, but also can accurately improve the resolution of time-frequency analysis. The first five PF components of gas valve signal are modeled by AR(1)-GARCH(1, 1) as the feature vectors, and then recognized by the neural network. The results indicate that high diagnosis accuracy can be obtained by integrating LMD method and AR-GARCH model. So the approach proposed in the paper provides an effective measure to extract the fault feature of reciprocating compressor gas valve.
References
-
Liu W. H., Ang H. S. Study of failure diagnostic methods and intelligent diagnostic system for reciprocating compressors. International Journal of Plant Engineering and Management, Vol. 7, Issue 3, 2002, p. 127-133.
-
Srinivasan K., Panickar P., Raman G., et al. Study of coupled supersonic twin jets of complex geometry using higher-order spectral analysis. Journal of Sound and Vibration, Vol. 323, Issues 3-5, 2009, p. 910-931.
-
Wang Y. X., Liang M. Identification of multiple transient faults based on the adaptive spectral kurtosis method. Journal of Sound and Vibration, Vol. 331, Issue 2, 2012, p. 470-486.
-
Choi M. S., Park J. A., Hwang S. Y. Asymmetric GARCH processes featuring both threshold effect and bilinear structure. Statistics and Probability, Vol. 82, Issue 3, 2012, p. 419-426.
-
Ding H., Wu Y., Yang S. Z. Fault Diagnosis by Time Series Analysis. Applied Time Series Analysis, World Scientific Publishing Co., Singapore, 1989.
-
Cheng J. S., Yu D. J., Yang Y. A fault diagnosis approach for roller bearing based on EMD method and AR model. Mechanical Systems and Signal Processing, Vol. 20, Issue 2, 2006, p. 350-362.
-
Grenier Y. Time-dependent ARMA modeling of non-stationary signals. IEEE Transactions on ASSP, Vol. 31, Issue 4, 1983, p. 899-911.
-
Israel C. Modeling speech signals in the time-frequency domain using GARCH. Signal Processing, Vol. 84, Issue 12, 2004, p. 2453-2459.
-
Bollerslev T. Generalized autoregressive conditional heteroscedasticity. Journal of Econometrics, Vol. 31, Issue 1, 1986, p. 307-327.
-
Engle R. Autoregressive conditional heteroskedasticity with estimates of the variance of U.K. inflation. Econometrica, Vol. 50, Issue 4, 1982, p. 987-1008.
-
Li W., Ling S., Mcaleer M. Generalized autoregressive conditional heteroscedasticity. Journal of Econometrics Surveys, Vol. 16, Issue 22, 2002, p. 245-269.
-
Hyvarinen A., Ramkumar P., Parkkonen L. Independent component analysis of short-time Fourier transform for spontaneous EEG/MEG analysis. Neuroimage, Vol. 49, Issue 1, 2010, p. 257-271.
-
Forte L. A., Garufi F. Blind source separation and Wigner-Ville transform as tools for extraction of the gravitational wave signal. Physical Review D, Vol. 83, Issue 12, 2011, p. 1-12.
-
Wang Y. X., He Z. J., Zi Y. Y. Enhancement of signal denoising and multiple fault signatures detecting in rotating machinery using dual-tree complex wavelet transform. Mechanical Systems and Signal Processing, Vol. 24, Issue 1, 2010, p. 119-137.
-
Yang Y. B., Chang K. C. Extraction of bridge frequencies from the dynamic response of a passing vehicle enhanced by the EMD technique. Journal of Sound and Vibration, Vol. 322, Issue 4, 2009, p. 718-739.
-
Blodt M., Chabert M., Regnier J., Faucher J. Mechanical load fault detection in induction motors by stator current time-frequency analysis. IEEE Transactions on Industry Applications, Vol. 42, Issue 5, 2006, p. 1454-1463.
-
Wu J. D., Huang C. K. An engine fault diagnosis system using intake manifold pressure signal and Wigner-Ville distribution technique. Expert Systems with Applications, Vol. 38, Issue 1, 2011, p. 536-544.
-
Cheng J. S., Yu D. J., Tang J. S. Application of SVM and SVD technique based on EMD to the fault diagnosis of the rotating machinery. Shock and Vibration, Vol. 16, Issue 1, 2009, p. 89-98.
-
Huang N. E., Shen Z., Long S. R. The empirical mode decomposition and the Hilbert spectrum for nonlinear and non-stationary time series analysis. Proceedings of the Royal Society of London, Vol. 454, 1998, p. 903-995.
-
Lei Y. G., He Z. J., Zi Y. Y. Application of the EEMD method to rotor fault diagnosis of rotating machinery. Mechanical Systems and Signal Processing, Vol. 23, Issue 4, 2009, p. 1327-1338.
-
Cheng J. S., Yu D. J., Yang Y. Application of support vector regression machines to the processing of end effects of Hilbert-Huang transform. Mechanical Systems and Signal Processing, Vol. 21, Issue 3, 2007, p. 1197-1211.
-
Huang N. E., Wu M. C., Long S. R. A confidence limit for the empirical mode decomposition and Hilbert spectral analysis. Proceedings of the Royal Society of London, Vol. 459, Issue 7, 2003, p. 2317-2345.
-
Cheng J. S., Yu D. J., Yang Y. Research on the intrinsic mode function (IMF) criterion in EMD method. Mechanical Systems and Signal Processing, Vol. 20, Issue 5, 2006, p. 817-824.
-
Qin S. R., Zhong Y. M. A new envelope algorithm of Hilbert-Huang transform. Mechanical Systems and Signal Processing, Vol. 20, Issue 6, 2006, p. 1941-1952.
-
Jonathan S. S. The local mean decomposition and its application to EEG perception data. Journal of the Royal Society Interface, Vol. 2, Issue 11, 2005, p. 443-454.
-
Tang Y. F., Liu S. L., Jiang R. H. Fault diagnosis based on nonlinear complexity measure for reciprocating compressor. Journal of Mechanical Engineering, Vol. 48, Issue 3, 2012, p. 102-107.
-
Liu W. Y., Gao Q. W., Ye G., et al. A novel wind turbine bearing fault diagnosis method based on integral extension LMD. Measurement, Vol. 74, 2015, p. 70-77.
-
Tang Y. F., Zou L. Q., Lei Y. Fault diagnosis of reciprocating compressor gas valve based on local mean decomposition and Lempel-Ziv complexity. Journal of Vibroengineering, Vol. 16, Issue 7, 2014, p. 3609-3619.
Cited by
About this article

This work in this is supported by Natural Science Foundation of Heilongjiang Province of China (Grant No. QC2014C045) and Natural Science Foundation of Northeast Petroleum University (Grant No. NEPUQN2014-17).
